While the indexes are showing us some fatigue and reversal signals, certain stocks in the benchmark indexes aren’t yet exhausted with what they intend to do, even as other major stocks show the negative trend taking place. It is important to watch the trends unfolding in some of these major stocks as it gives us more insight into the road ahead for the indexes too.
So let’s dive deeper:
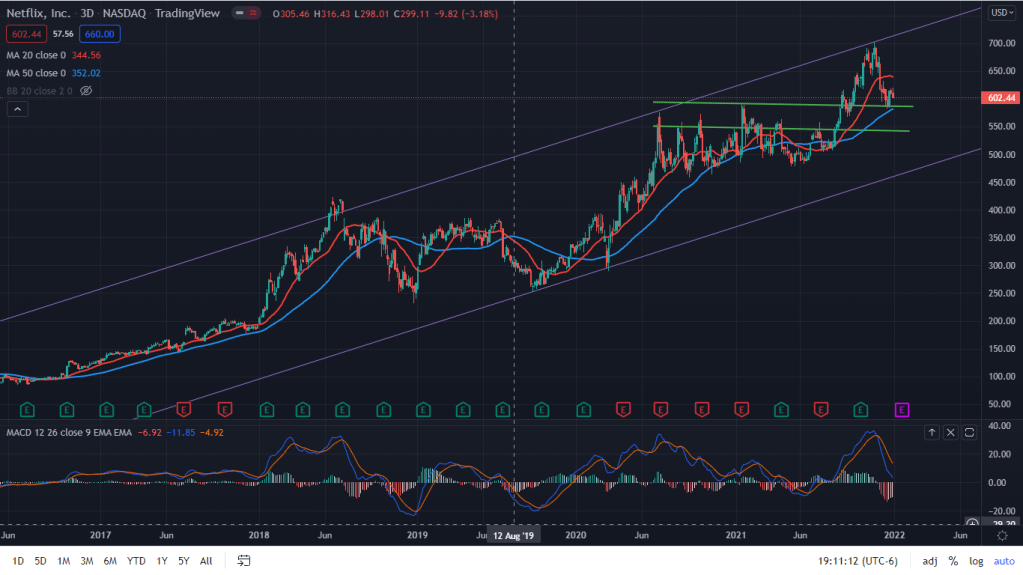
Netflix: Even as the major trend has remained up and away for last several years and followed a rising channel, it hasn’t quite given up on the trend and what is visible on the charts right now is the breakout of a high base, inability to cross past the upper end of the rising channel and then backtest of the high base demand zone. As long as it continues to remain above the demand zone and the 50SMA, the trend continues to stay upwards.
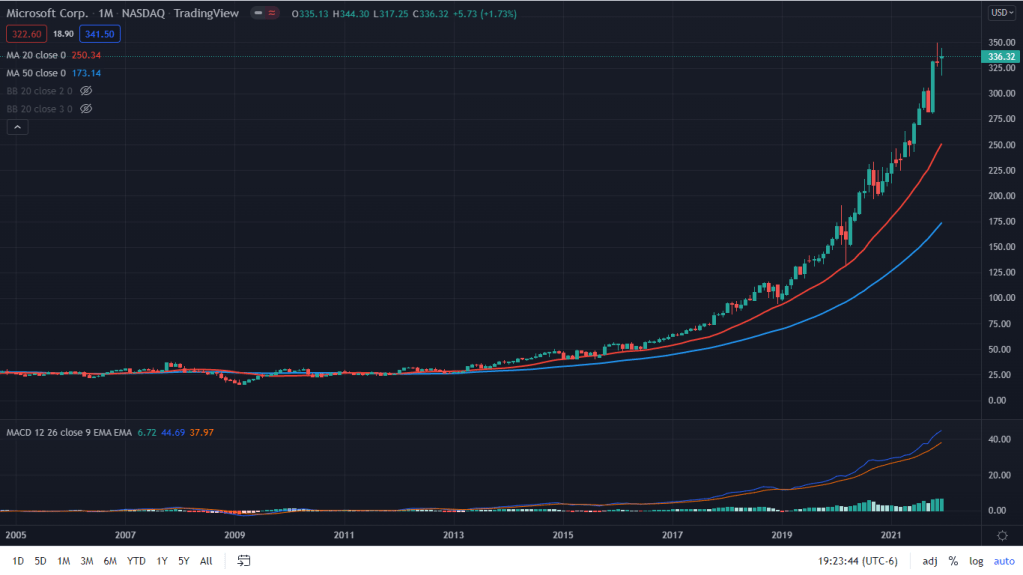
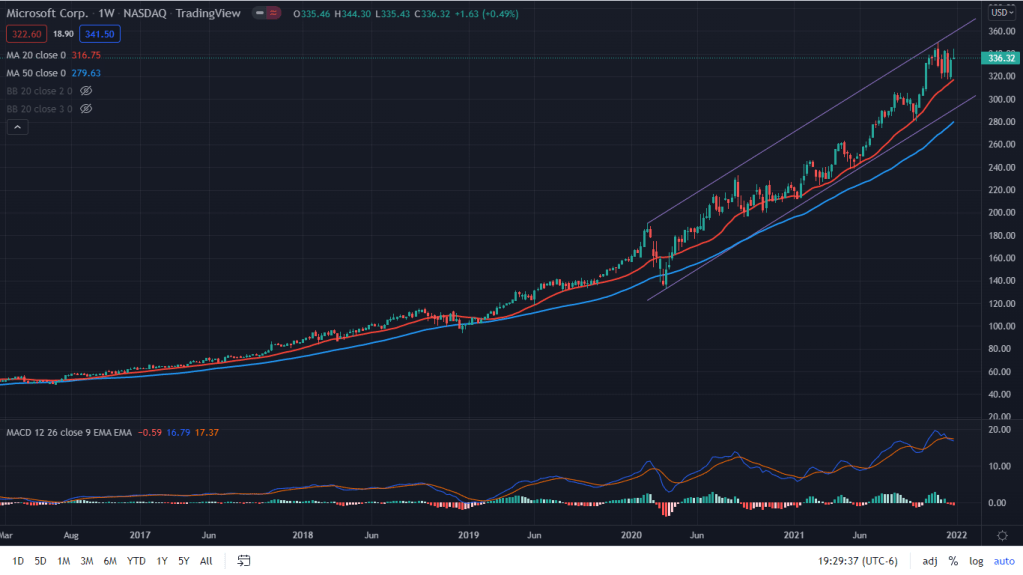
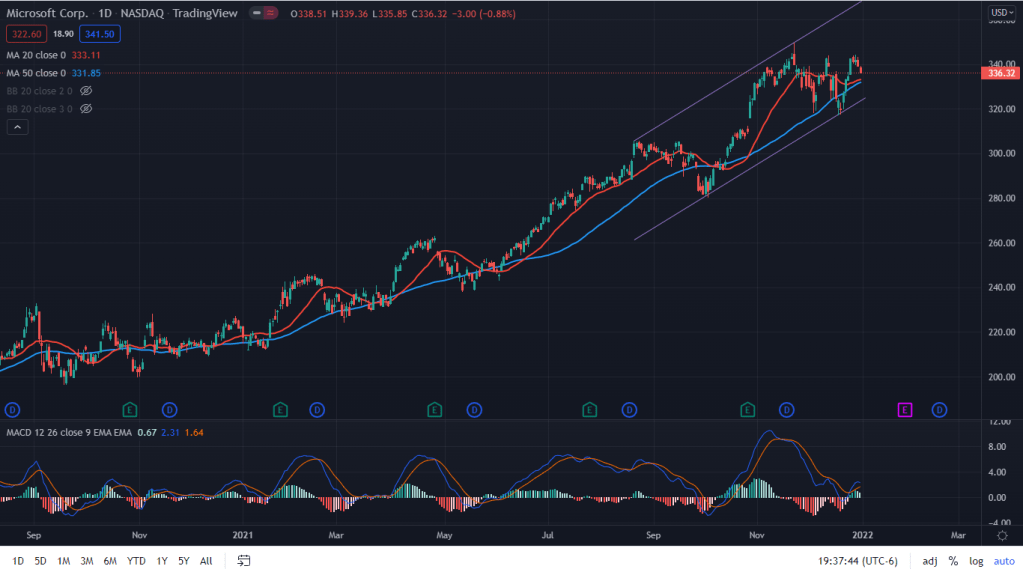
Microsoft: This giant did nothing for years after the dot com crash, but when it finally did, it has put the dot com euphoria to shame! 700 percent rally in last six years! And when one looks at the long term as well as immediate term charts, it probably isn’t done yet. Every dip gets bought into and looking at the daily chart below, as long as it manages to stay above the rising trendline and the 50 SMA, the BTDers would continue to march it forward (although two back to back monthly candles are shooting stars and doji – not positive for the bulls).
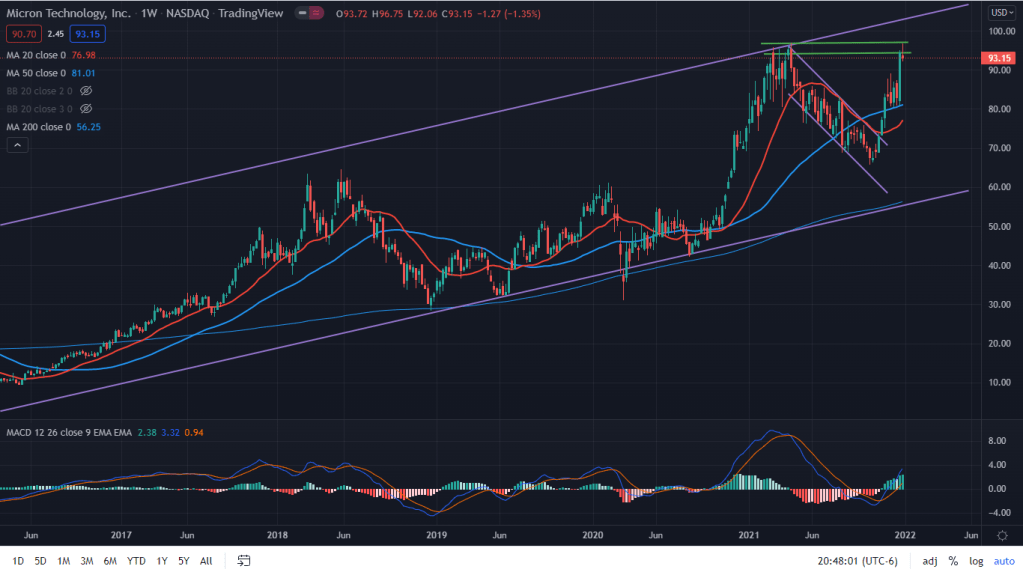
Micron Technology: Amazing run it has seen over the past year and still continues to stay near the all time highs. Although it showed some reversal signs last week near that supply zone, the first week of the new year remains crucial for this tech giant.
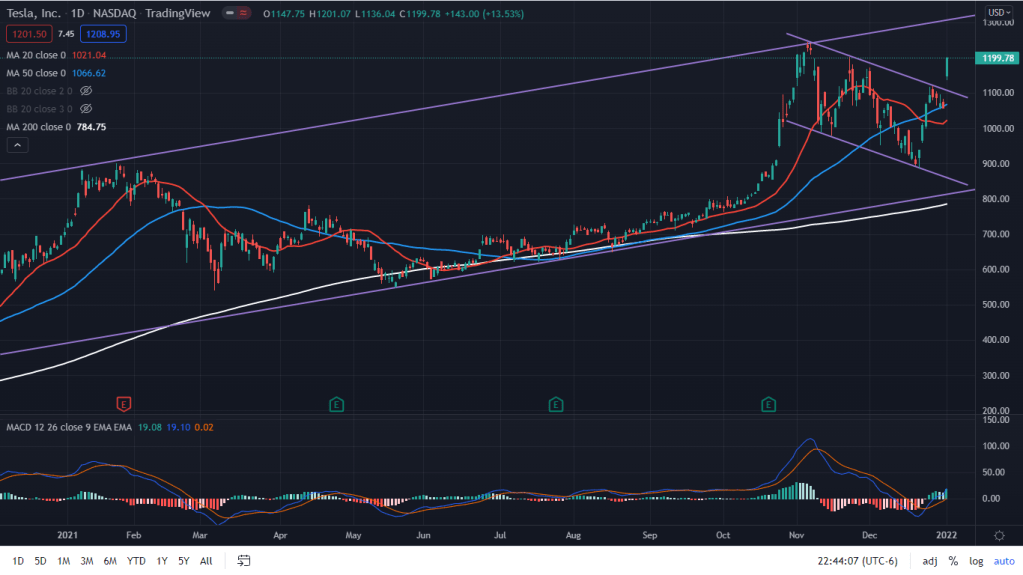
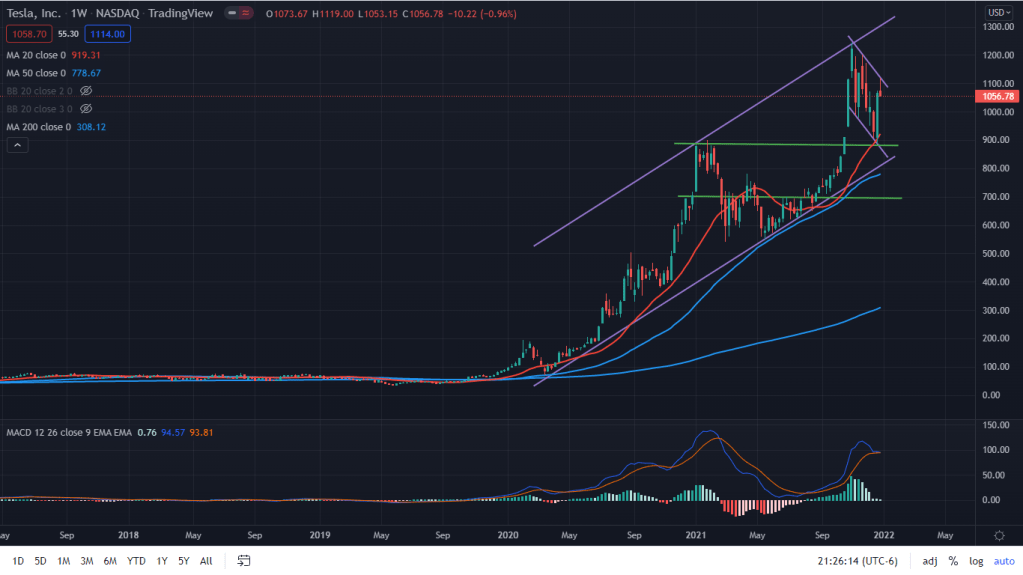
Tesla: The poster boy of this euphoric rally is the EV giant. Just when you think it is done, it gears up and charges ahead further. While many (including me) thought that 1250ish was the top in place for Tesla, this bull flag formation and the breakout on the first day of the new year surprised everyone. Even as I’m not a fundamental buyer of this stock, technically I surrender to what the price is showing up, and that remains up.
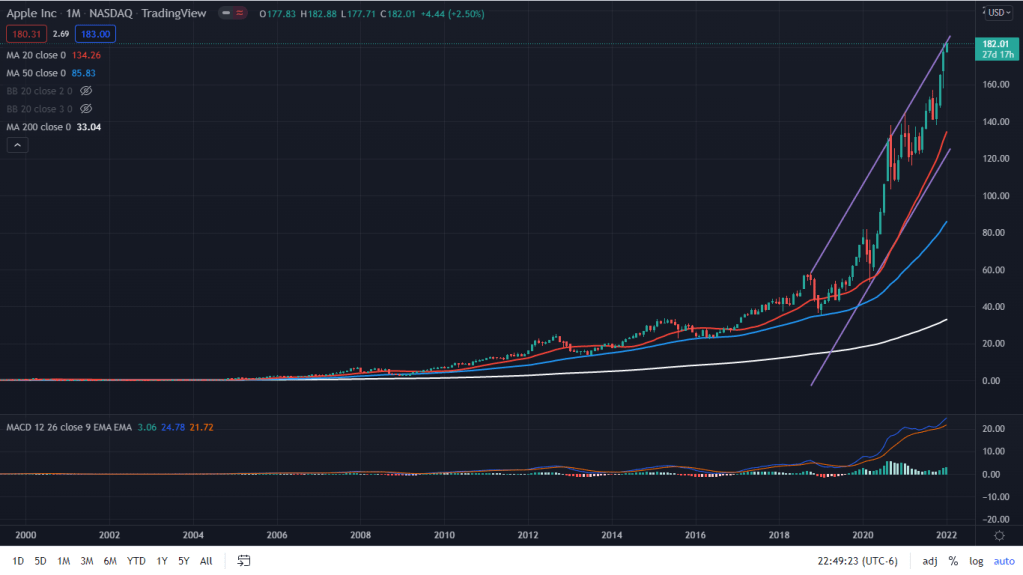
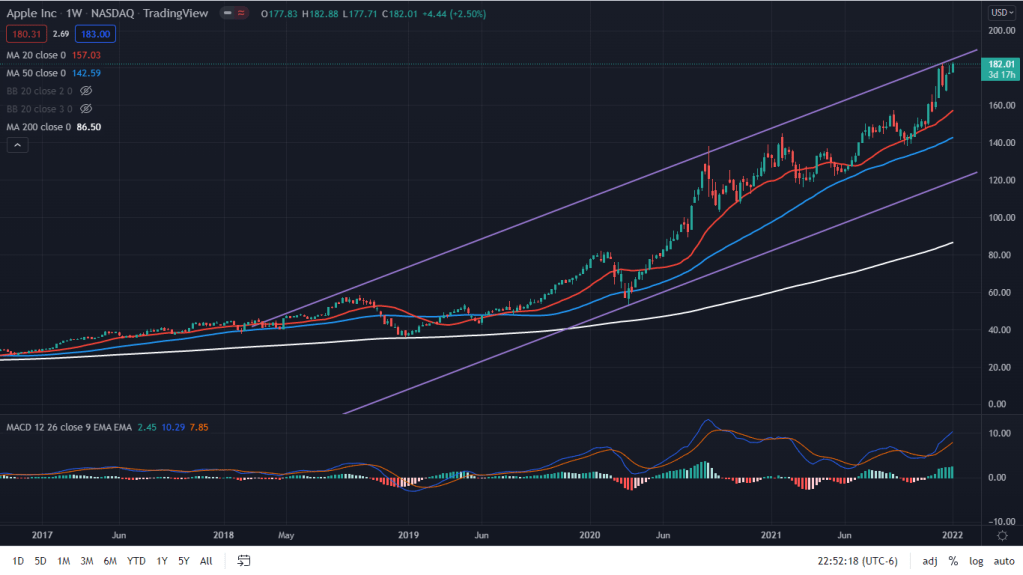
Apple: Trillions are just numbers
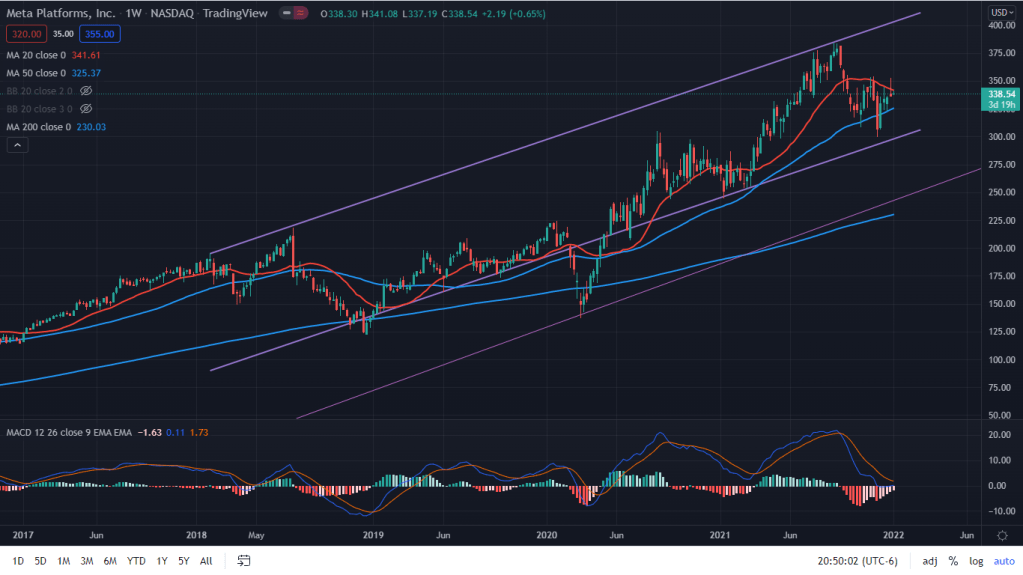
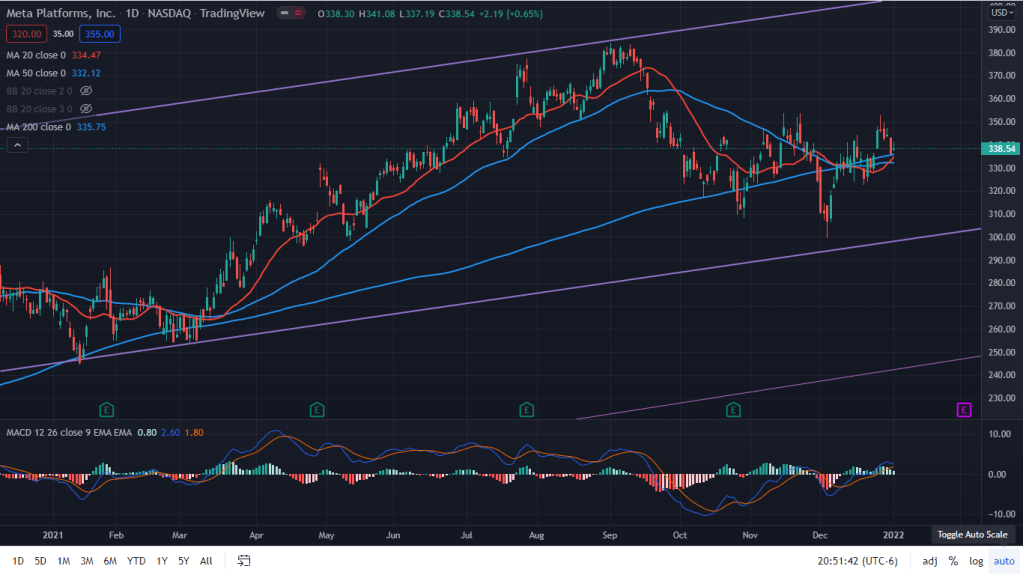
Meta Platforms: While the long term seems to be shaking up on the social media behemoth, the short term did show some signs of life, but the trend has not yet turned positive decisively as the daily chart shows here. Keep an eye on that 355 mark!
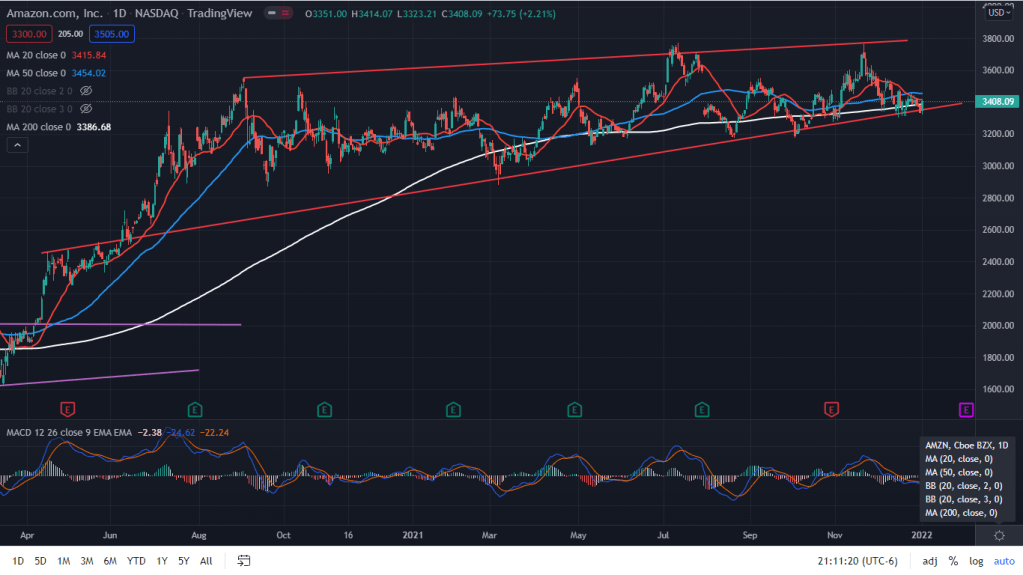
Amazon: Rally. Pause. Gather steam. Rally. That’s been the hallmark of this Bezos led stock throughout. Can it be any different this time?
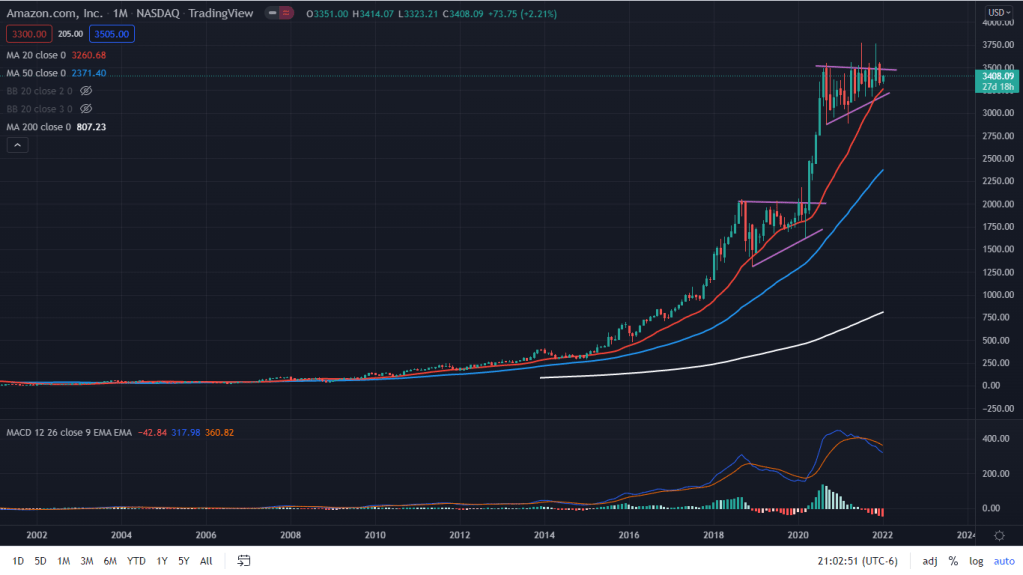
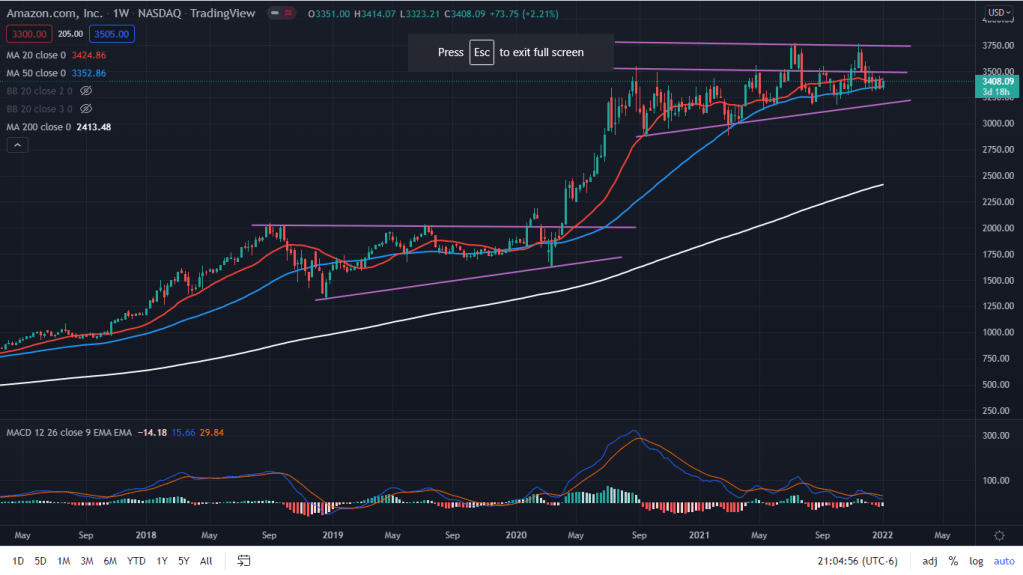
The monthly and the weekly charts above show yes, but when you look closely at the daily, it looks like some signs of worry might be developing. Rising wedge it looks like? Unless something changes it into a rising channel. 3200 remains the sand in the line for bulls and bears both.
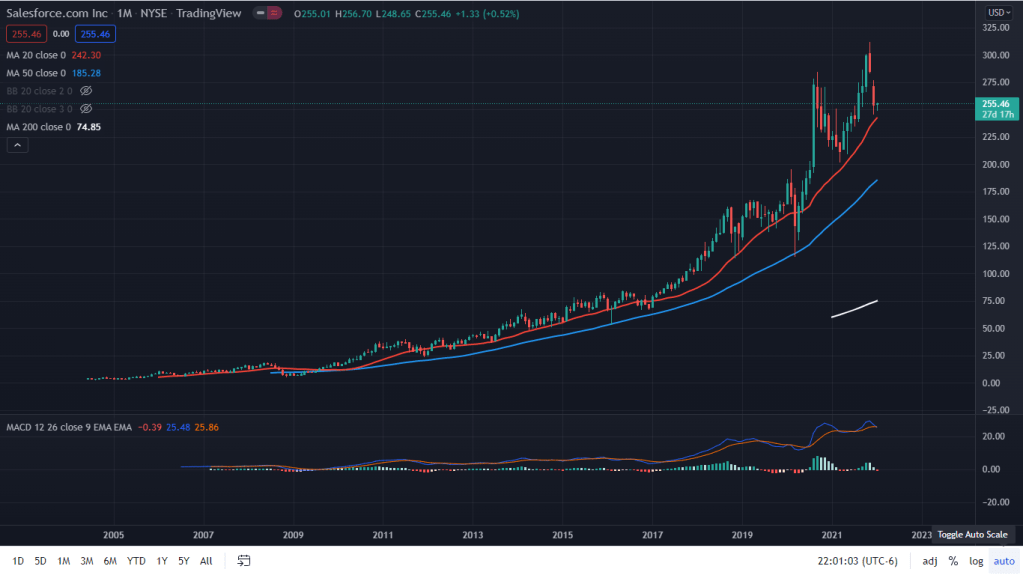
Salesforce: The force to reckon with is what you would believe based on the monthly astounding charts. But..
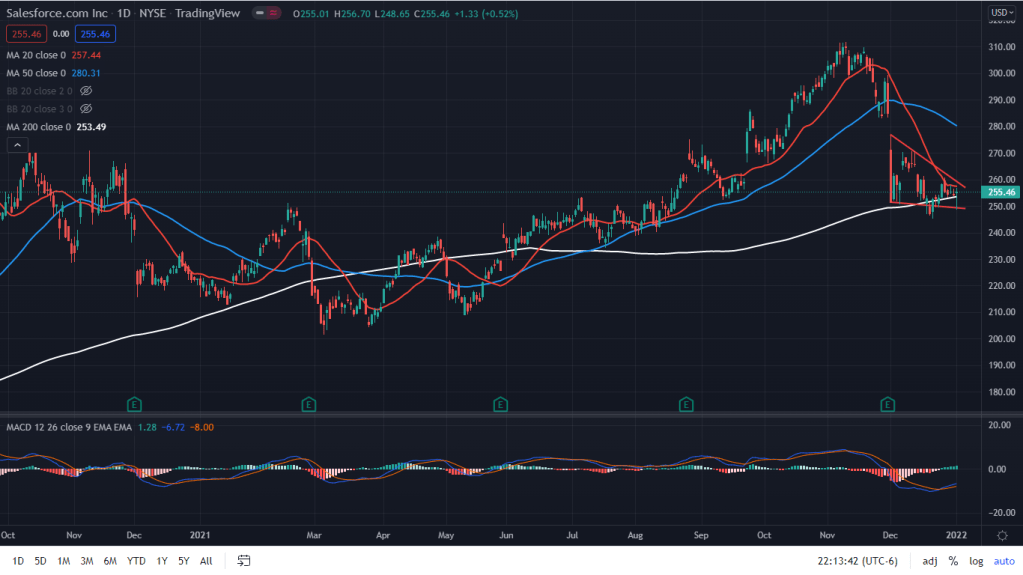
When you look closer on the daily chart, the trend has decisively reversed and is now basing before it gathers more steam and breaks below that 200 days SMA. I wouldn’t want to be long on this one.

Leave a comment