(ES) S&P500 futures: What happened in the last week is certainly not many new traders and investors are attuned to experiencing. A fall of more than 5 percent in a week on a trot for 4 days of the truncated week. It happened in a jiffy after ES giving up its 50DMA and an important trendline support that held on from the lows of March 2020. No wonder the fall has been so sharper and faster that it even broke past 200DMA.
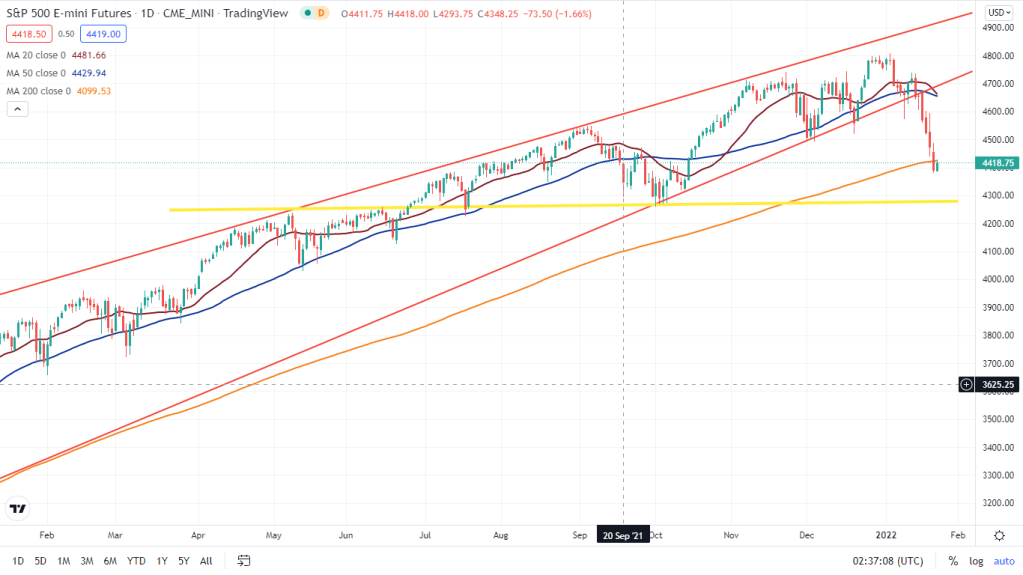
Now that a much needed fall in many of those stocks has ensued, one would like to ask how much? How far? How long?
From purely technical and levels perspective, 4250-4270 is where one can hope for a some relief rally, provided 200DMA remains broken decisively. As pointed out multiple times on this website (read earlier articles here and here), the correction which has started in the last few days, was in the offing for a while and although one can never be fully prepared for such an eventuality, not expecting it in an environment of a complete madness (or euphoria as pointed out in the first article) is a fullhardy.
Whether technically or fundamentally from valuations perspective, this rally of the past few months on the major indices was stretched on all counts. Lets take a look at some other major indices too:
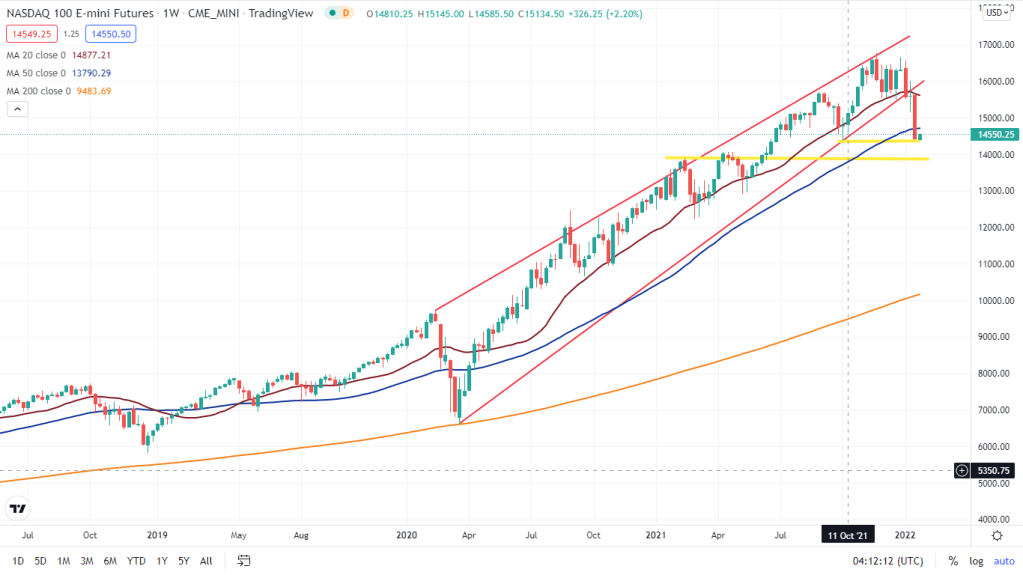
NQ (Nasdaq futures):
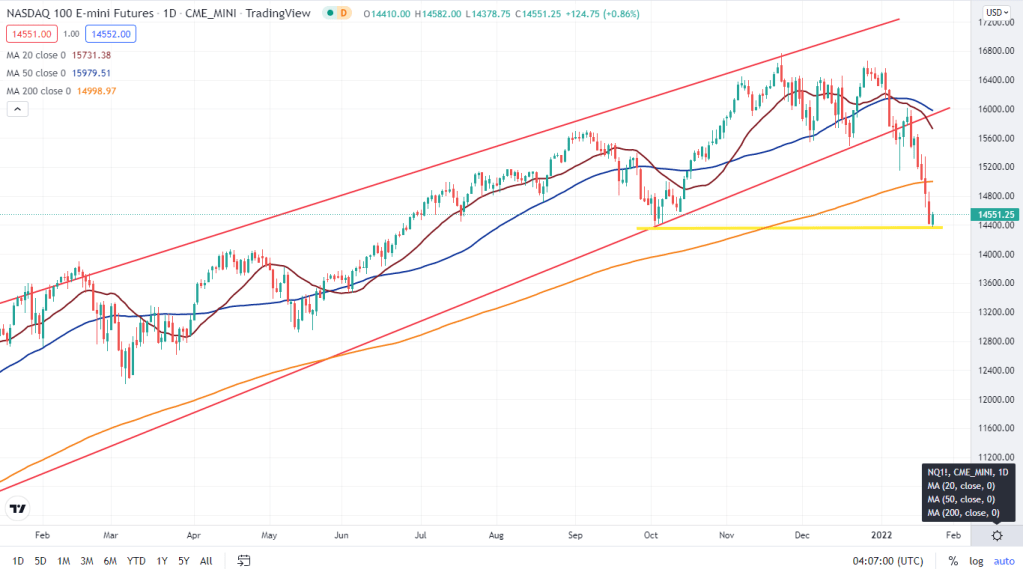
While NQ has fallen the most among major US indices and officially entering a correction zone (more than 10% fall from top), it is sitting exactly at a point where it bounced off last time in October 2021. One can expect a sharp bounce from here, to at least around 200 DMA, which sits at 15,000 and slightly above that towards 15,200 supply area. As long as bulls are unable to cross past these key levels, there are risks to the downside. While on the weekly charts, critical demand zone lies around 13,800-900 area where one can expect another bounce.
YM (Dow futures): While the industrial benchmark index also broke down of a key 200 DMA last week, it stands exactly above the key trendline support area as shown below and a bounce from here should on the anvil
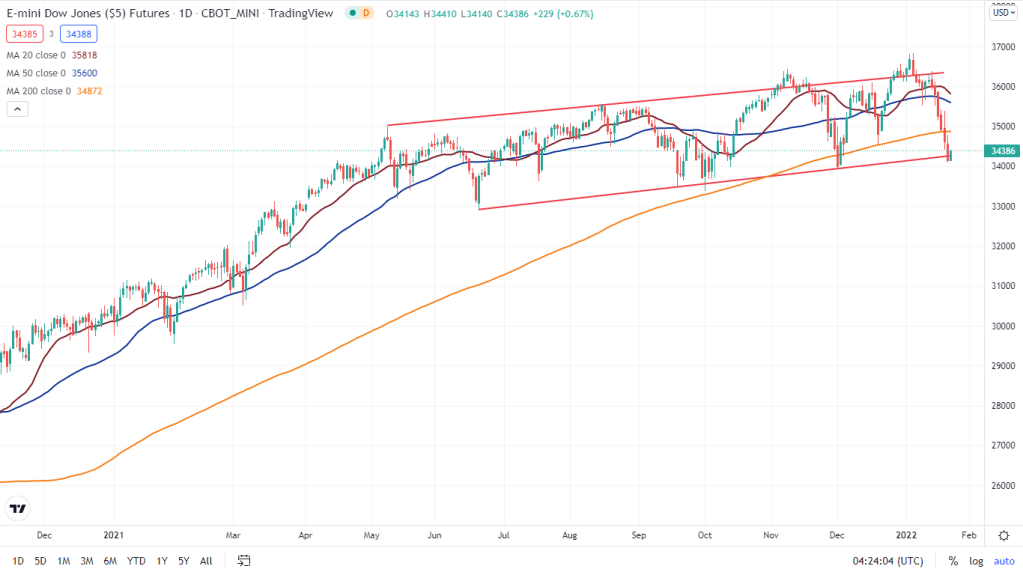
While on all the three major US indices, short term bounce is on the horizon, the trend has decisively turned lower which makes it sell on bounce market and any major relief rally would get sold into.

Leave a comment