What a week that was! Such a sharp fall and whipsaws and then the last hour recovery was just like the End Game was. But is it really all good and bullish from here? Let’s take a look:
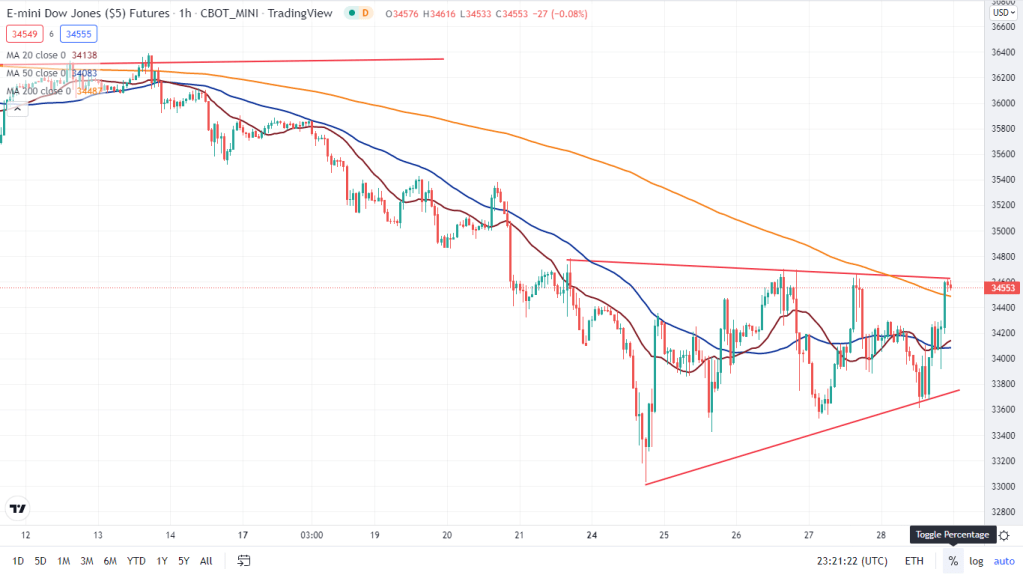
YM futures (Dow Jones Futures): It is still stuck in that ascending triangle on the 1H chart, although bullish, but thats just one way to look at it. But wait a second, can that also be a flag? When we zoom out and look at the larger picture, what do you get?
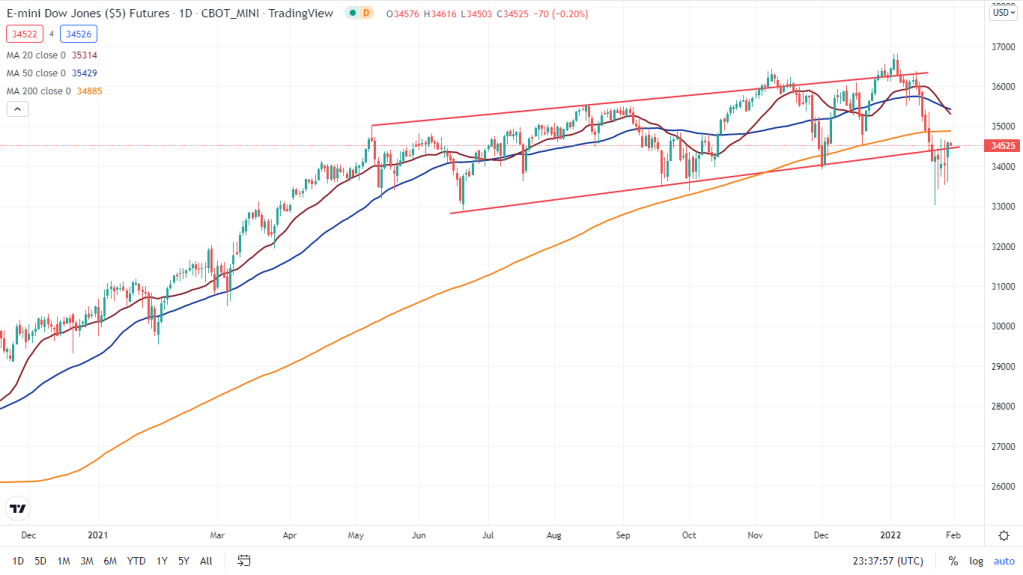
The daily chart has already turned lower with the 20 and 50 MAs pointing out. 200 DMA is still a struggle for the bulls, which sits at 34,885 and bulls aren’t out of the woods yet as long as this hasn’t been decisively crossed and sustained for a week.
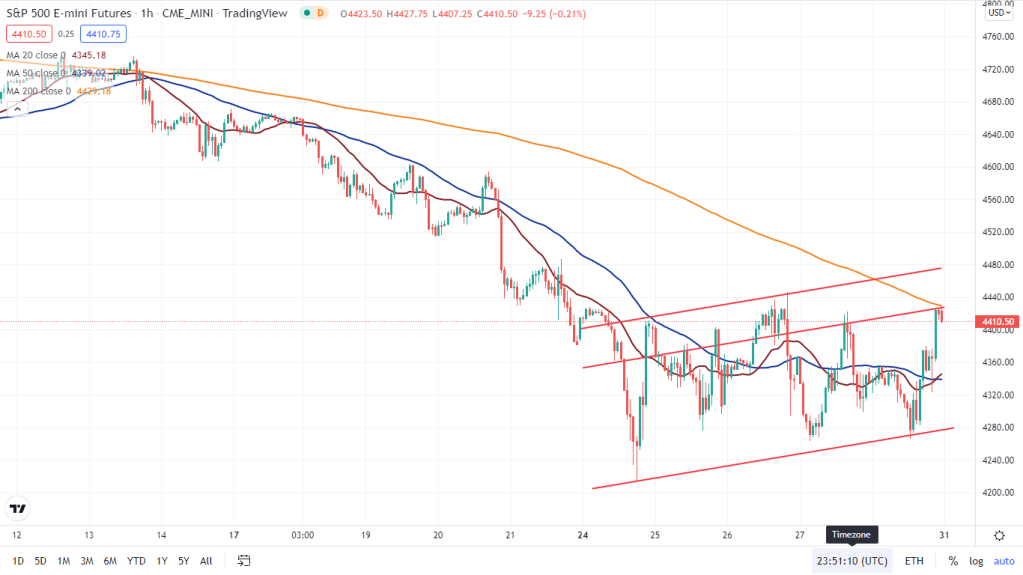
ES Futures: While similar to the Dow, but not bullish on the short term either. Its a bear flag in the making and as long as 4480 is not decisively broken on the upside, bears are in full control of the game.
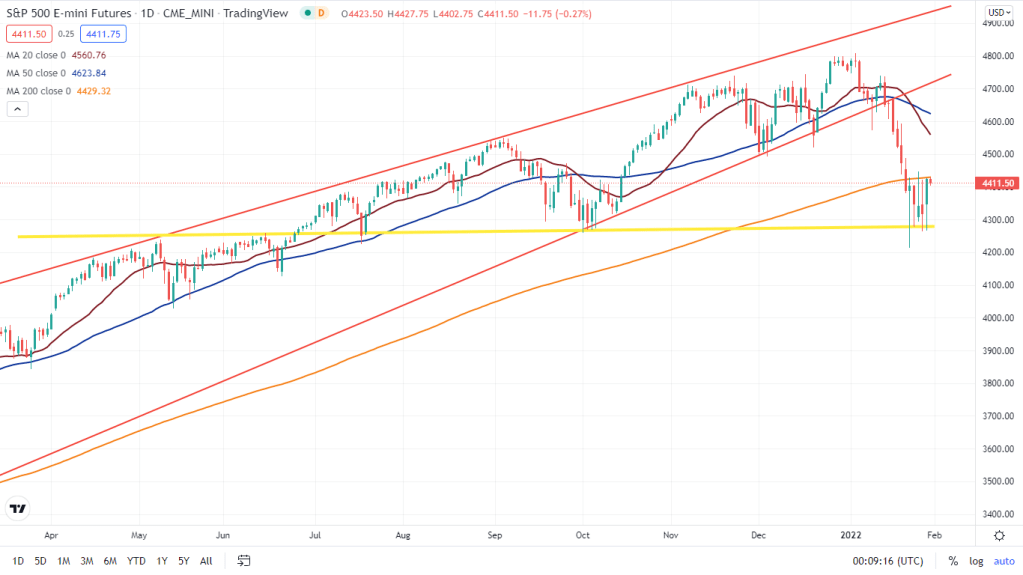
And when we zoom out and look at the daily chart, bears still have the edge on the daily too with 200 DMA just above the price at 4429 and bulls can’t get complacent with the bounce, although they have held on to the lows at the strong demand zone area of 4200-4280.
NQ Futures: Similar to other two major indices, only difference being the pattern – While Dow makes ascending and ES makes bear flag, NQ is making a lower base on the 1H chart – not at all bullish.
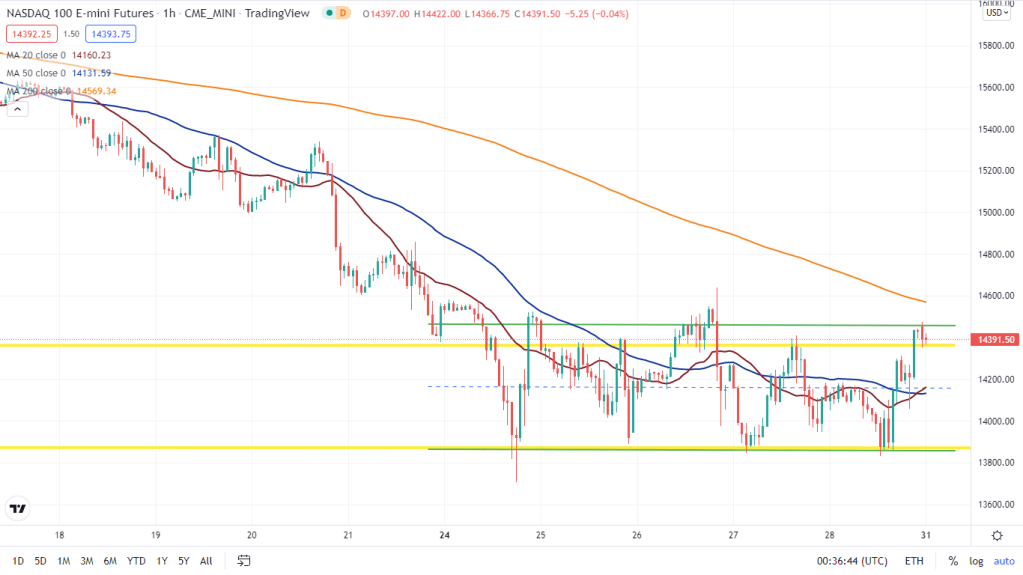
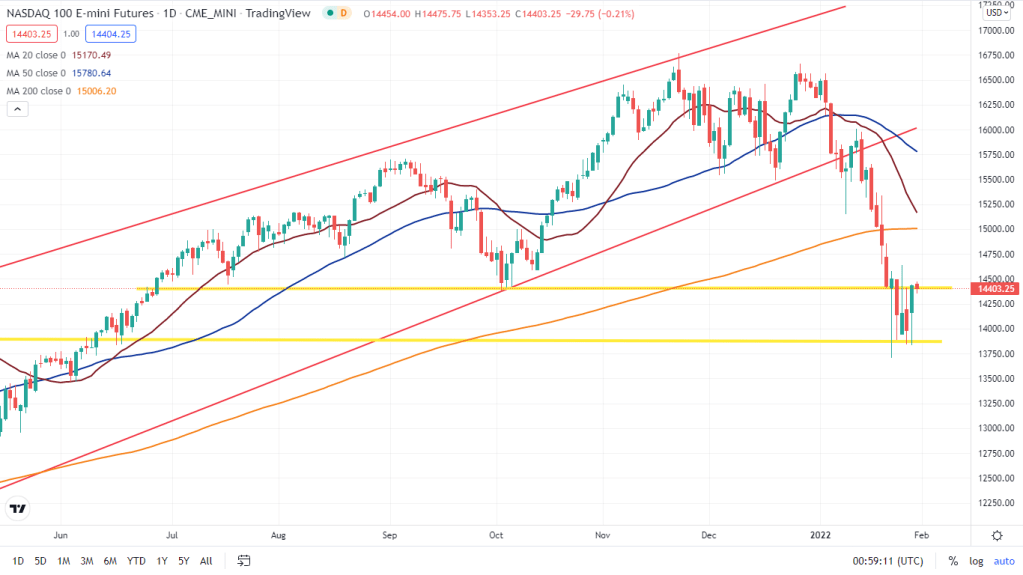
And when we zoom out, NQ is just in the middle of demand and supply zone of 13,800 to 14,500 – A tug-of-war between bulls and the bears. 200 DMA still sits far above at 15,000 a far cry for the bulls yet.
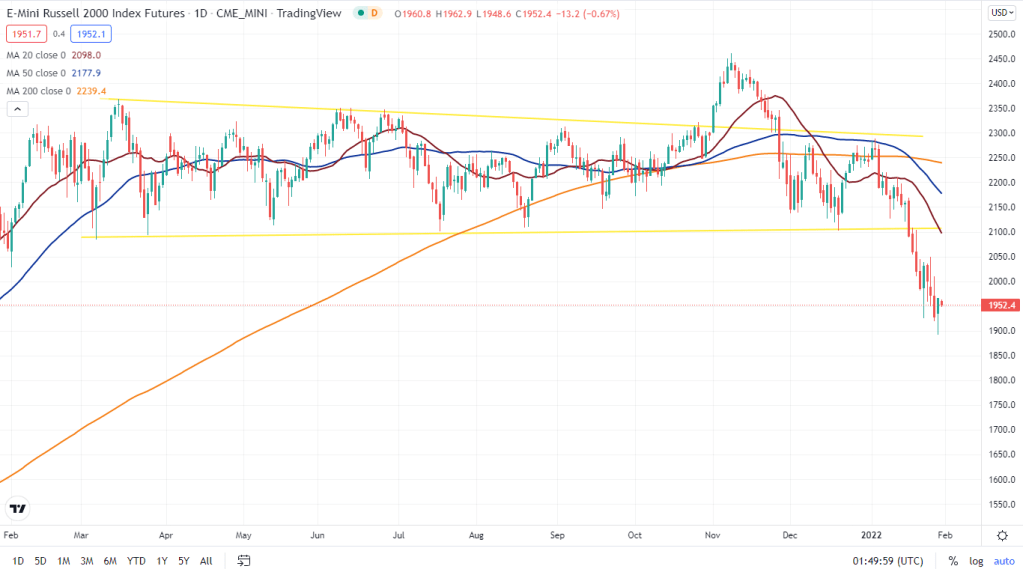
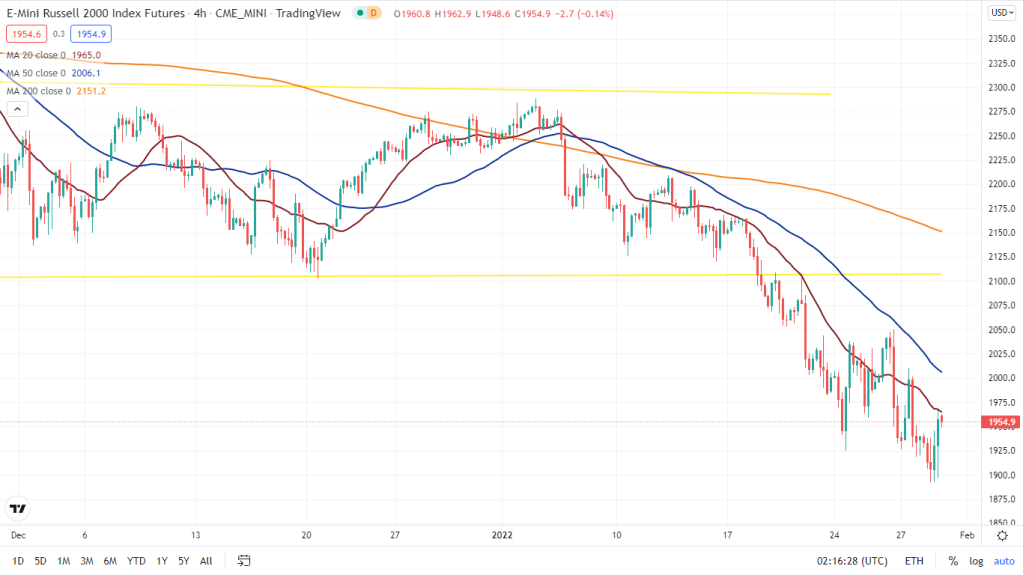
RTY – Rut Small cap Index: Continue to make lower high and lower lows on the 4H chart while on the daily too it continues to stay under pressure. There seems to be no respite for the bulls on the small cap index yet except one thing – The backtest of the breakdown has not yet occurred, which if it occurs that would take the index all the way back to 2100.
Conclusion: Bulls are not at all out of the woods yet and it needs a lot of good news and conviction for the bulls to gain control of the market. For now bears can still play the “sell the bounce” game.

Leave a comment