Stocks have been going through a rough ride for some time now, but that’s not really the case for the big boys of commodities. At least not yet. Some have been stable while others have been rallying as if there is no gravity. Here we deep dive in some of those names.
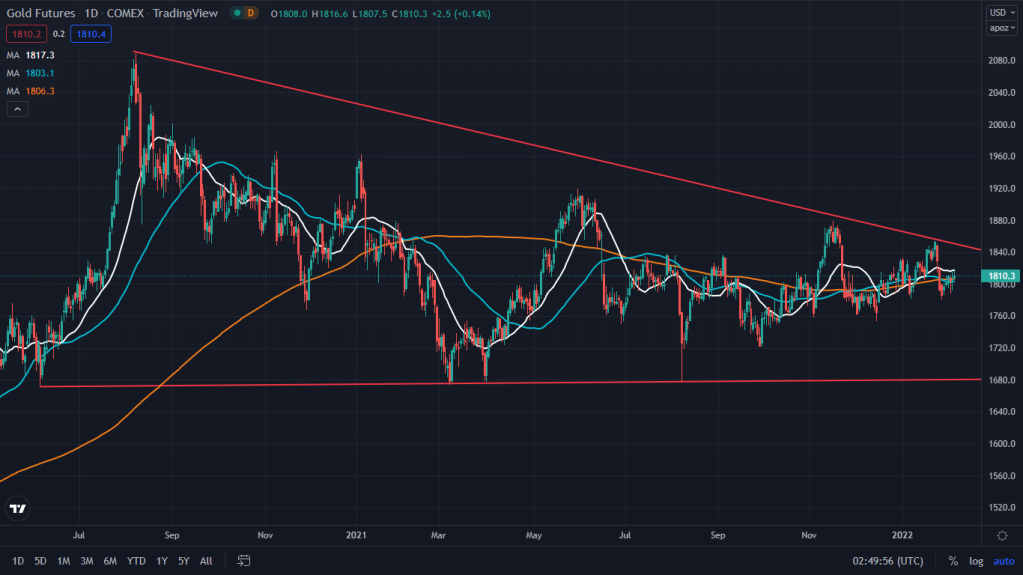
Gold futures (GC): Goldbugs have been waiting for THAT rally for ages and many have now given up on any such. The so called bull flag/triangle on the daily chart has long been forming without much signs of a breakout. Here’s the daily chart:
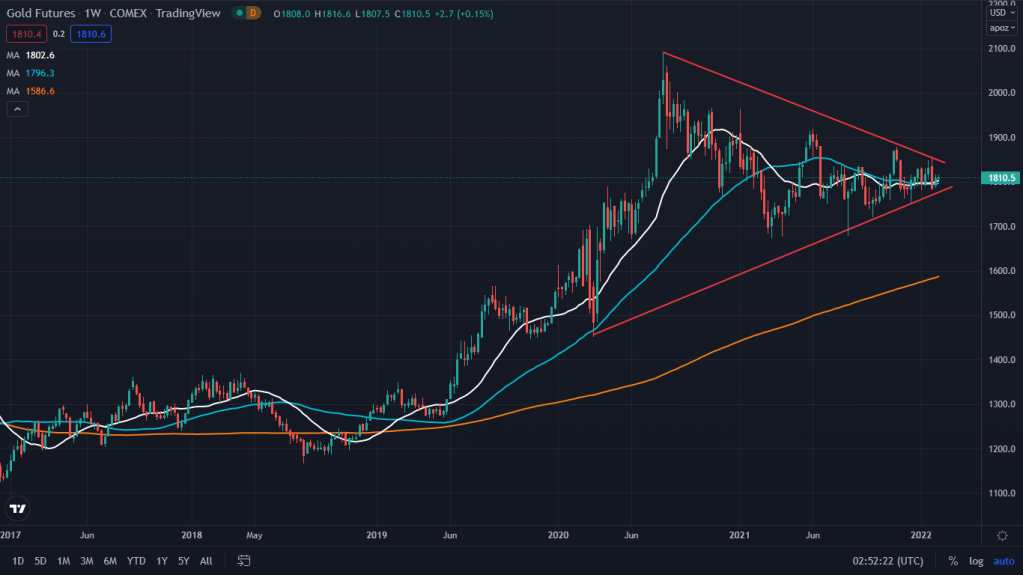
Weekly looks quite similar too: On the verge of breakout of that triangle.
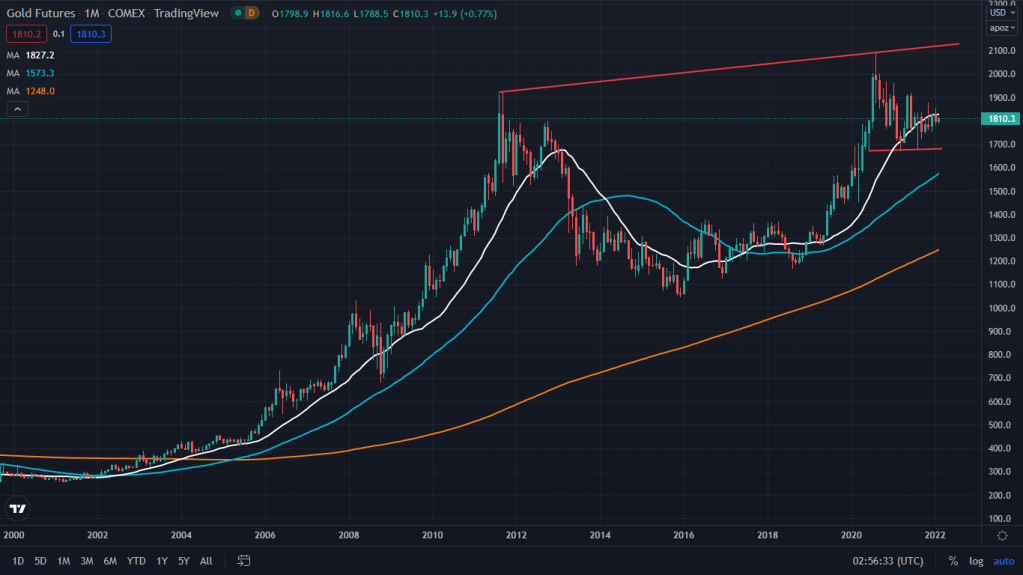
And if zoom out even further, what we get is even more bullish picture on the monthly chart – A Cup and Handle pattern that took long enough time to form and about to see completion of the handle towards the upside, which would target the modest 2100 and the breakout? 3,000 at the least.
Crude (WTI – CL) futures:
For the black gold, lets start with the long term chart before looking at the short term one. While the breakout of the falling wedge on the monthly chart is long known and been credited to, not many took it as seriously as the chart was pointing towards. And now that the price is at its peak, nobody wants to leave the bus.
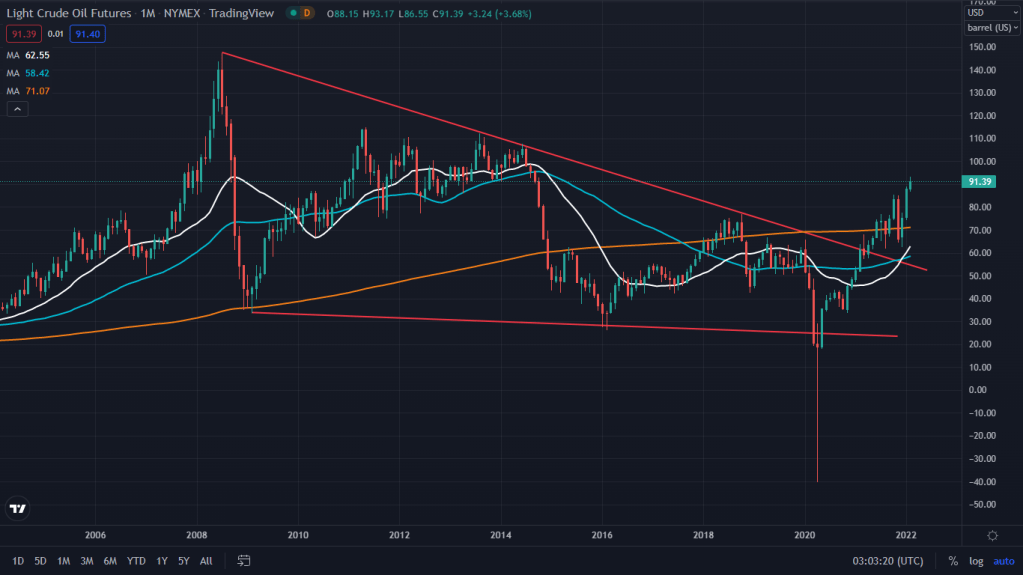
But is it really worth riding the journey at this point? Probably the next chart tells the tale:
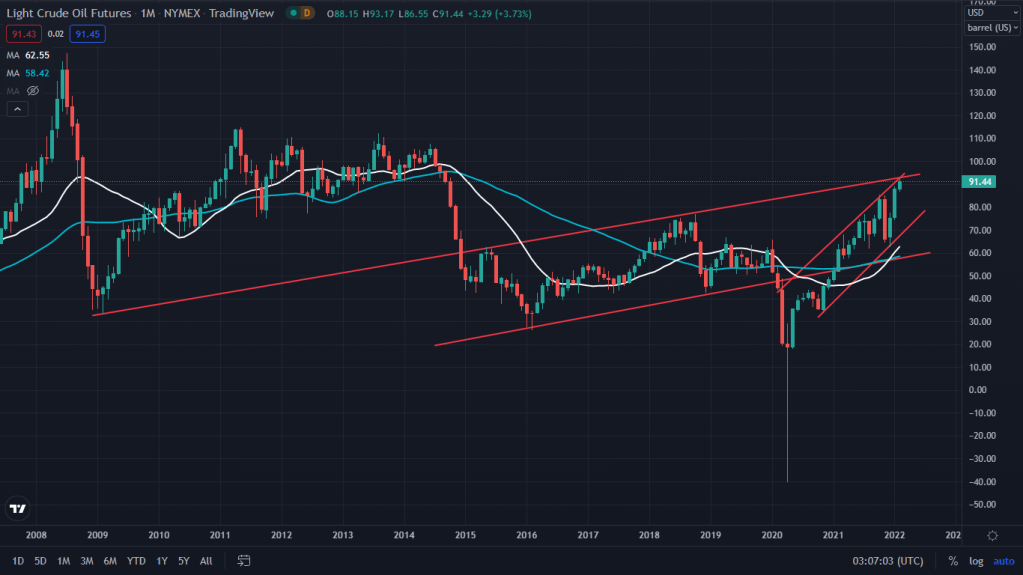
What the chart above shows is that yes the rally is due to the monthly wedge breakout, but its sitting at multiple resistances and due a correction before another leg upwards resumes. The same monthly chart would be targetting sub-80s, but before talking of sub 80s, lets take a look at the daily chart and see what that’s showing?
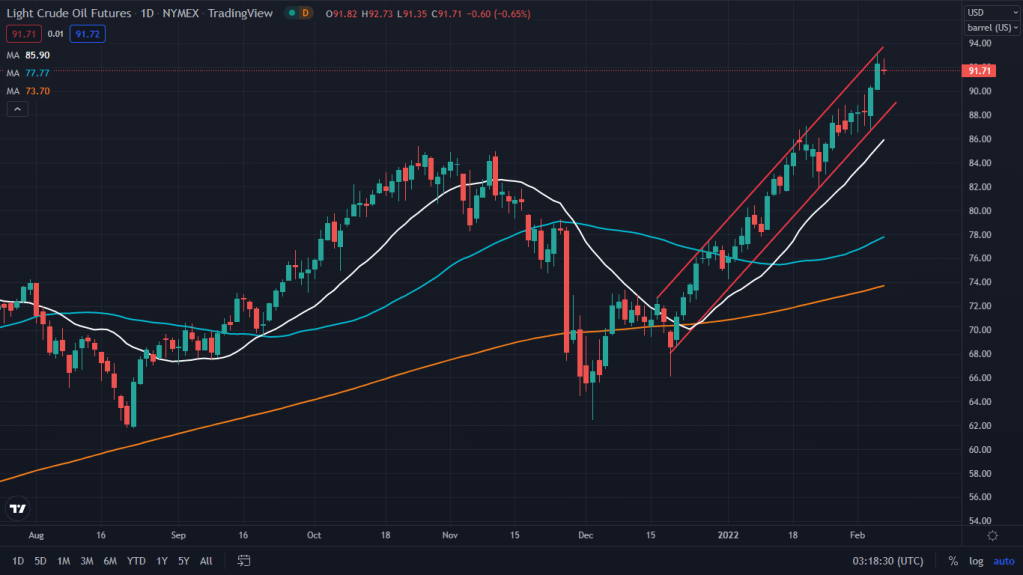
The daily chart looks safe for now with a decent enough correction seems likely towards 88/88.5 where it can see some bounce off the demand zone before respecting the monthly call of slightly bigger correction.
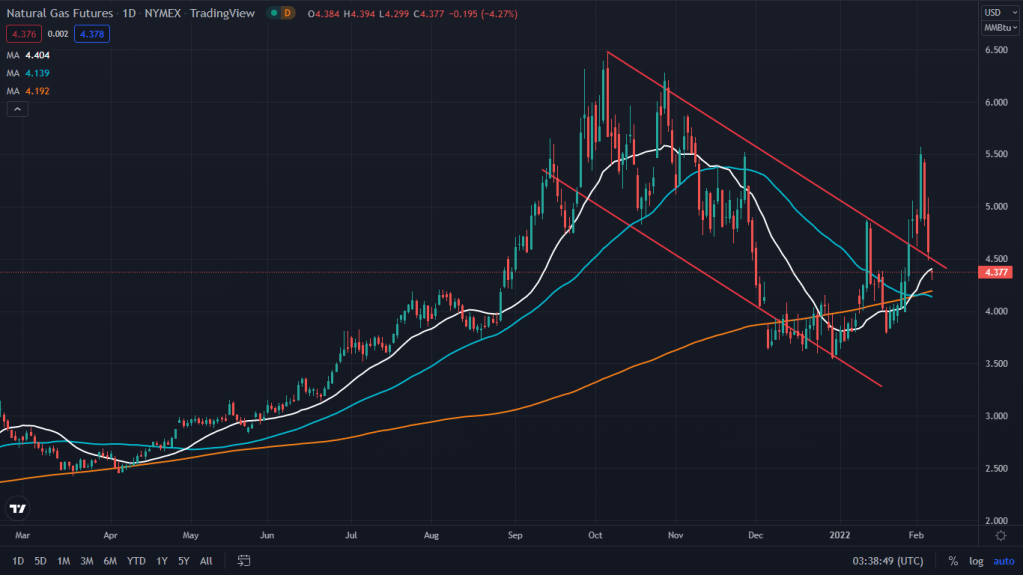
Natural Gas Futures (NG): One of those few commodities that has seen a really rocky ride last few weeks. It broke out of the bull flag last week and rallied about 20 percent in 2 days, only to give it all back towards the breakout line. The price is at a critical juncture where either the breakout turns into a failed breakout or a backtest would be proven. 4.05 is the make or a break level for the bulls.
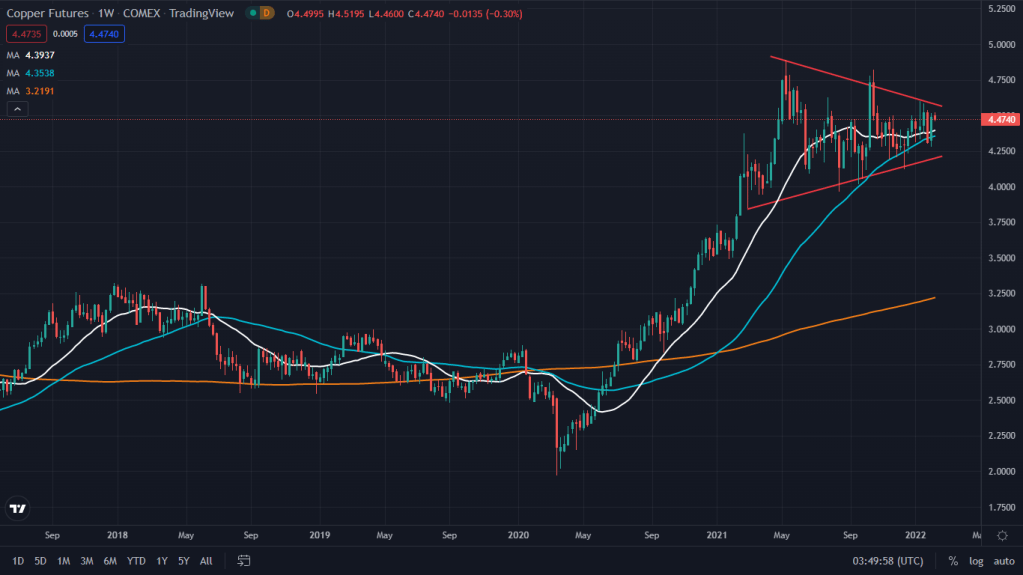
Copper Futures (HG): Longer term, monthly charts have already spoken last year when the prices rallied all the way to 4.9 and couldn’t sustain there. What happened post that is only a long consolidation and breathing as if it wants more.
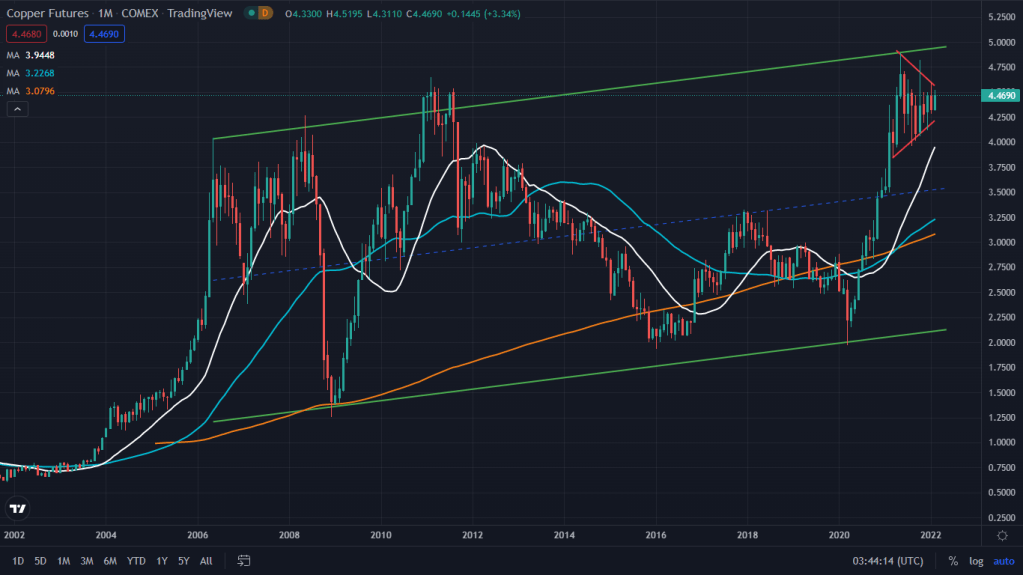
Weekly chart suggests its a high base formation and about time to prove its mettle on the upside. I would be betting on the $5/5.1 as the minimum before any meaningful trend takes shape.
Daily Chart suggests $4.53 is where it breaks out to gain traction for higher levels. I would be a buyer around $4.53/54 area.

Leave a comment