While the “inflation” on stock prices has been cooling off, that can not truly be said yet for most of the commodities. And if the charts below are any guide, the inflation story could get far more uglier for the Fed to handle. I won’t talk much about the macro here and delve straight onto the charts.
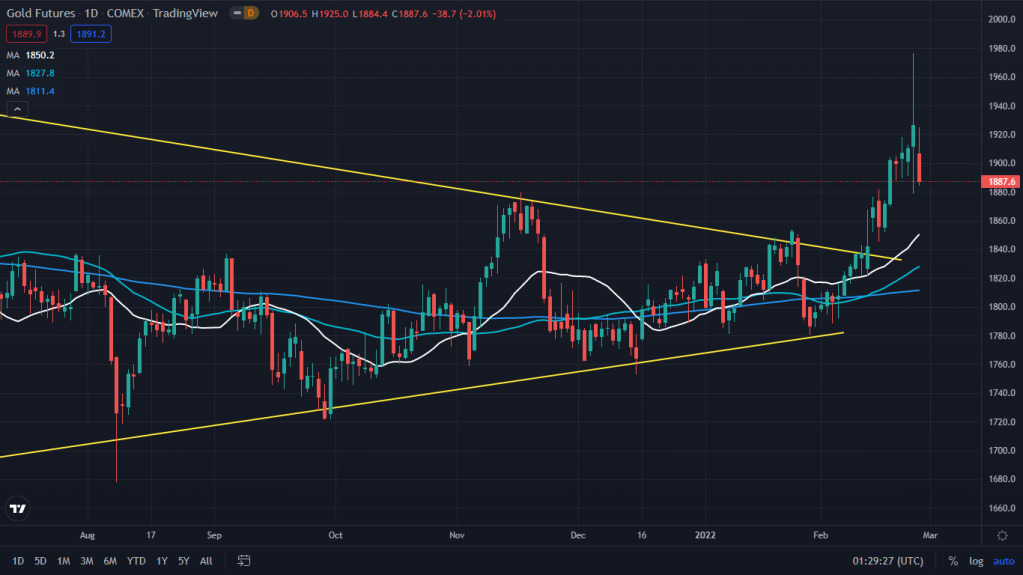
Gold: While the moves in the prices of Gold have been signalling a breakout, the fall from the highs on Friday could easily be termed as move towards backtest. But given the faster development of geopolitical situation with regards to Ukraine and Russia, it’s a sign of uncertainty and that’s sign of bullishness for gold which is a safe heaven in uncertain times. From technical point of view, 1875 and 1850 are the two key levels where the shiny metal would bounce back from its key support on the daily chart as shown below.
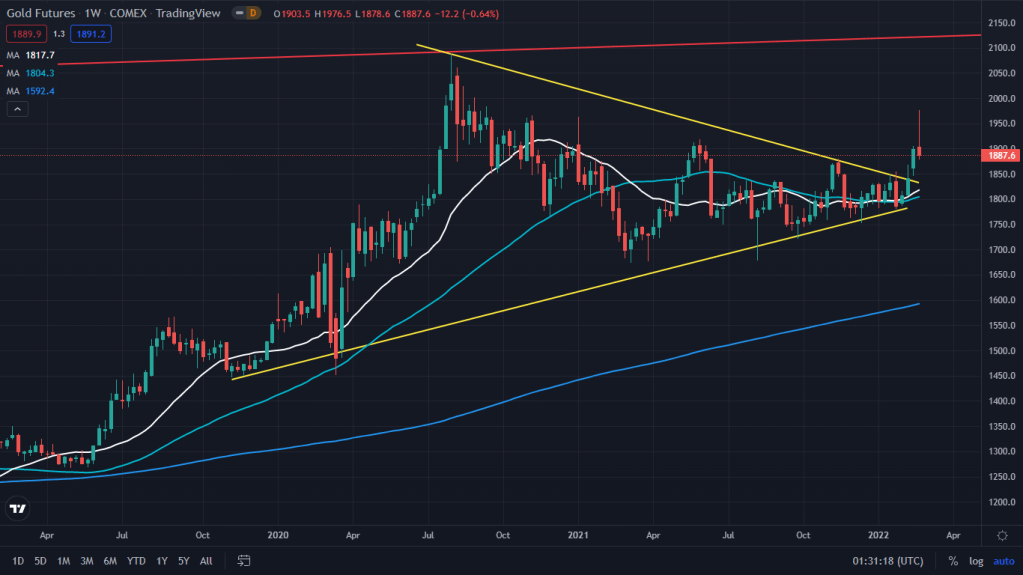
Weekly: The weekly chart clearly shows the breakout from a multi-week consolidation and headed towards 2100-2130 zone in the next few weeks. And please note, that’s the bare minimum for the gold. As the next chart on the monthly time frame shows.
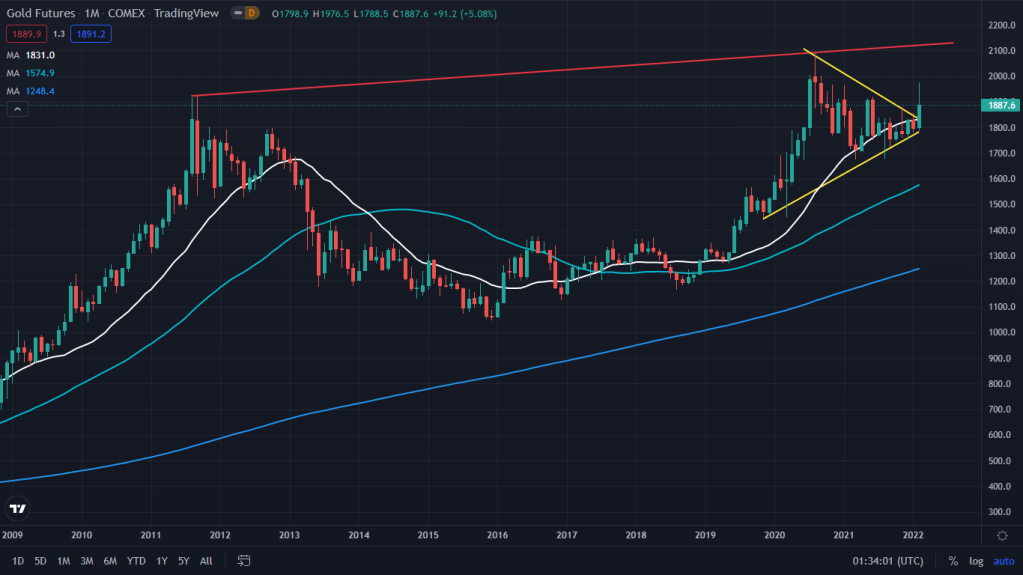
Monthly: The triangle on the weekly is nothing but a completion of C&H pattern on the monthly that has been forming for a decade now. The goldbugs would do good to hold the yellow metal in their portfolio for next few months or probably years as it attempts to breakout of the pattern around 2100-2150. I would like to see 3,000 as the final target for gold once this final run is complete.
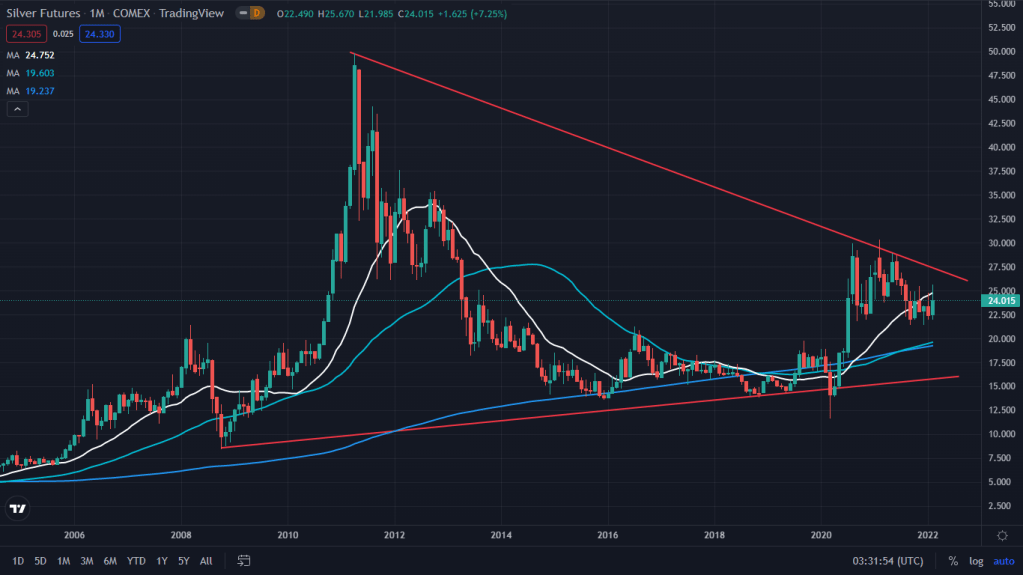
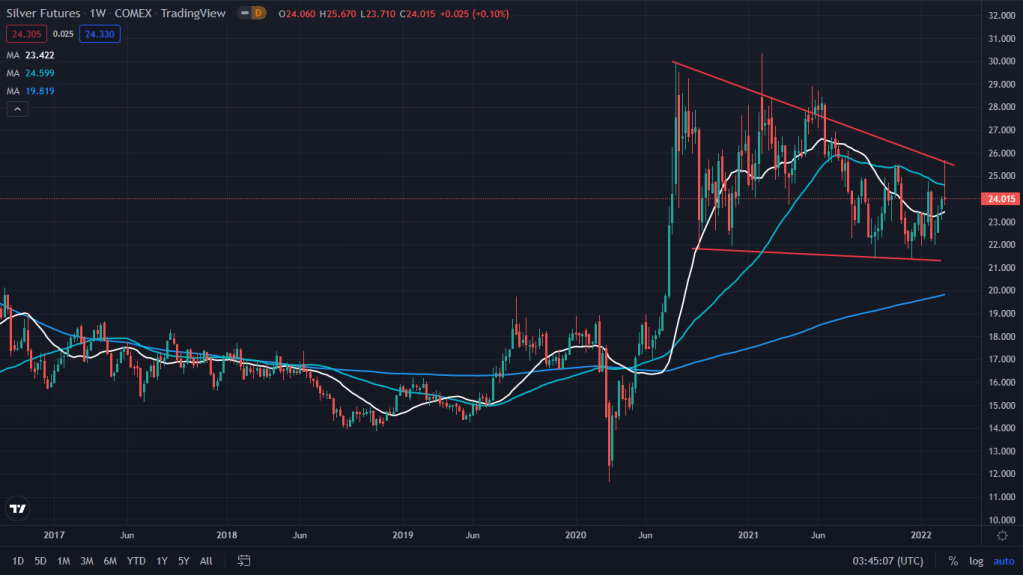
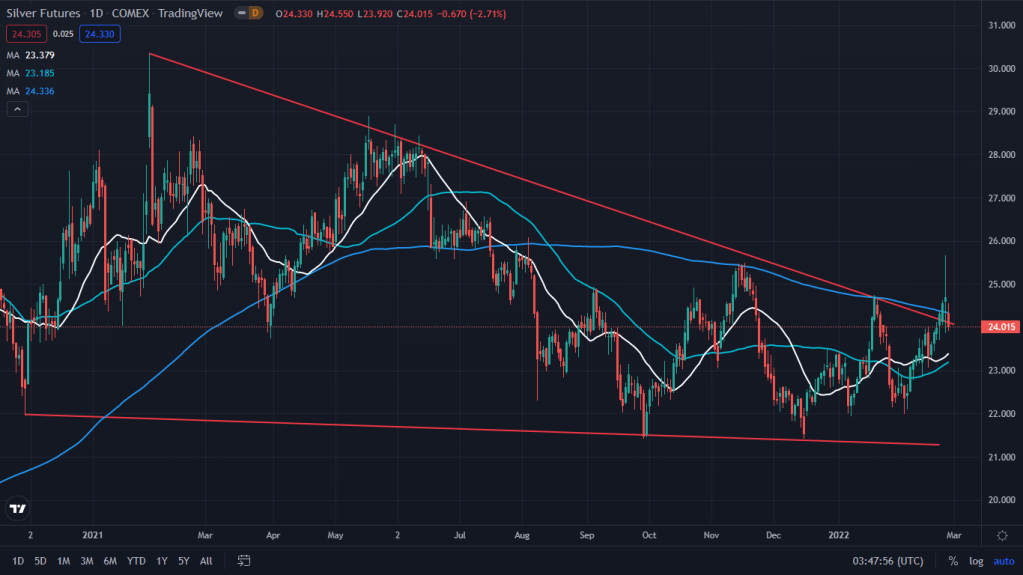
Silver: While the white precious metal usually follows what the yellow one does, but here it’s not exactly a similar pattern but a bit different as in there is a breakout on the weekly and daily off a triangle pattern, the monthly chart isn’t a C&H formation but another triangle there too and the breakout point is at 26 on the monthly chart.
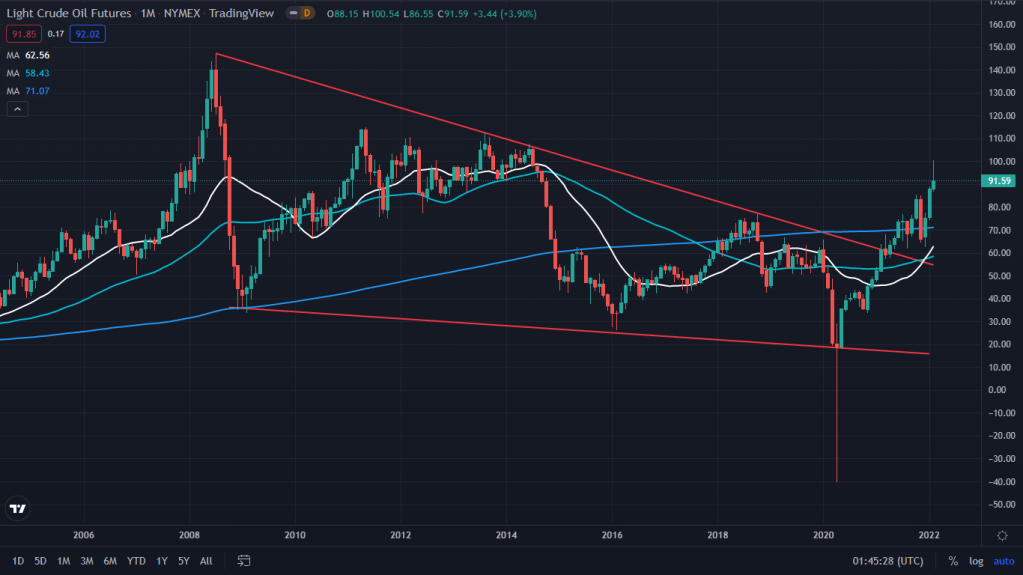
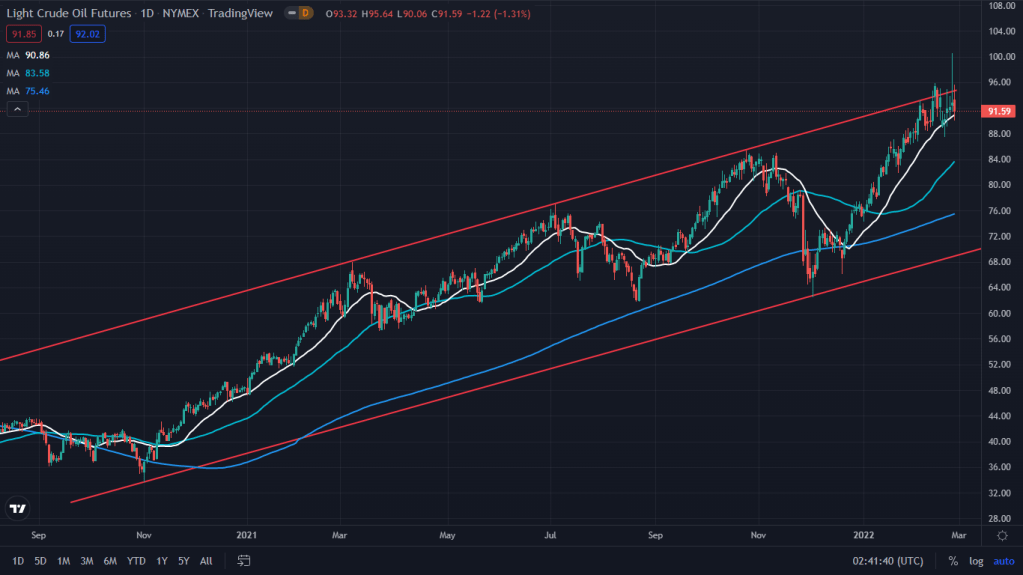
Crude – Monthly: While this has already been spoken about a lot, no matter what the daily price movements say, the monthly still has a long way to go. Every downtick deserves to be bought. Although one can not totally forget about the daily chart that shows parallel channel resistance that has been a struggle inspite of positive headlines all of last week. Expect some give back before the rally resumes.
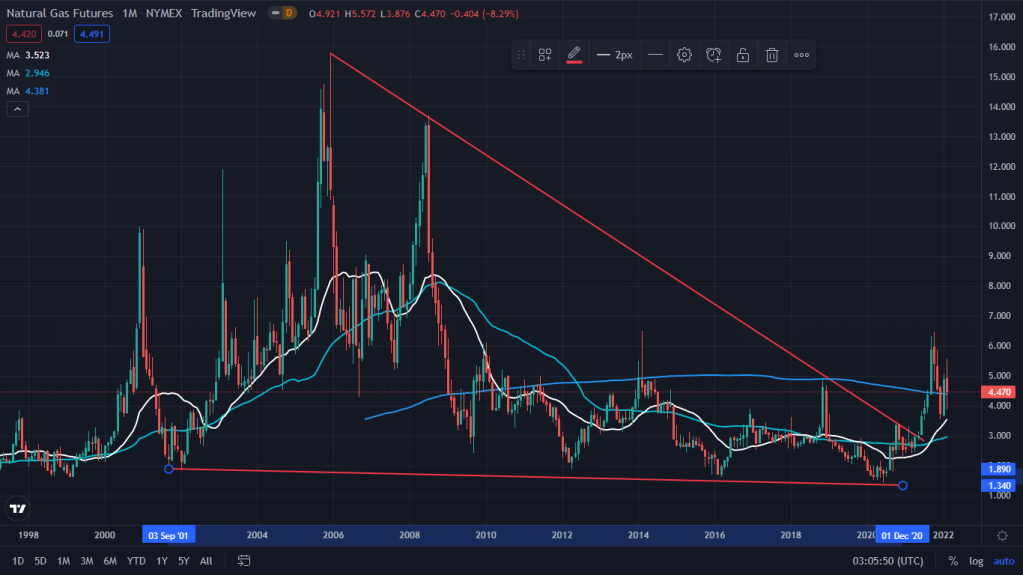
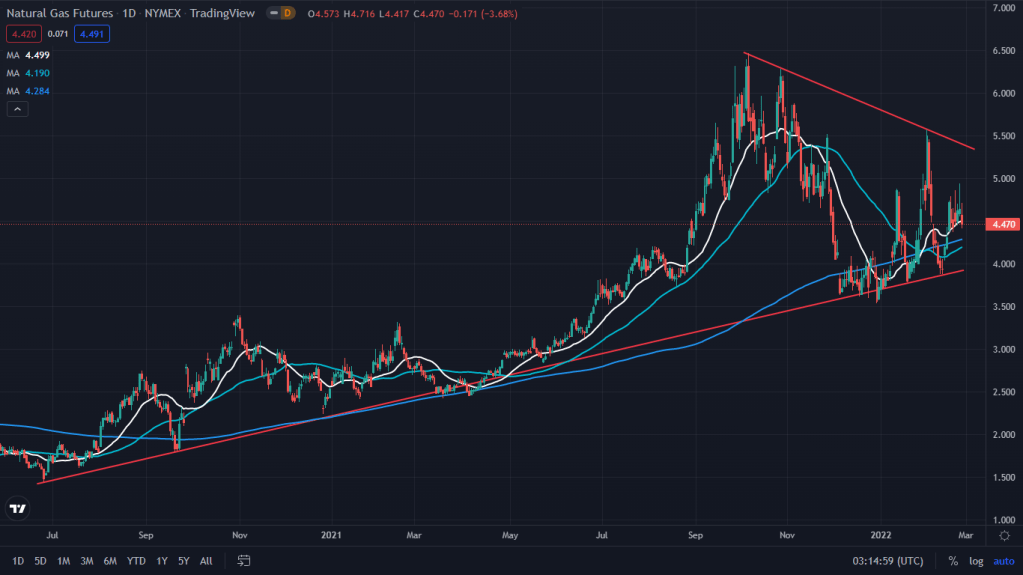
NatGas: The short term volatility in the NG space has been quite something for the last few months. More so ever since the Ukraine crisis began, for obvious reasons. But when we look at the charts from purely technical perspectives, what’s visible is a big breakout off the monthly candles and the backtest seems to be completed. We should be seeing higher prices from heron. While the short term bullishness would be confirmed only once it is able to cross past and sustained beyond 5.40/59 levels.
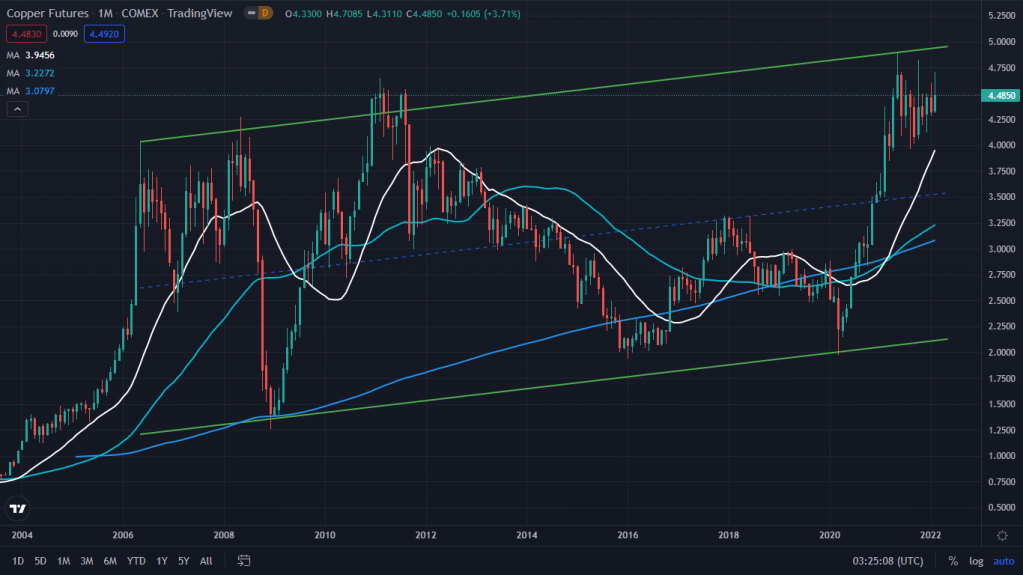
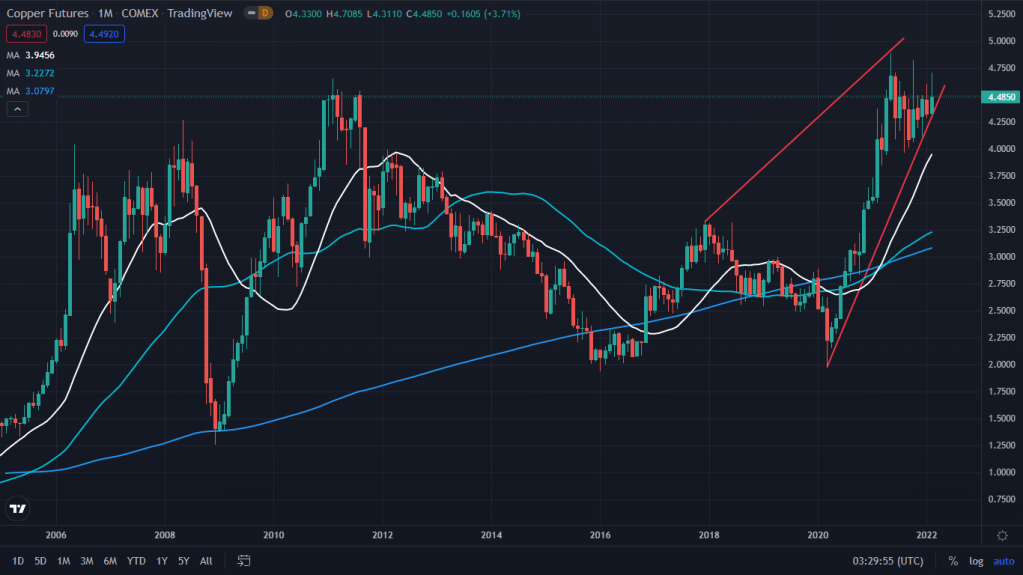
Copper: Beautiful acending triangle beckons on the copper prices on the daily chart. It has been consolidating in this zone of 4.90 and 4 for a very long time now. About time for bulls to take charge here, as the weekly chart shows below that the prices have been finding support off this key trendline. 5.20-50 would be ideal targets here, which is where it would be a struggle to cross past a key parallel channel on the monthly charts. Even as the alternative scenario shows, there is a rising wedge forming on the monthland would ebelow,
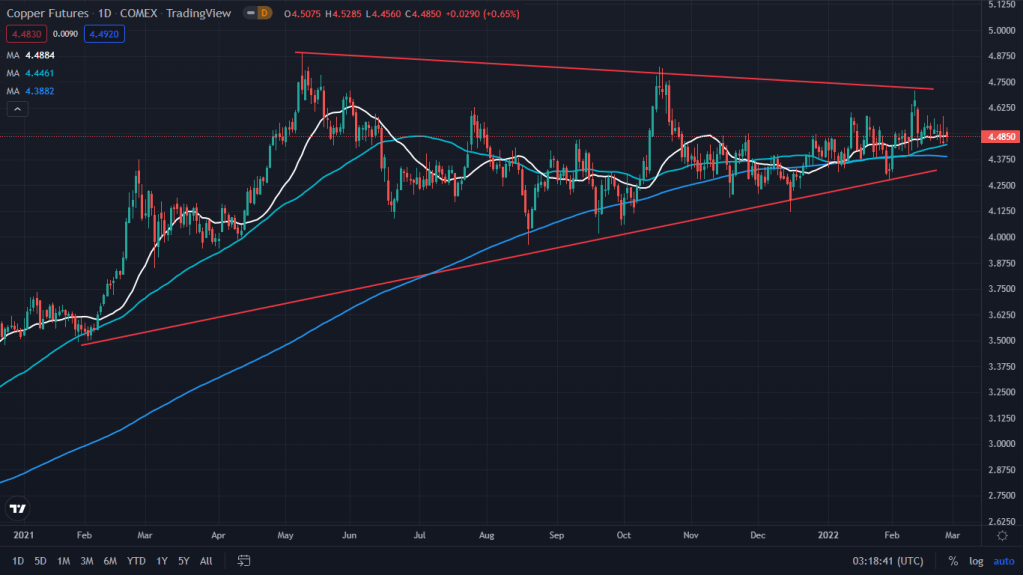
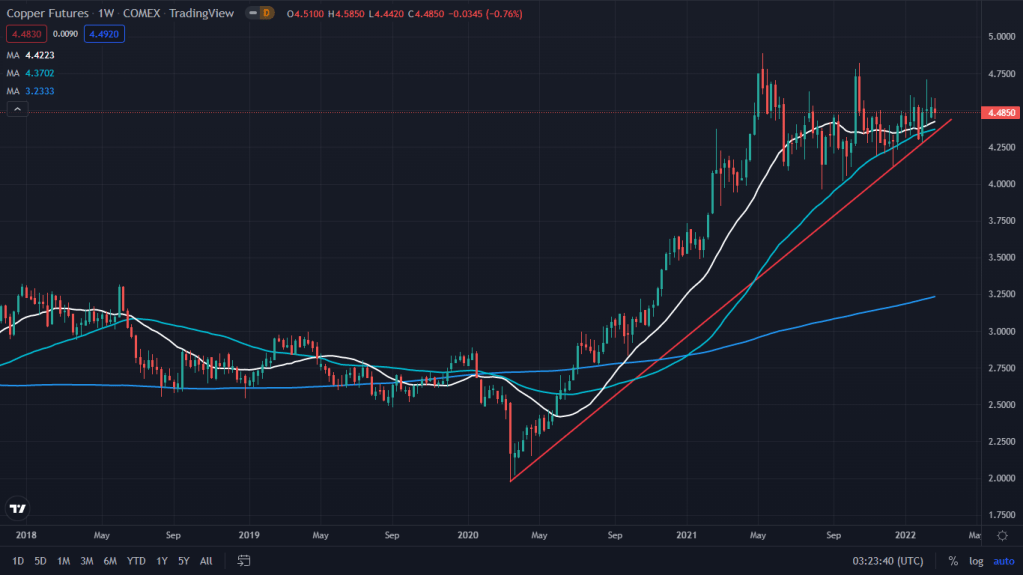
Alternative:
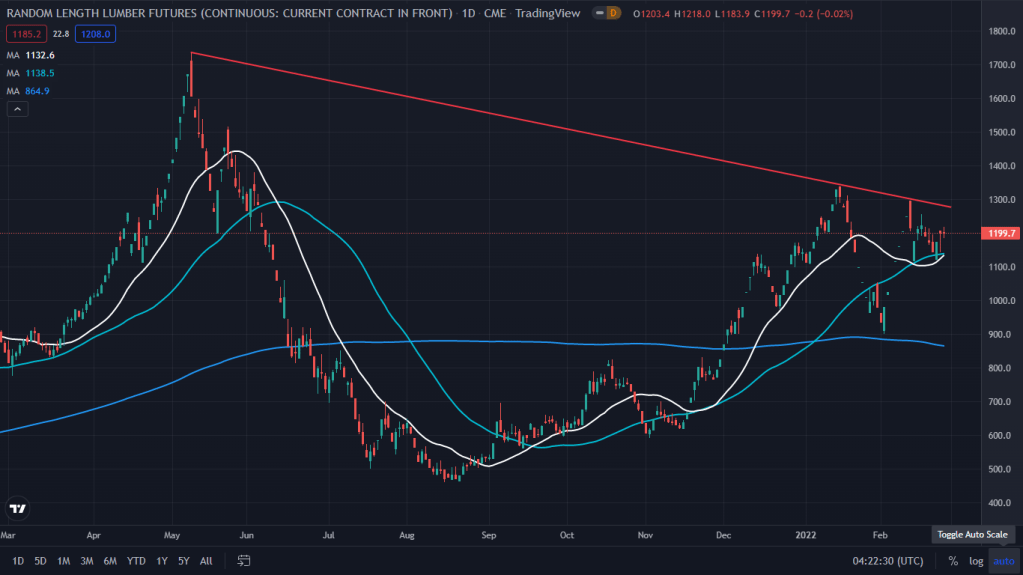
Lumber: While lumber was most talked about last year, nobody remembered it again when it almost hit the year ago price. Probably they would talk again when the prices actually cross past he highs again and beyond as this daily chart shows the breakout of C&H is on the horizon.
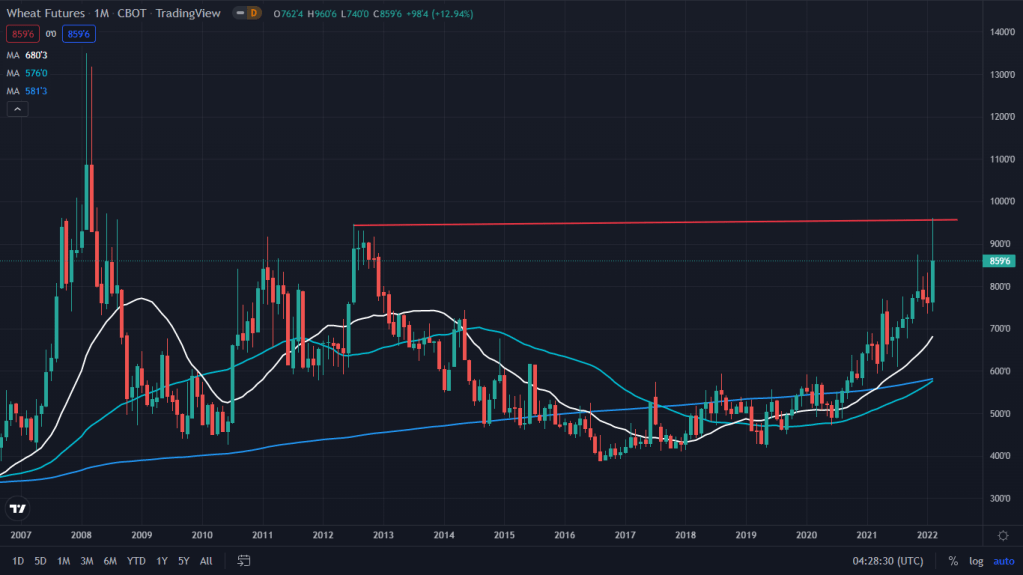
Wheat futures: Yet another commodity affected by the Ukraine crisis and could be staring at yet another potential C&H breakout, although the pattern is yet to complete.

Leave a comment