Currencies, usually not move much like stocks do, but when they do, its a tell-tale. A 1 percent move in a currency in a day is considered to be HUGE and create headlines.
When looked closely, some of the currencies can give us good enough glimpse of what might be forthcoming. As they are one of the key barometers of interest rates, inflation and thus economy.
Just as Japanese Yen, US dollar and Swiss Francs are considered to be safe haven or risk-off currencies, Australian and New Zealand Dollars are considered to be risk-on currencies. As in, these two currencies move in tandem with global risky assets, especially stocks, i.e. these two currencies strengthen with rally in stock prices. In this article, we’ll try and understand what is happening with these two major currencies and if there is something can derived from their movements for stocks?
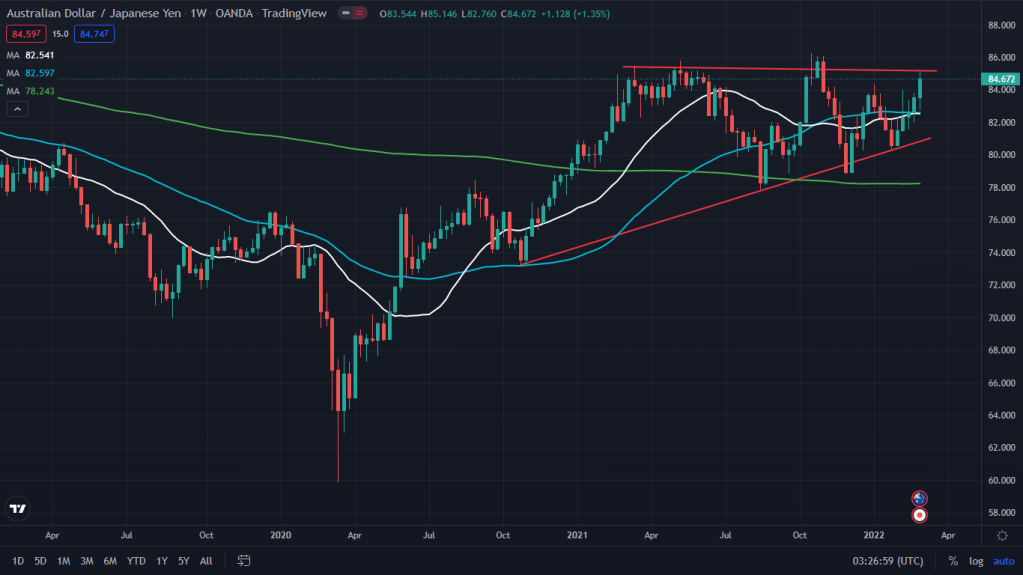
AUD:JPY Aussie Dollar being a risk-on currency and Japanese Yen being a risk off, when paired together, it can give excellent view of whats happening and what may come. The daily chart of the Aussie-Yen is a tell tale indeed. While, stocks have been hammered for last few weeks, this pair, although has moved up (which means AUD strengthening) since November and has been consolidating in an ascending triangle ever since, its on the verge of a breakout of this ascending triangle, which means more strength for the Aussie against the Yen. Does that mean risk on or risk off? Perhaps we need to see the Aussie’s pairing with other currencies to dig deeper.
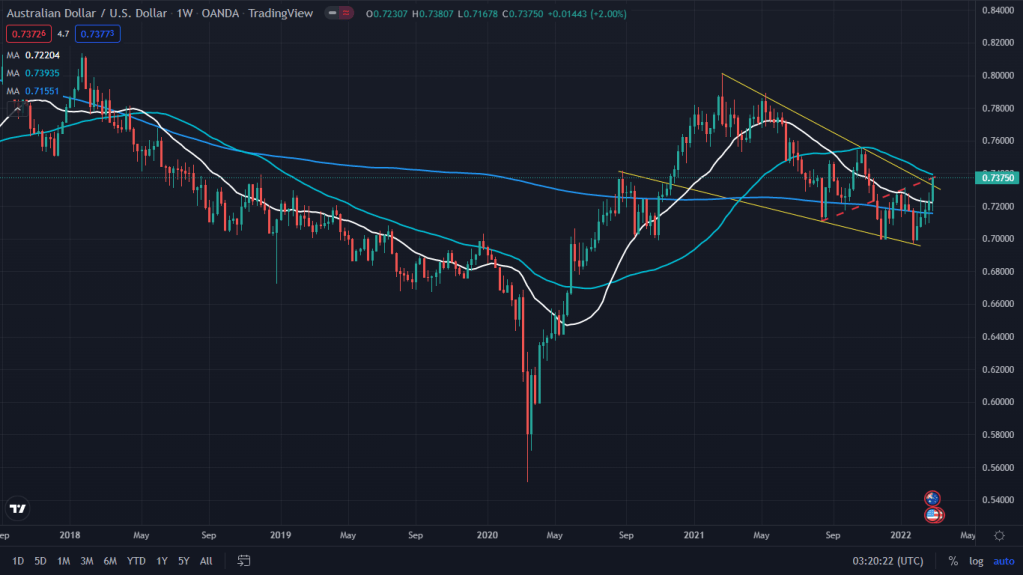
AUD:USD – Falling wedge is a bullish chart set up and which is what is seems to be forming on the AUD:USD pair on the weekly chart and on the verge of a breakout. Especially if you look at the last five weeks, the Aussie has gained more than 5 percent against USD even as the stocks have continued to dwindle in the last 5 weeks. What happens if it breaks out? Can this risk-on sentiment percolate into the equities? May be some more pairing with other currencies would give us more clearer picture.
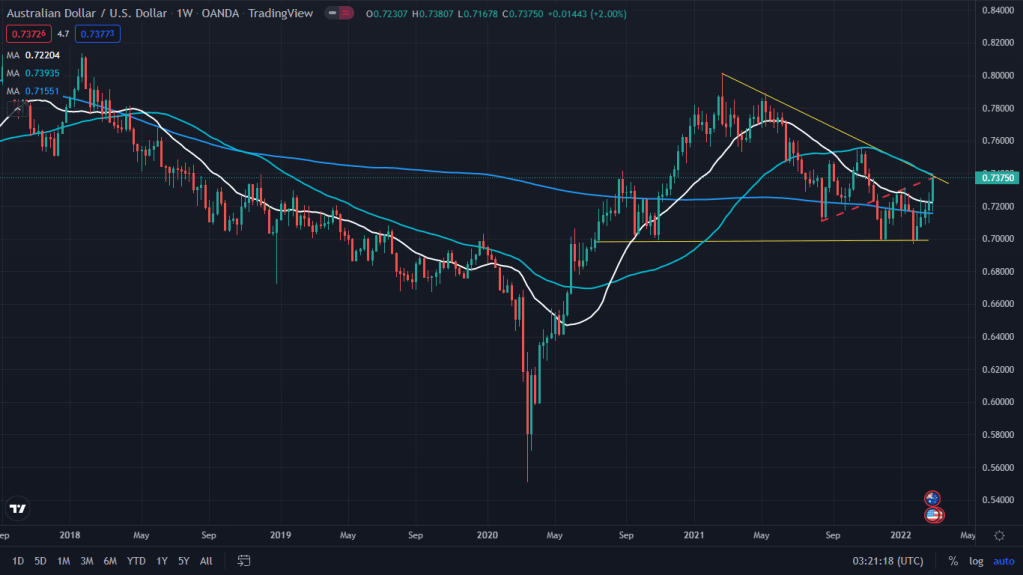
Alternate scenario: Alternatively, there is another scenario which points to a descending triangle shaping up on the weekly time frame for AUD:USD, which is NOT a risk-on scenario and if this pans out to be true, then the bulls might start packing their bags soon and for worse. What makes it more appealing for the bears is the red-dashed trendline resistance.
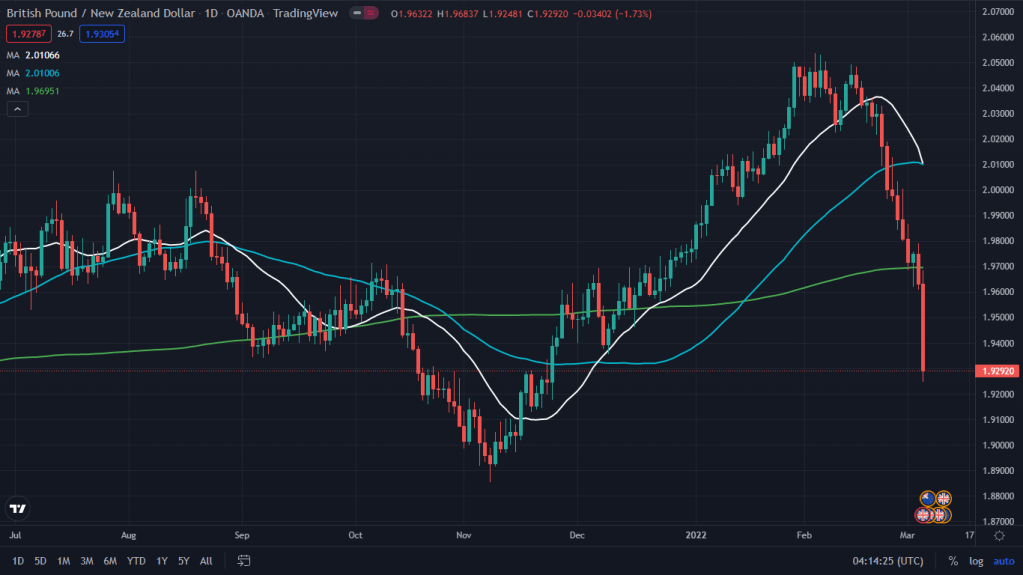
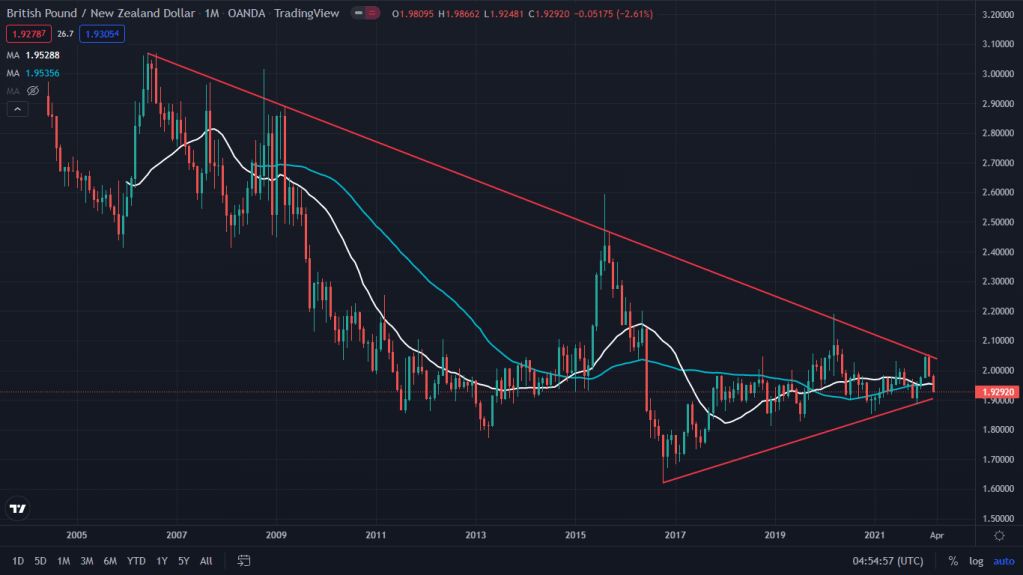
GBP:AUD – What a cataclysmic chart that one is (Along with EUR:AUD down there). It all started with Ukraine-Russia conflict when GBP and Euro both started depreciating against all the other major currencies for obvious reasons that the war is on their turf and naturally affects their economies harder than any other in the world. Lets take a closer look at GBP and EUR pairs against USD on the shorter and longer time frames.
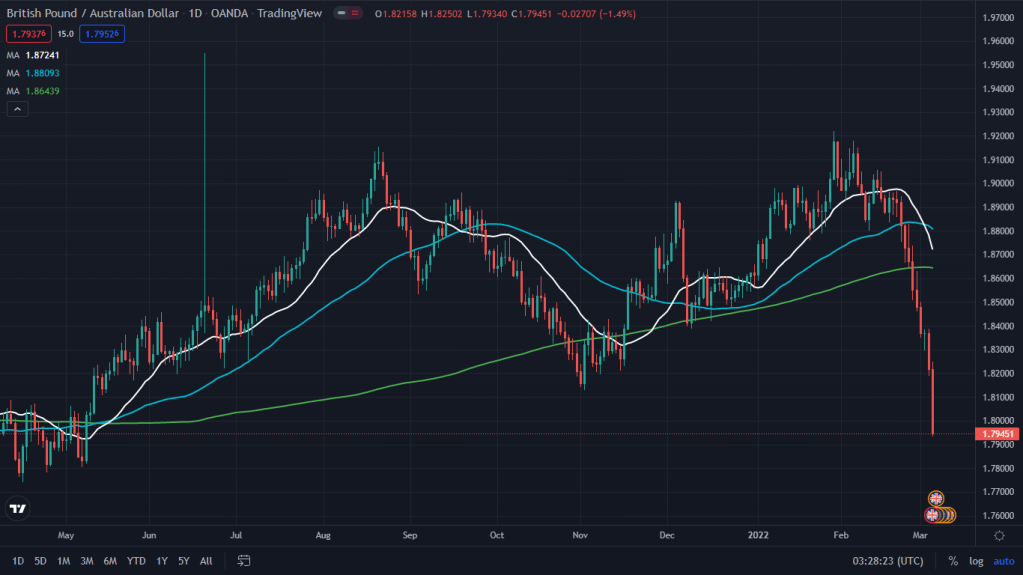
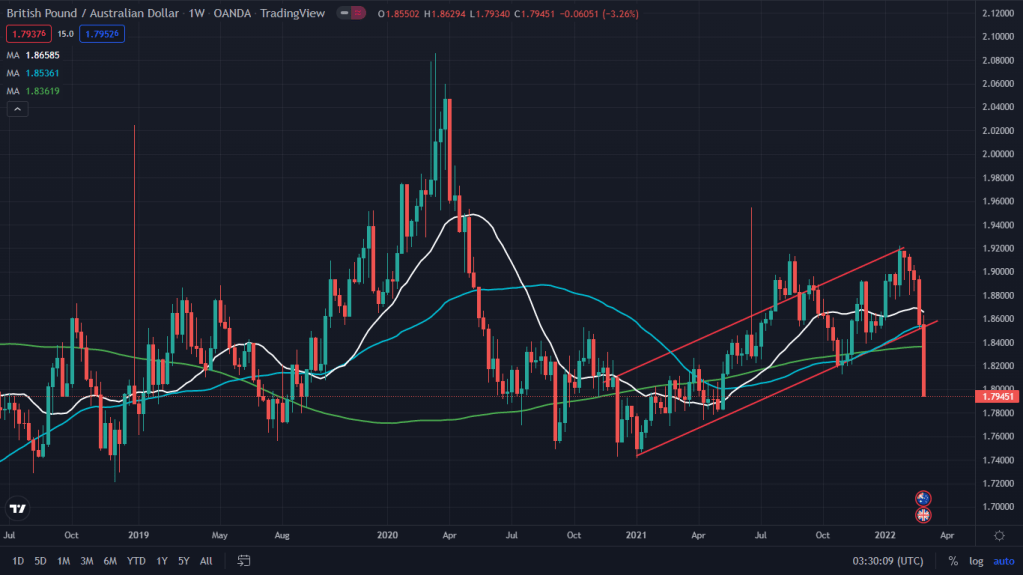
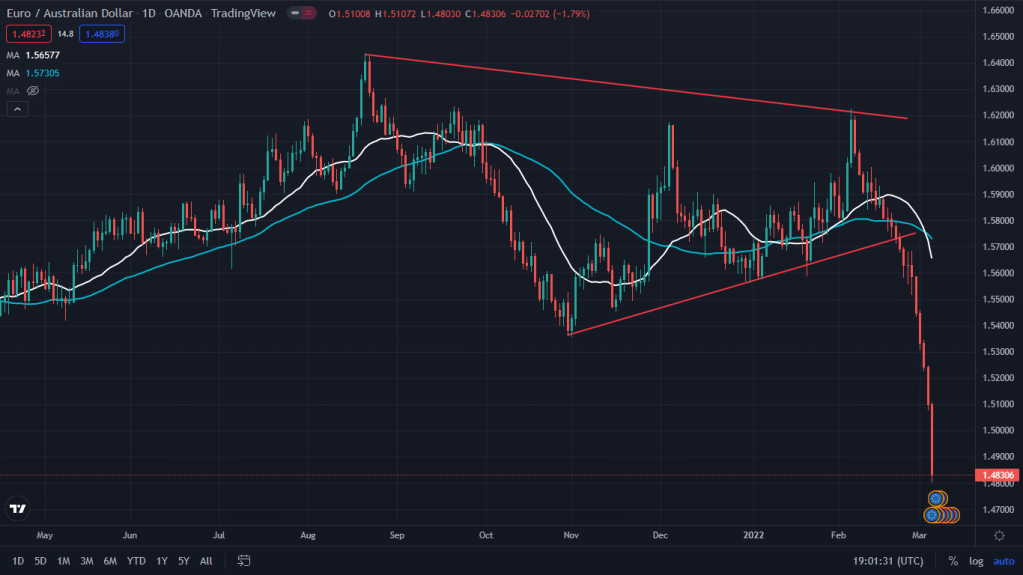
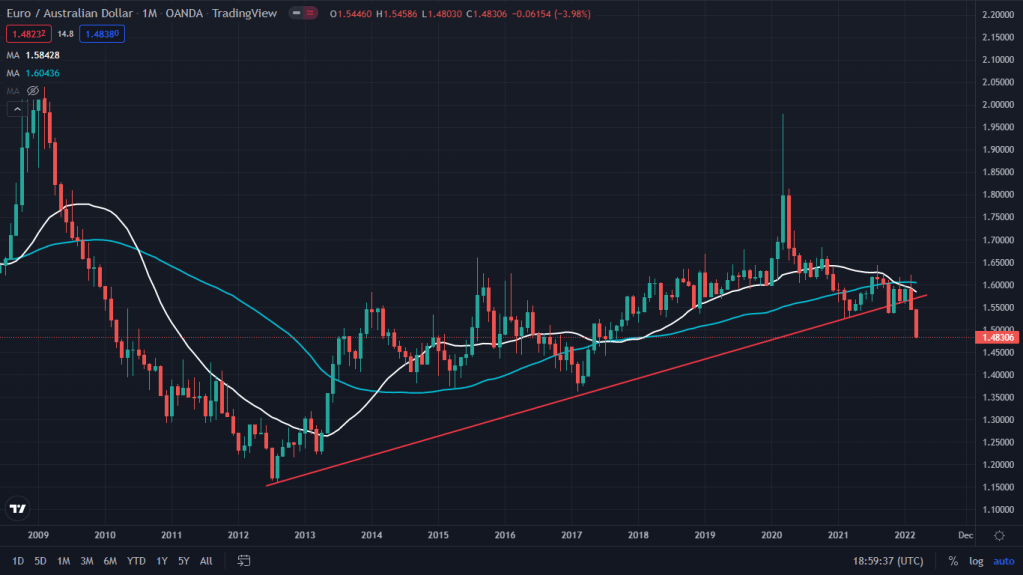
While, AUD’s strength against other majors is definitely interesting, the weakness in GBP and EUR is something that happens once in many many years.
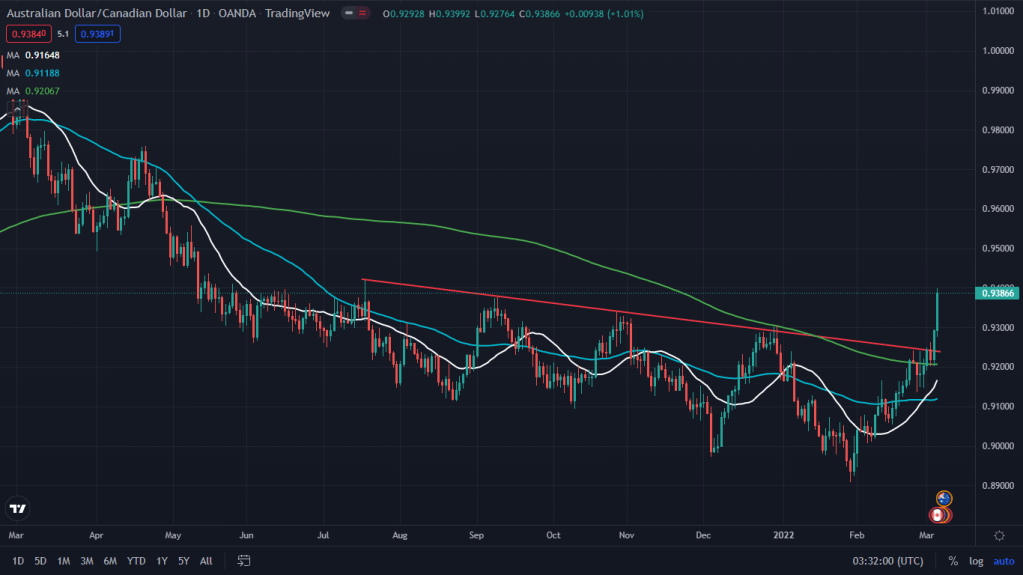
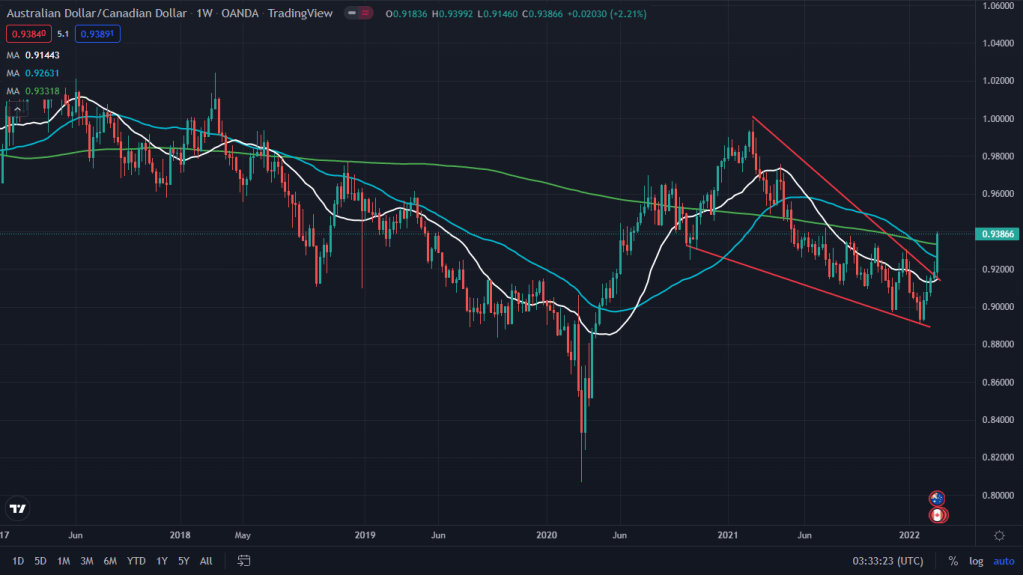
Another interesting pairing is AUD against the looney (CAD). While AUD is a risk on currency, the looney is inversely correlated to the commodities. Commodities have been on a tear for last one year, more so in the last 2 weeks of Ukraine-Russia crisis. While equities have underperformed, which is a risk-off scenario, it hasn’t quite resulted in AUD weakening against the CAD, rather CAD has weakened more against the AUD for more than a month now.
AUD:CAD
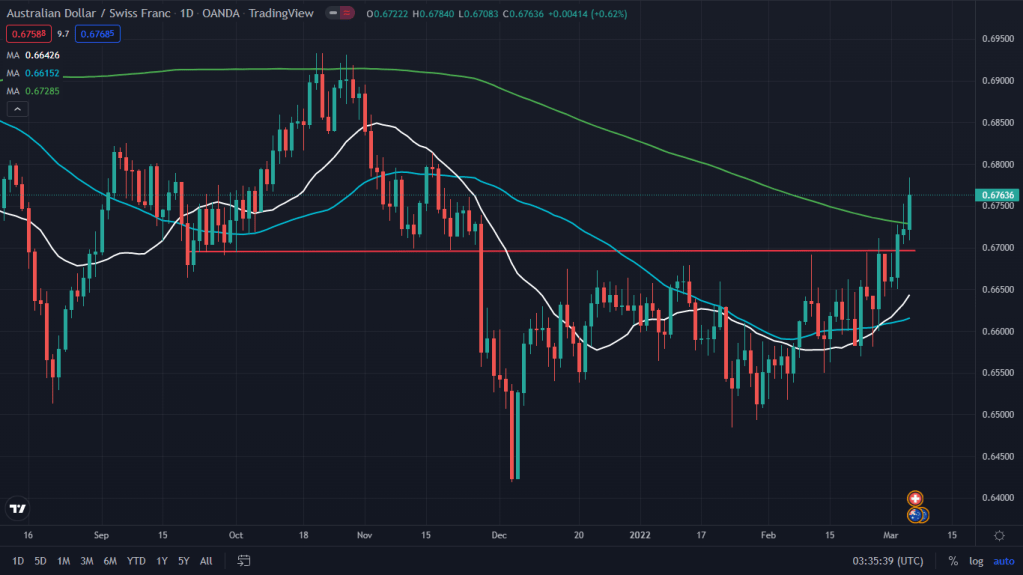
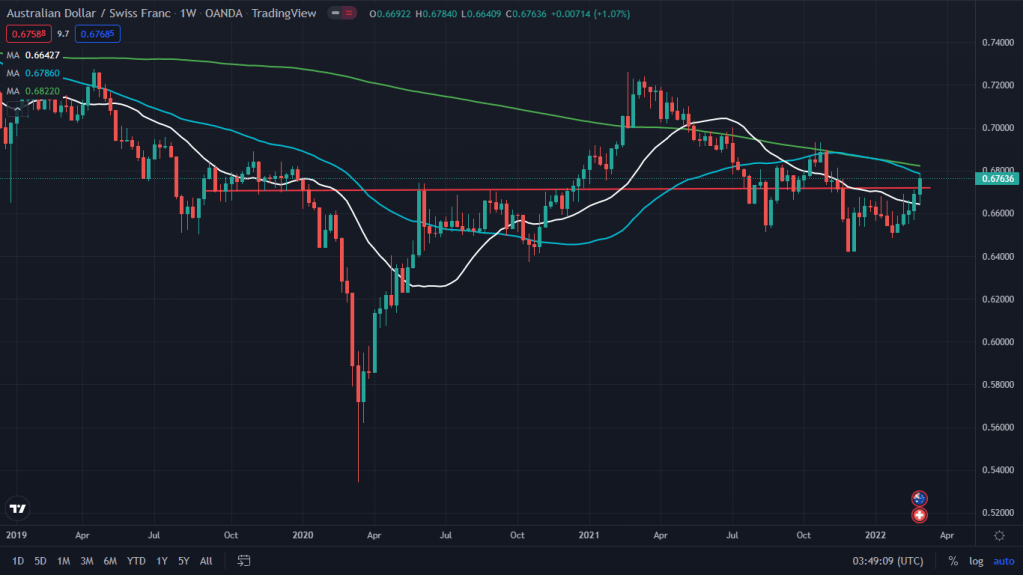
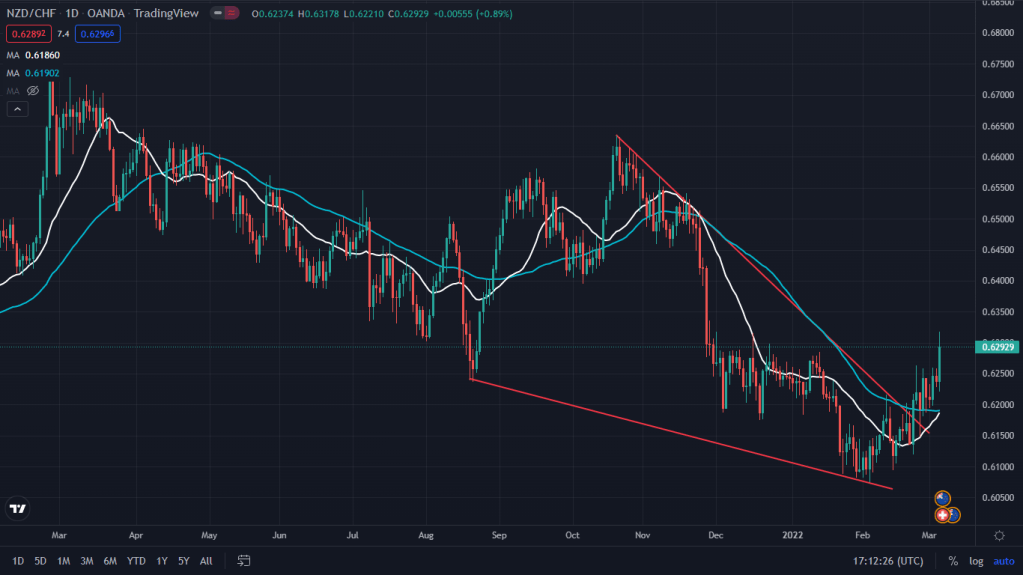
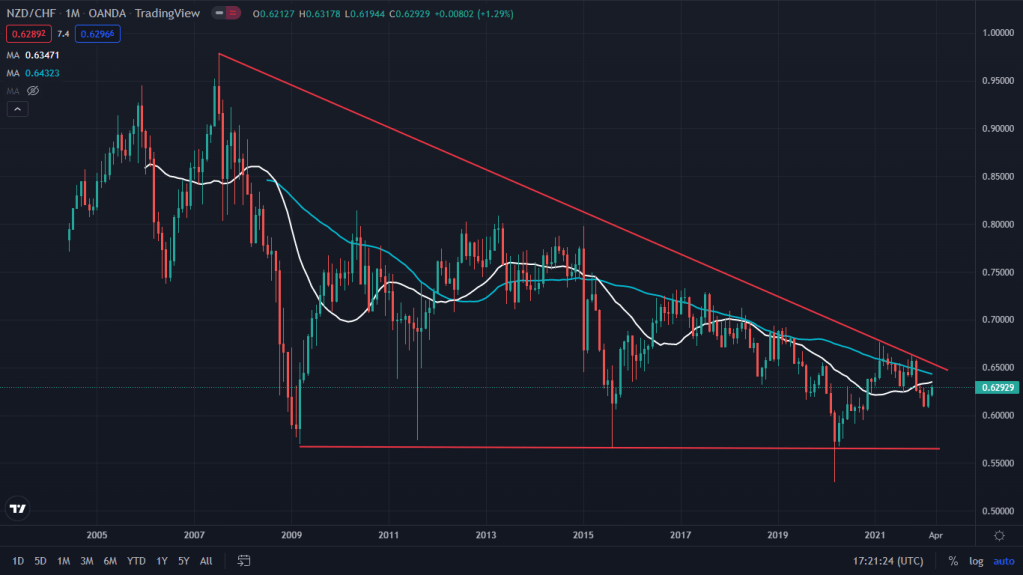
AUD:CHF Yet another risk-on, risk-off pairing which should be gone the other way, hasn’t quite done so. In fact it has only gone favoring the stocks bulls.
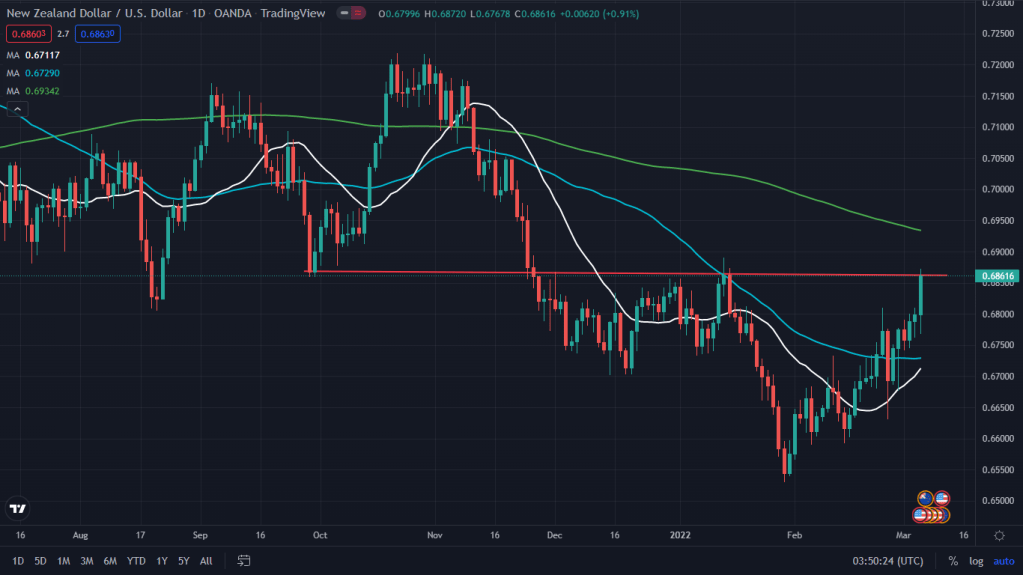
The story isn’t quite different on the Kiwi too. The NZD too has almost been replicating the same story as the Aussie. The charts below are all self explanatory.
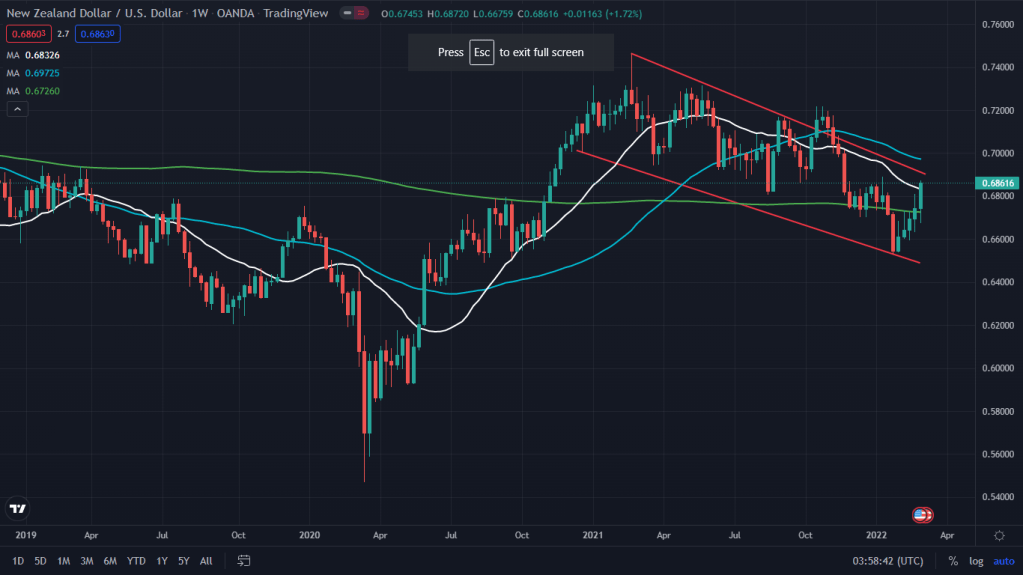
NZD:USD
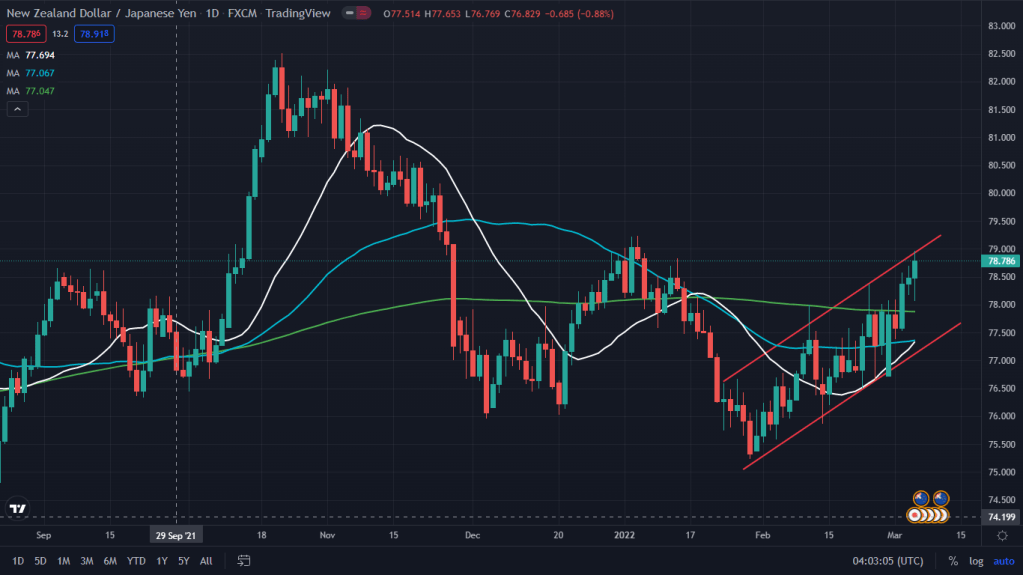
NZD:JPY
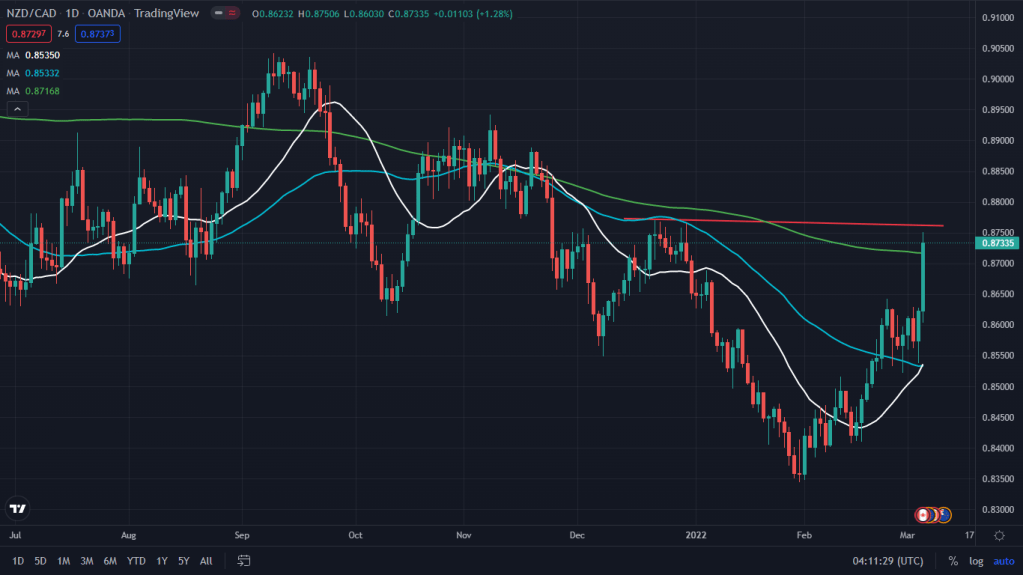
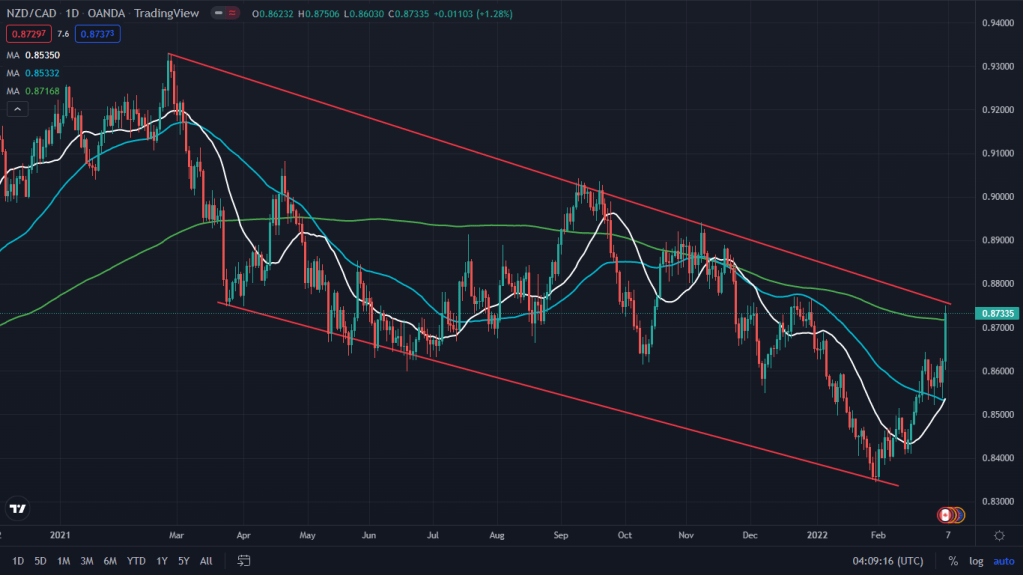
NZD:CAD
GBP:NZD
NZD:CHF
CAD: As stated earlier, the Looney is inversely correlated with the commodities, as shown in the chart below. But is there more coming for the commodities? As mentioned in my last week’s post for the commodities, they’re not done yet. Following charts speak for themselves.
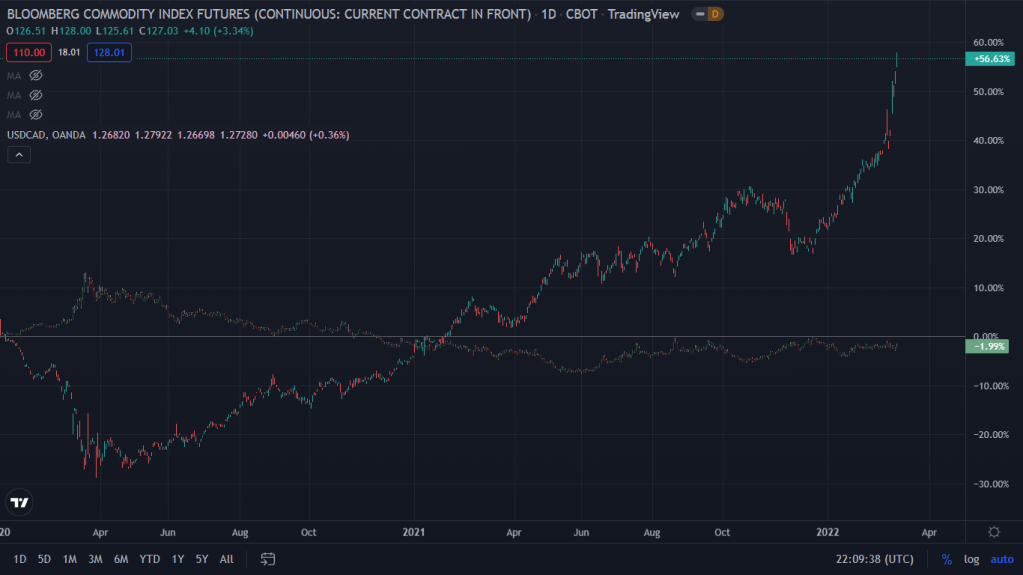
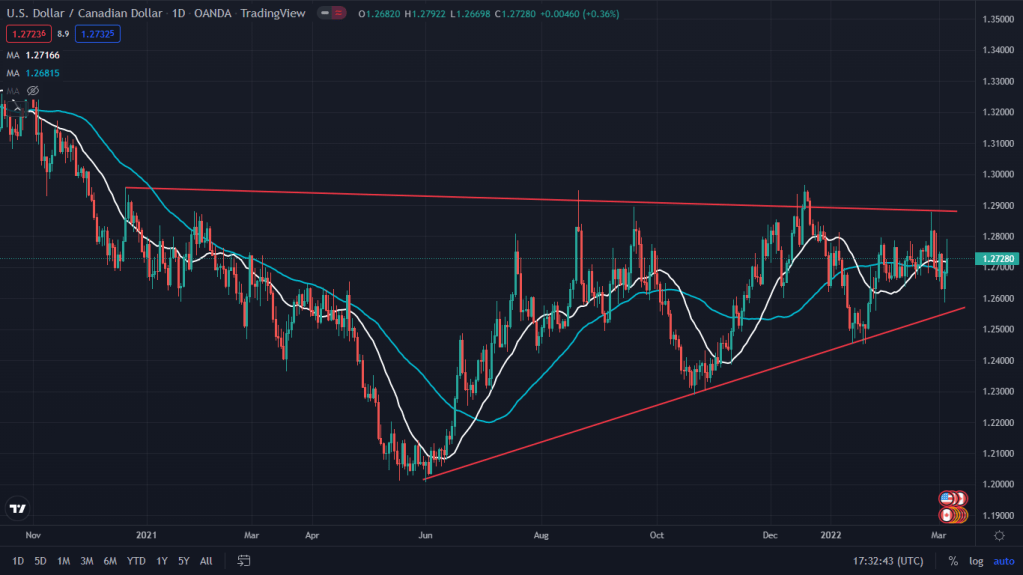
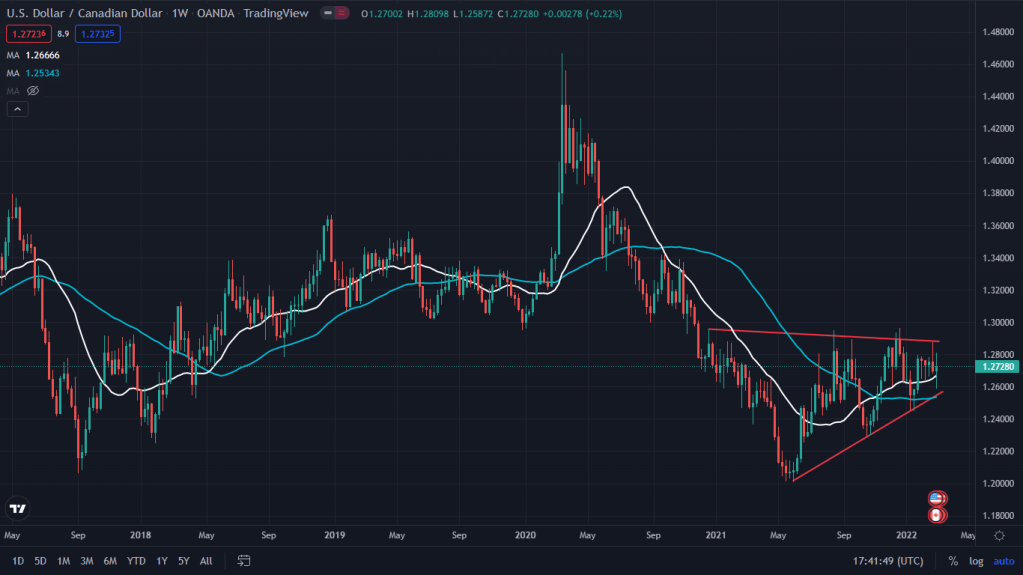
USD:CAD
While, the headlines around us may be speaking against the bulls, the risk-on currencies aren’t talking the same language yet. And if this were to translated into stocks, we might be heading into strength in equities, unlike what the headlines would be talking about.

Leave a comment