ES futures: The daily chart of the ES futures, has long been drifting lower and may have probably made the top in this cycle. But the focus here is not predicting the top or bottom, but trying to assimilate what may happen and basing our strategy accordingly. Looking at the daily chart below, one thing is clear that not only has it been unable to cross past 20 SMA, it has also struggled to sustain past this channel that has been drifting lower from the ATHs.
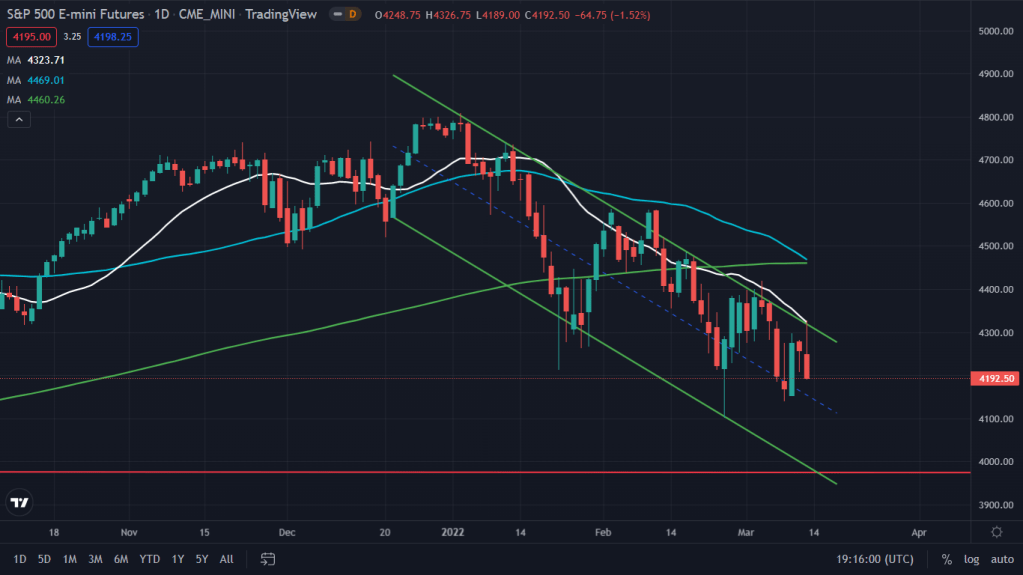
While the trend remains down decisively and any rallies are getting sold into, based on this weekly demand zone around 4,000 on the ES, I would expect prices to show sharper bounce.
Speaking of weekly demand zone, here’s what the weekly chart is showing:
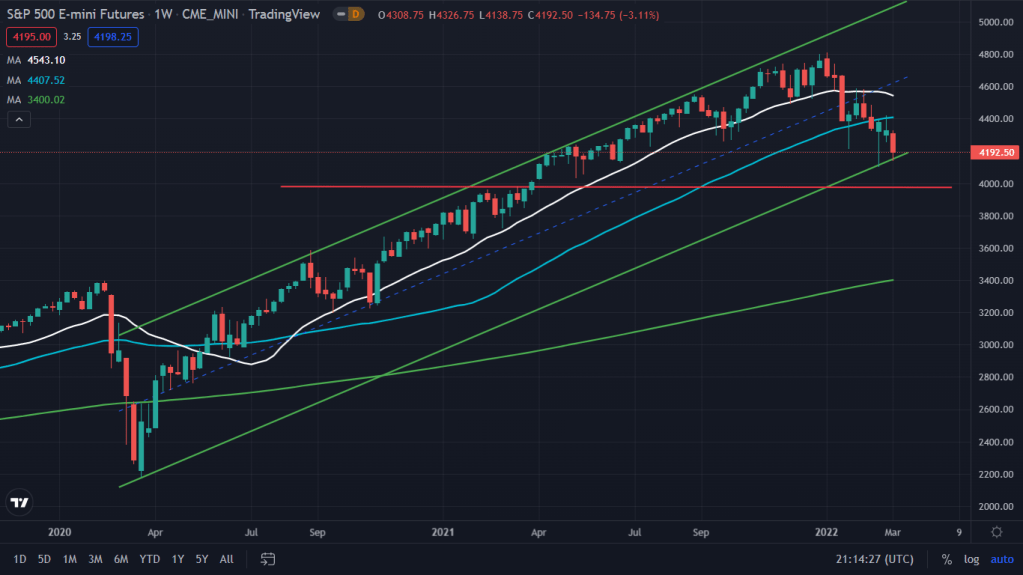
And the weekly suggests, its a make or a break level for the bulls at current prices of 4100. Bounced off the critical weekly channel support but the close on Friday wasn’t bright, suggesting there could be some pain before any bounce. Overnight futures would open in a few hours and might suggest what lies ahead. But if it does break last week’s low of 4138 then all we can hope for is weekly demand zone of 4000 (also psychologically important mark) to come to the rescue. Interestingly, 20 SMA on the monthly too is just below 4100 at 4091. All in all, there indeed is some hope for a sharp bounce even if we do break below last week’s lows.
NQ futures: The tech benchmark, Nasdaq 100 e-mini futures’ daily chart looks scary to say the least and one wonders if it would ever be able to recapture the ATHs anytime soon.
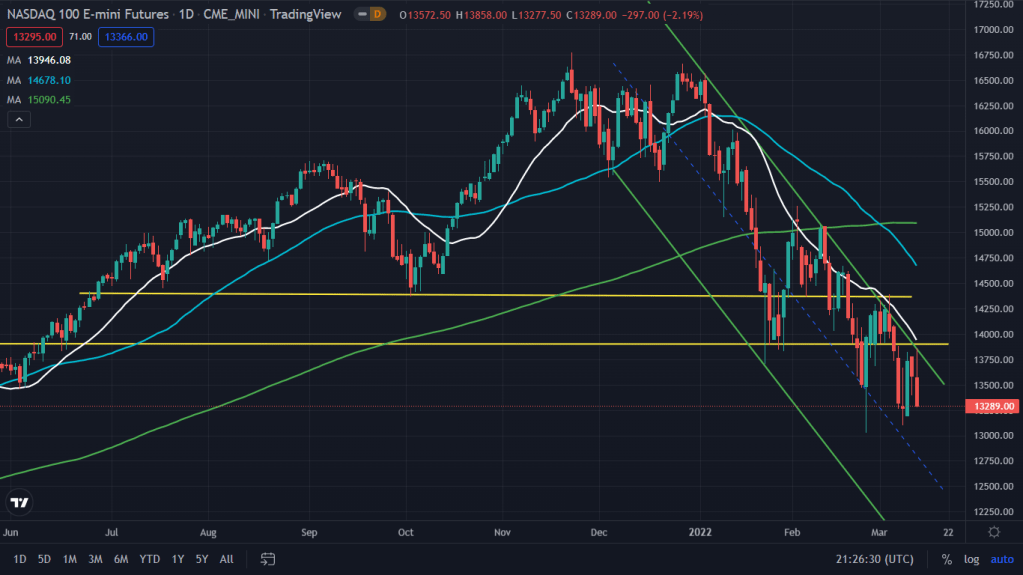
But when we zoom out a little towards weekly charts, we get some hopes.
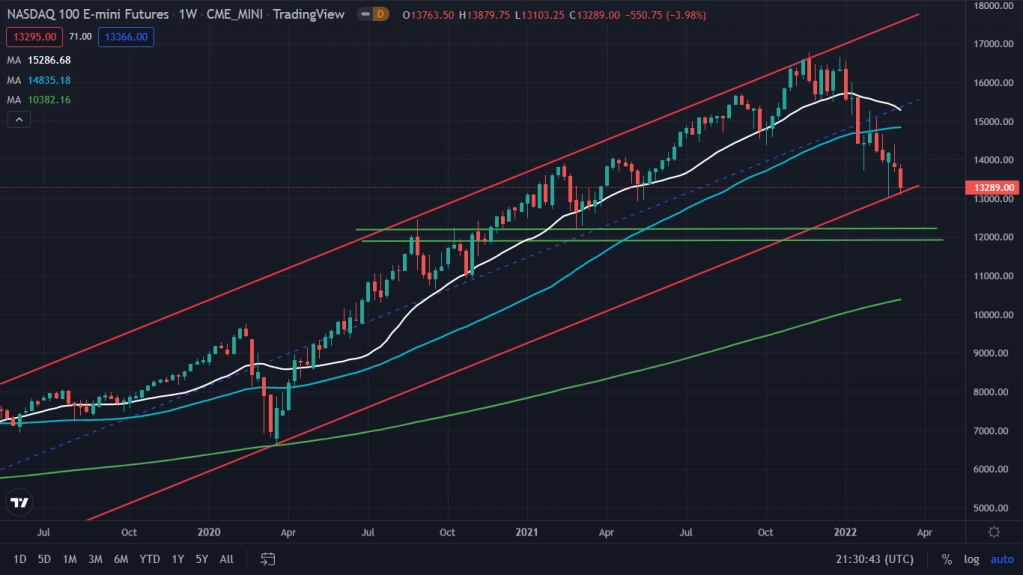
The weekly chart does provide some hope, similar to ES futures – sitting on the cusp of a weekly channel support and also, lies just underneath another weekly demand zone of 11900-12200 where one should expect buyers to emerge. Although, unlike ES, NQ has already given up 20-month SMA and that’s not a good sign.
YM futures: Flip a coin and what you get is what might happen with the industrial index, Dow Jones Industrial Average. While it has given up some key supports, what looks promising is a daily falling wedge forming.
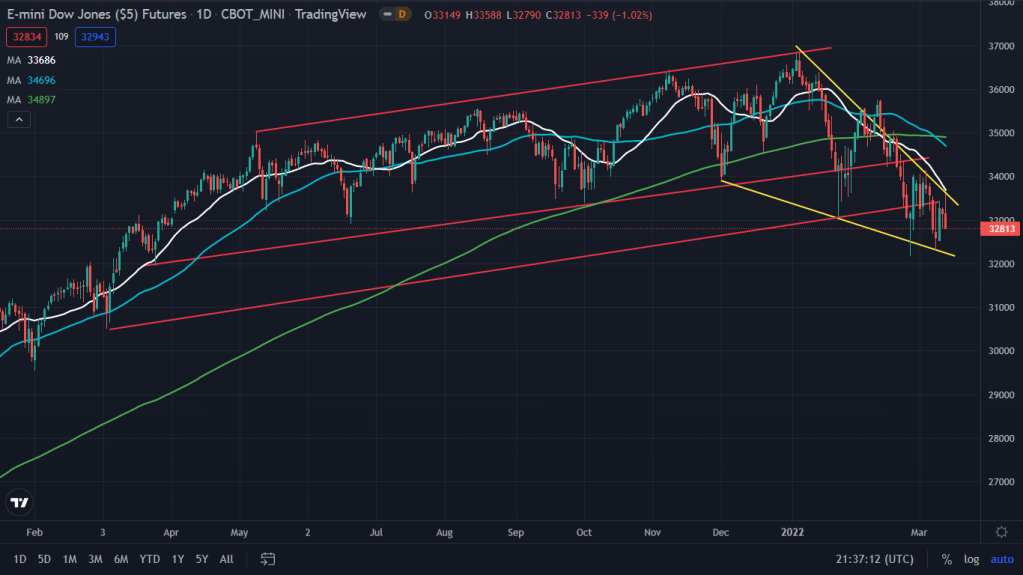
But any further fall here would only mean the bears taking full advantage of what’s happening on the larger time frames.
If YM breaks below and sustains a week under the last week’s lows, then any hopes of bounces from the daily wedge would only get sold into even harder.
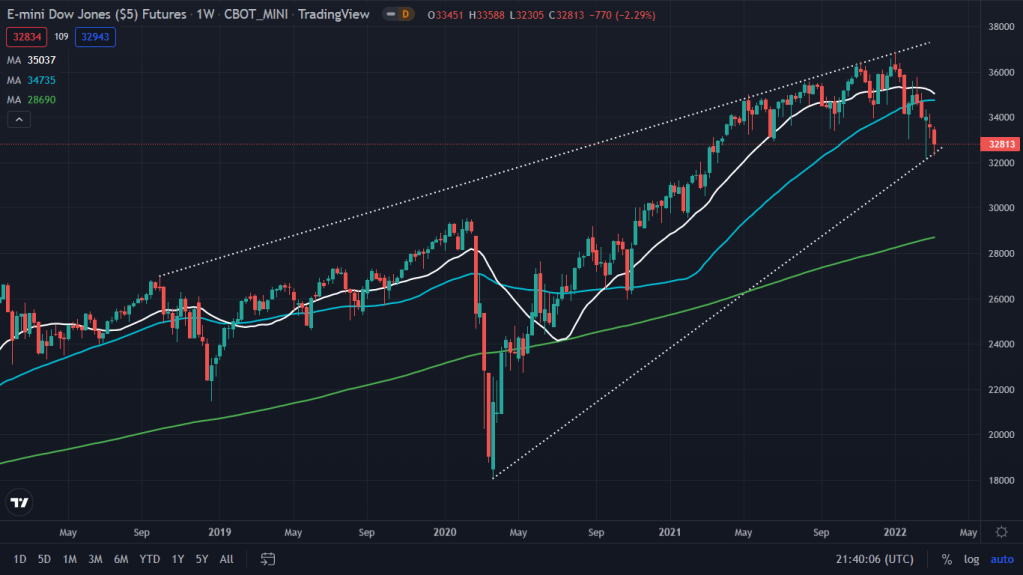
Conclusion: The weekly charts of all the three major indexes are showing signs of breaking down and hopes of sharper bounces. Key levels to watch are there for everyone to be seen and once broken, we should leave any emotion behind for the bull run coming back for the rest of the year.

Leave a comment