This article is mostly for educational purpose and most of the contents although available freely on the internet, yet writing here for the purpose of making it easy to understand by the retail followers who have never seen or have been properly educated about these correlations. Also, it is a follow up article on the earlier currencies’ article (read here).
We will answer these questions from risk-on, risk-off point of view so that the correlation is easily understood.
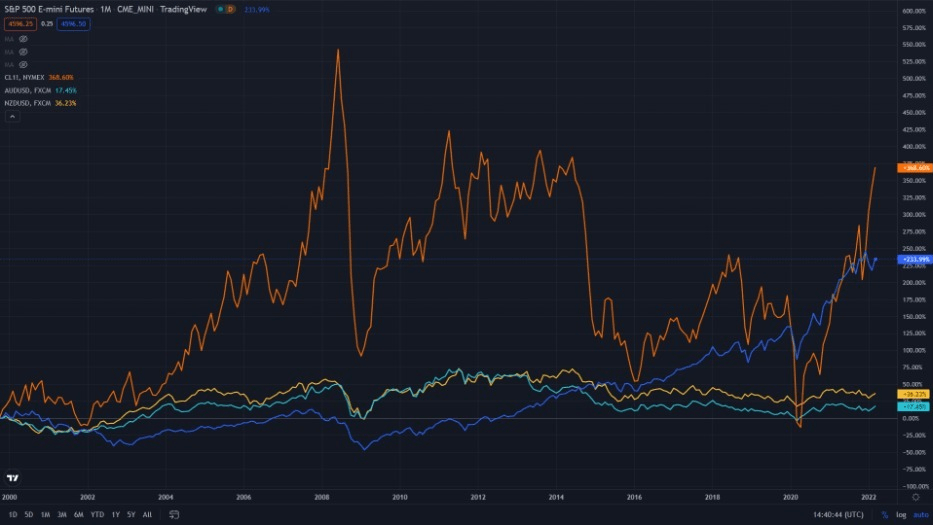
Risk on assets (Stocks, crude oil, AUD and NZD): What is Risk-on? It only means that the general sentiment is upbeat on a particular asset class and investors are willing to ride the rally to the upside with their money on the table. Historically, in normal times, when the mood is upbeat, with stocks rallying, crude oil tends to follow along with a rally in Australian and New Zealand Dollars. For the crude, it is so because of the fact that rally in stock prices is linked to the growth in the economy which in turn is bullish for the demand and consumption of the oil. The reason it is also bullish for the Aussie dollar is simply because Australia has long been a commodities exporter economy and the economy there benefits from the upbeat economic outlook, while the Kiwi dollar just tags itself along.
Appended below is a chart for the last 21 years that explains it better. Since the year 2000, it is quite visible that the prices of crude oil and AUD, NZD have followed those of ES (S&P 500 futures) in the same direction. While the magnitude of the move may not be the same for reasons of economics and supply-demand dynamics, the direction has remained the same nonetheless.
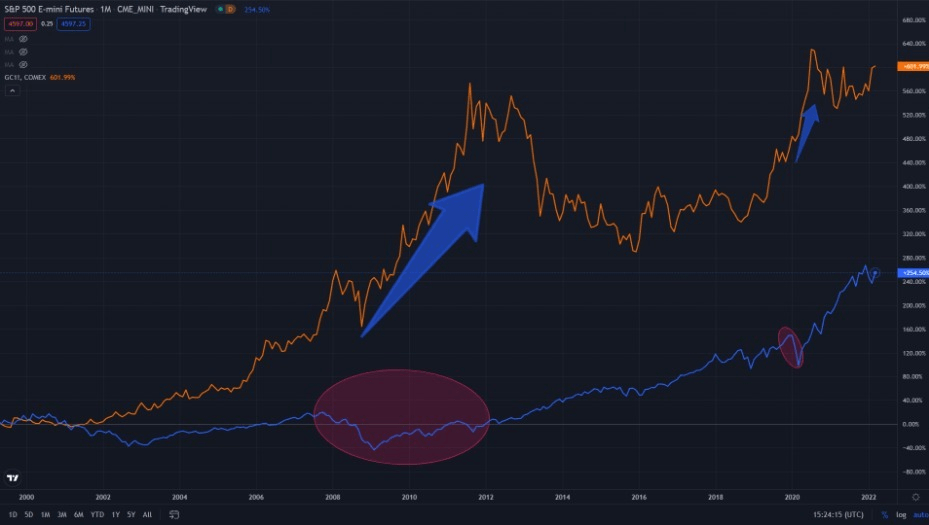
Risk-off (ES vs Yen and gold): Risk-off is exactly opposite of Risk-on, wherein investors would be vary of keeping their money on the table in the asset classes which are considered to be risky from investment point of view and would rather take profits off their investments in stocks and/or crude oil and would rather park it in places which are traditionally considered as safe haven or risk-off asset classes. Japanese Yen and the shining metal Gold have proven the test of time to be considered as safe haven asset classes.
In the chart below, gold prices sharply rallied in during the GFC crisis as the sentiment was quite bearish and uncertain, making investors to park their money in gold. And even after the 2020 breakdown in stocks, gold continued to remain upbeat. In fact, recent drawdown in stocks have also coincided with rally in gold prices, which actually is not a coincident.
As mentioned above, the magnitude of moves in currencies may not match those of stocks, gold and crude oil due to various other macro economic dynamics. But when observed closely in the times of risk on and risk-off, the signs are quite clear and it pays to follow those signs while taking a view on a particular asset class, especially stocks.
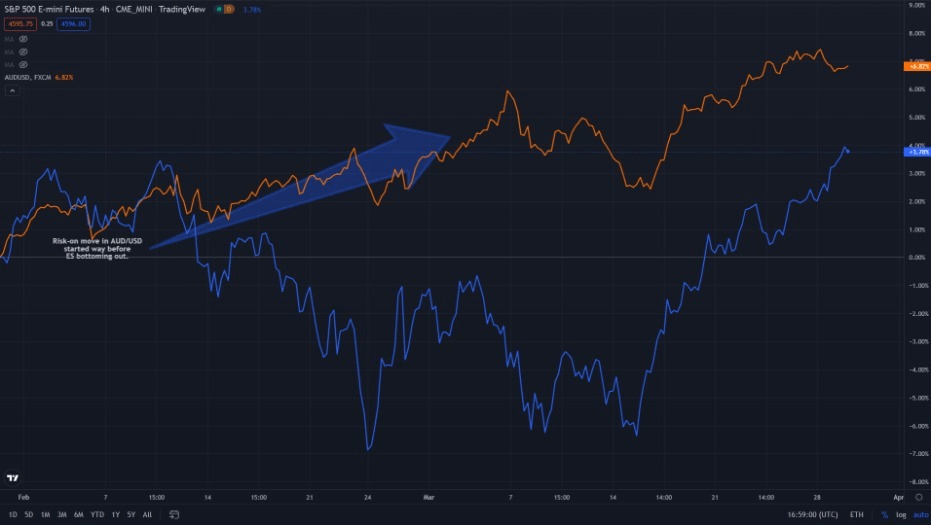
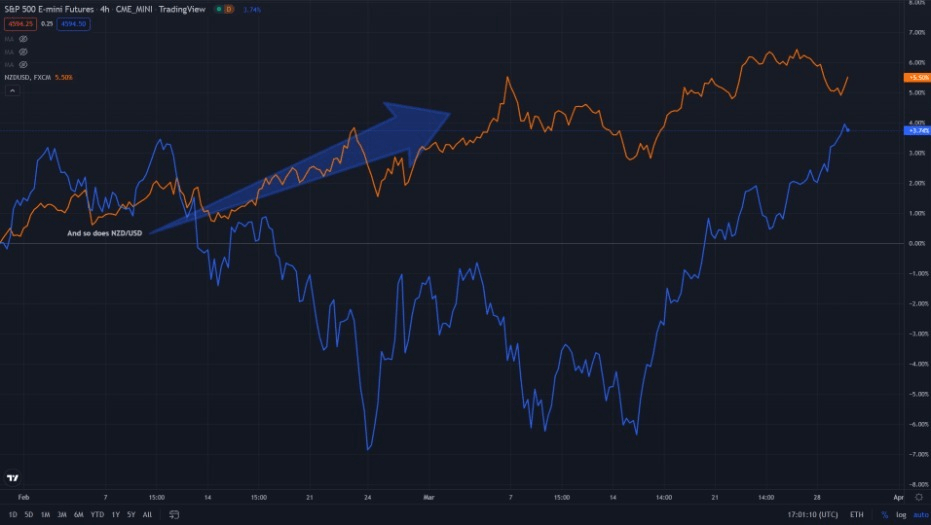
Here’s a closer look at recent moves in currencies and then a great follow through by stocks. For the sake of keeping it simple, I’m only taking AUD and NZD pairs against USD. But the risk-on move was equally sharper against EUR, GBP, CHF and JPY too.
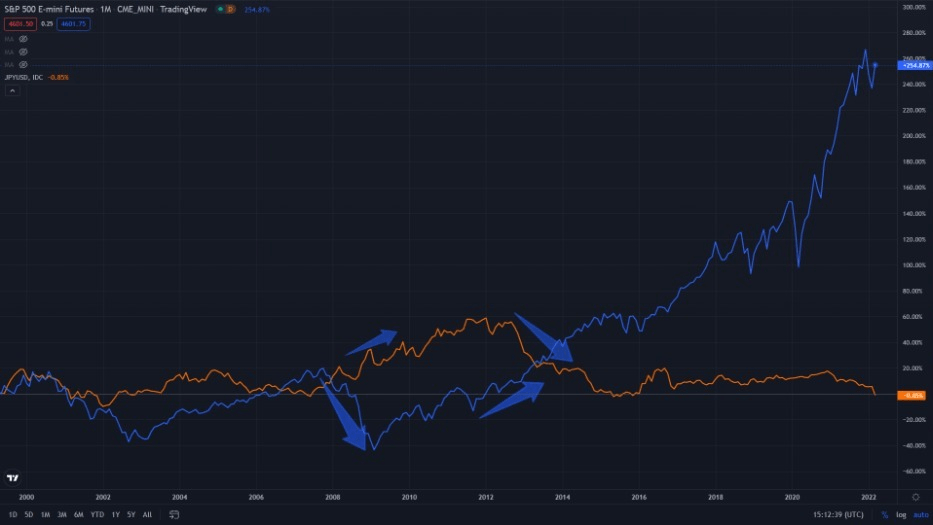
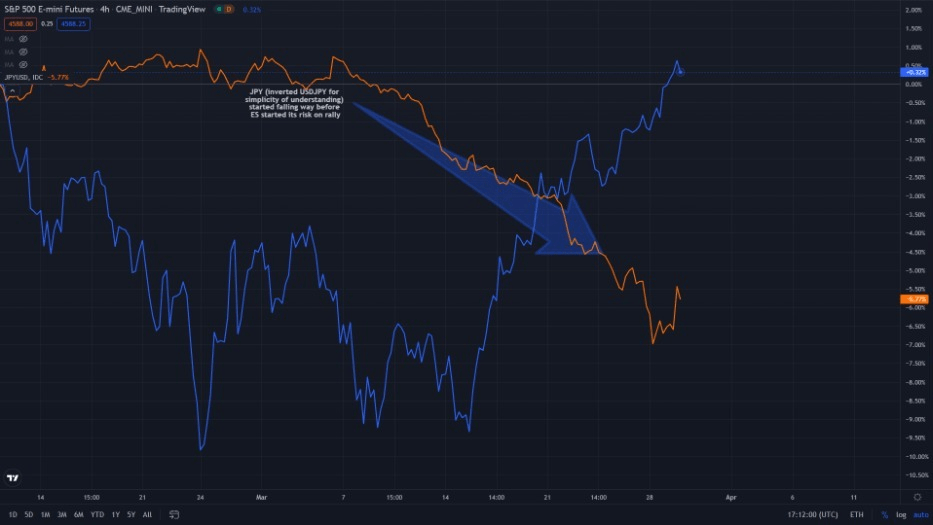
Also, since JPY is a risk-off currency, it is also a point worth noting that a sell-off in JPY would mean risk on. Here’s what happened with USDJPY (inverted) before this risk rally in stocks kicked off. And yes, yet again the moves in JPY were equally sharper against all the other major currency pairs such as EUR, GBP, CHF and AUD, NZD. The risk off rally in stocks was already coming to an end.
ES v/s US 10-year bonds: A lot has been spoken lately about the rise in bond yields and the inversion of yield curve (will not talk much about yield curve here to keep it simple for understanding for the retail traders). Why should we follow bond yields closely and what do they tell us? It is said that bond markets are smarter than the stocks in terms of pricing in macro economic outlook for the future. For the simple reason that bond markets are interest bearing instruments and are directly correlated to Fed’s rate moves.
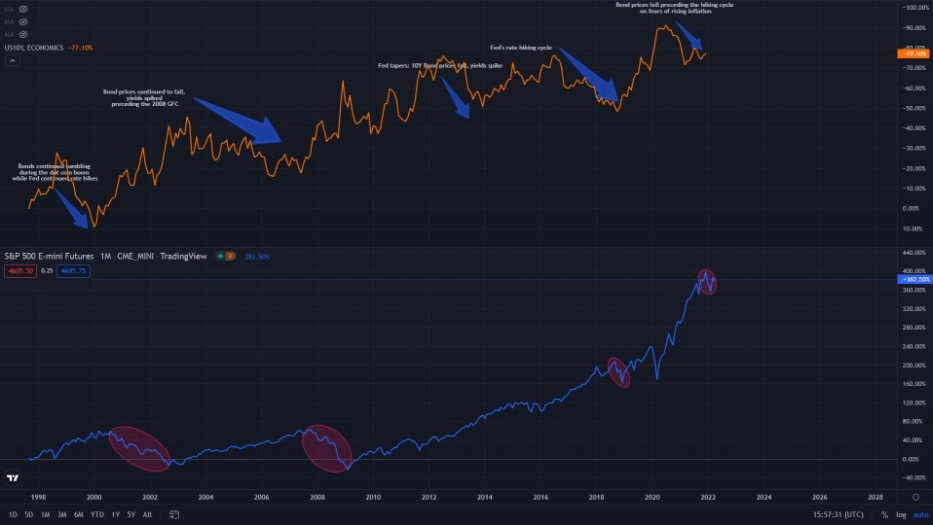
In the chart above, every Fed rate hiking cycle and the bond market moves were followed by a stock market rout. Also, almost every rate hiking cycle has also resulted in economic recession in the US.
Which doesn’t mean that one should start selling off with a first move in the bonds. Market gives enough time and opportunity to move out of the stocks. During dot com boom, the Fed started its rate hiking cycle in 1996 while the stock markets topped in 2000. During GFC crisis, the rate hiking started sometime in 2004 while the stocks topped out in 2007.
Conclusion: While we are glued to our screens to watch every tick in the stock prices. It is way more important to look at other asset classes to see what they are telling us and if we are missing the woods for the trees. In the short term it would be prudent to watch moves in the currencies while in the long run keep an eye on the bond markets.

Leave a comment