After I posted my last update on commodities (link here), many commdoities have indeed moved in a direction that was visible on the charts and making it difficult for the Fed from inflation point of view. Let’s take a deep dive into what next in the commodities world.
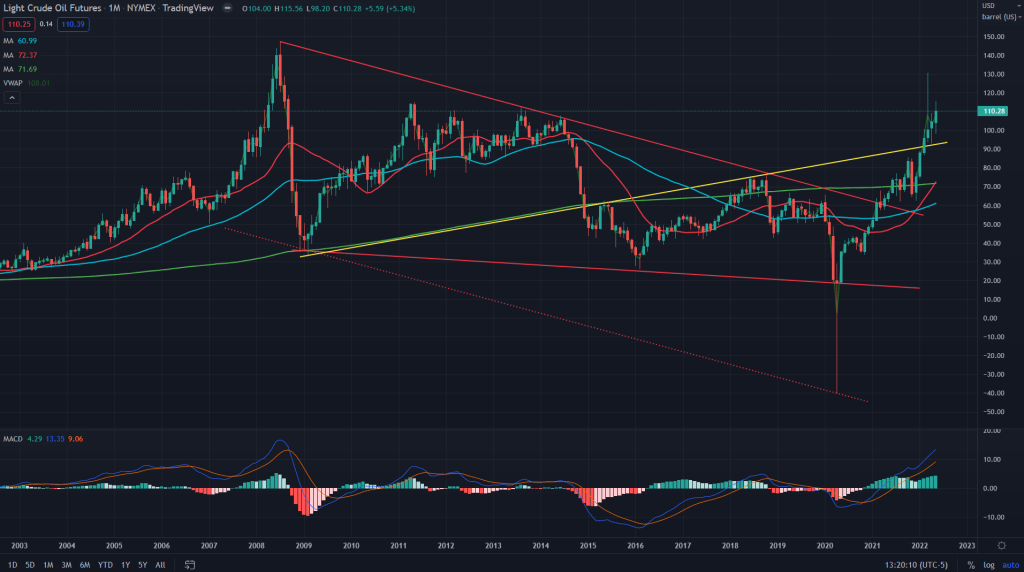
WTI Crude oil (CL futures): The long term monthly chart of crude oil has been notified by many (including yours truly) in the last 12 months and what we have seen is a typical text book case of rising wedge breakout that played out.
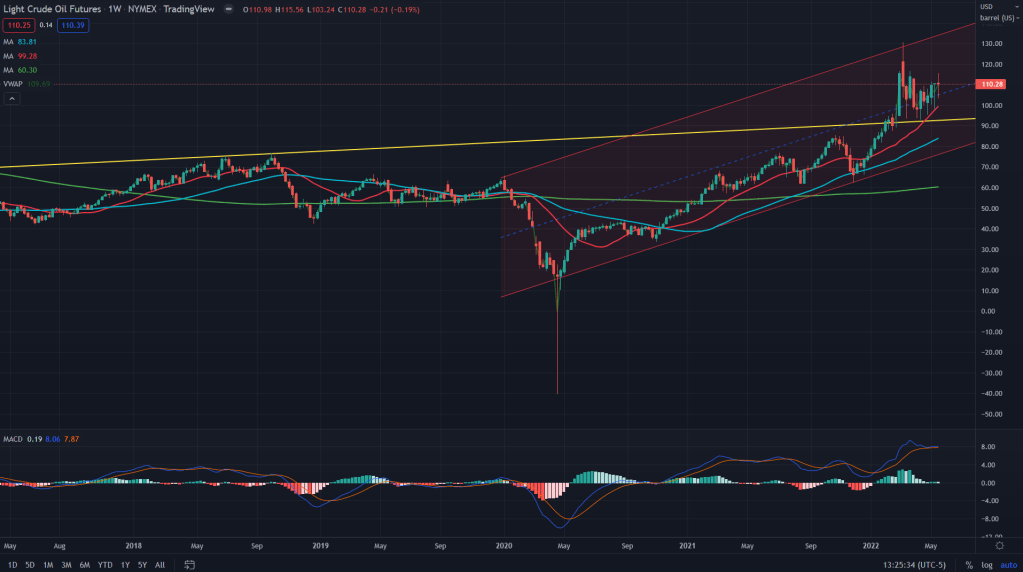
And when we zoom in further onto the weekly charts of crude, it appears to have found resistance at the upper end of the channel resistance and bounced back after mean reverting on the weekly.
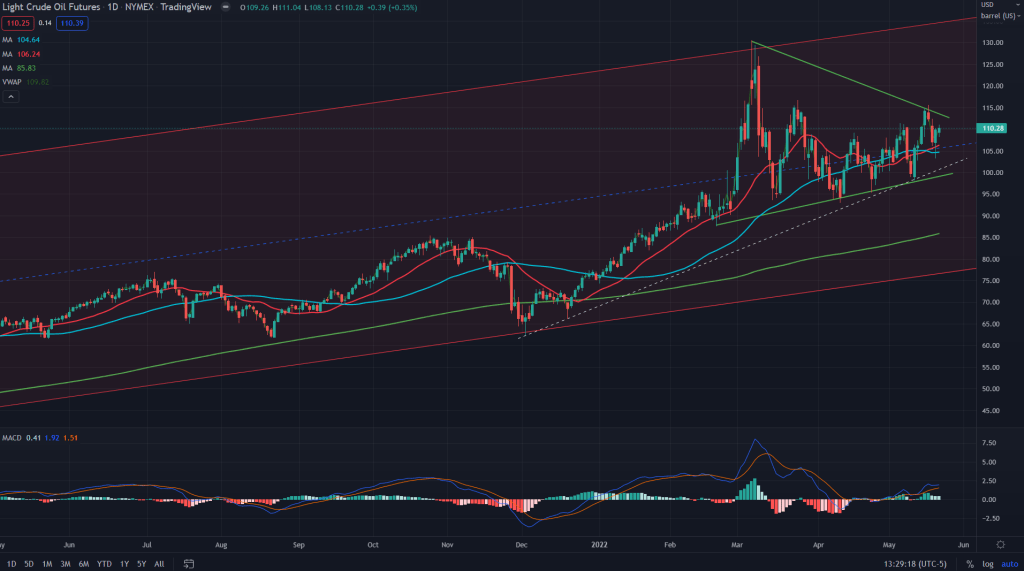
Zoom in further and we see consolidation in the form of triangle formation. Which way would it break would be a flip of the coin, but given geopolitical situation around, I would like to lean bullish for a retest of the channel resistance on the weekly. Probably 130-140 is where one should find new levels to come into play.
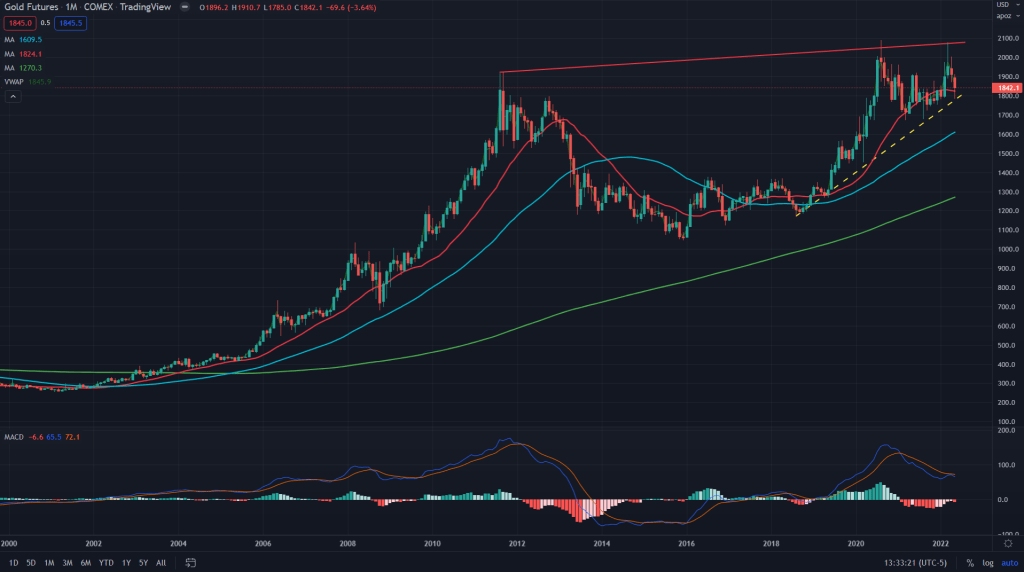
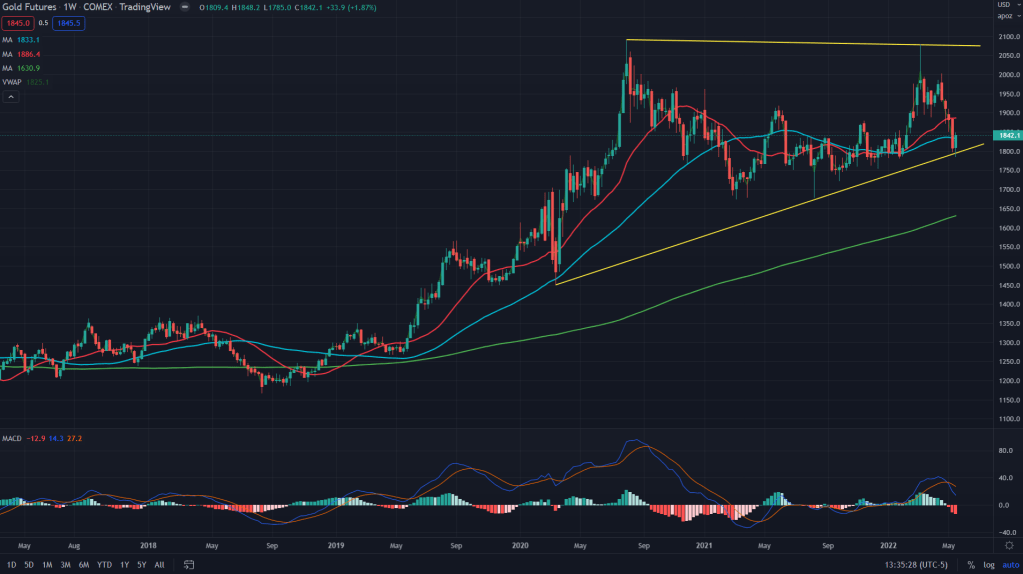
Gold (GC futures): As posted earlier, gold exactly reversed from its monthly resistance of the C&H pattern and retraced back towards the C&H’s handle support.
Zooming into weekly chart and another beautiful ascending triangle is in play. One would want to buy gold at current prices with keeping an eye for the breakout anove recent highs (2078) and stops placed below last week’s lows (1785).
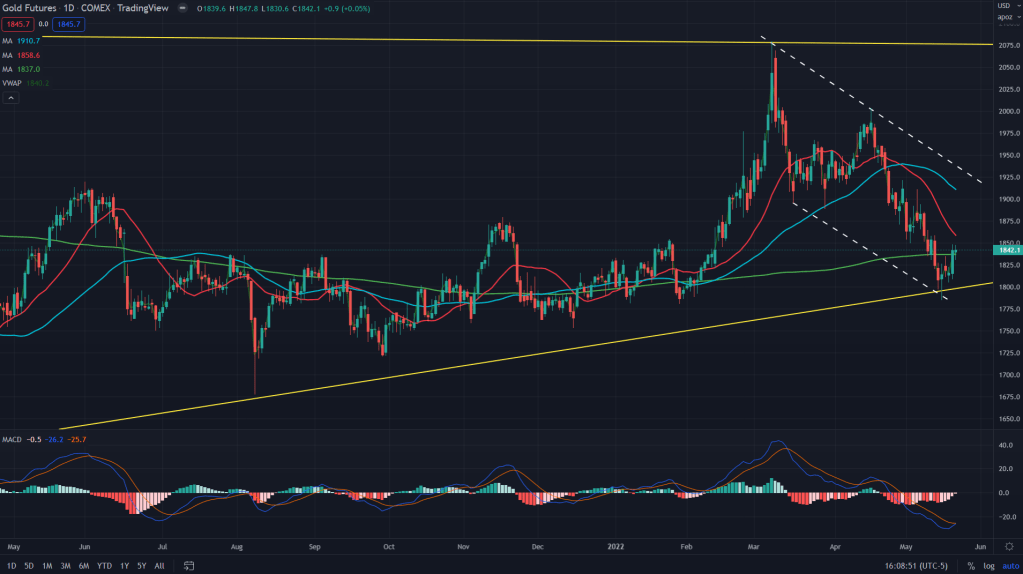
Further zoom in, bull flag is forming on the daily and there is a resistance in the form of 20 and 50 SMAs. But as we have seen multiple times recently on many charts, when higher time frames come into play (weekly and monthly), resistances and supports of lower time frames, whether SMAs or demand/supply zones, don’t play for long and higher time frame patterns complete themselves out. I would use any retracement off the daily SMAs as a buying opportunity in gold.
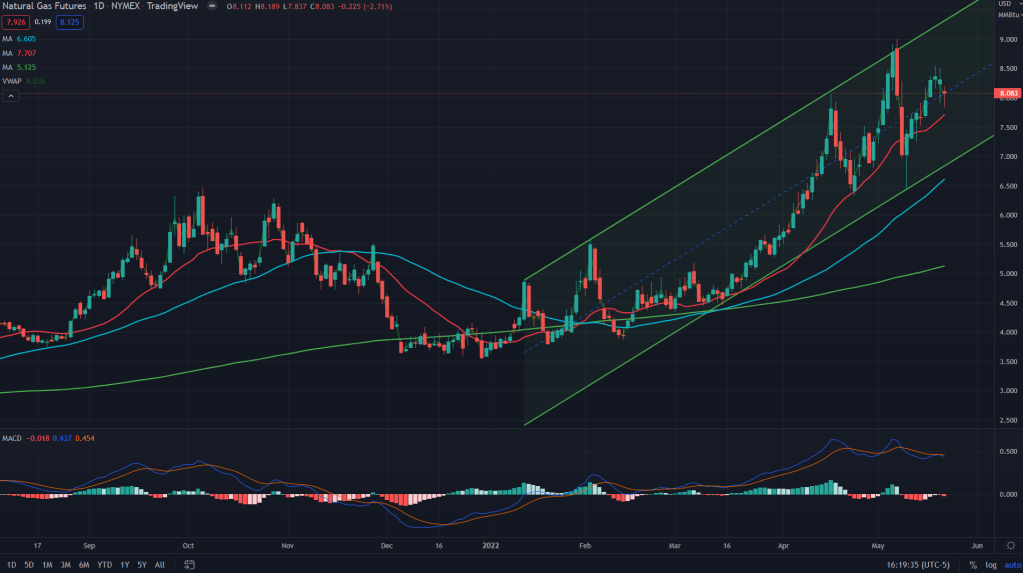
Natural Gas (NG): As it was pointed in the last update, NG had broken out of that long term triangle and all those resurgence of the last few months was a result of this breakout.
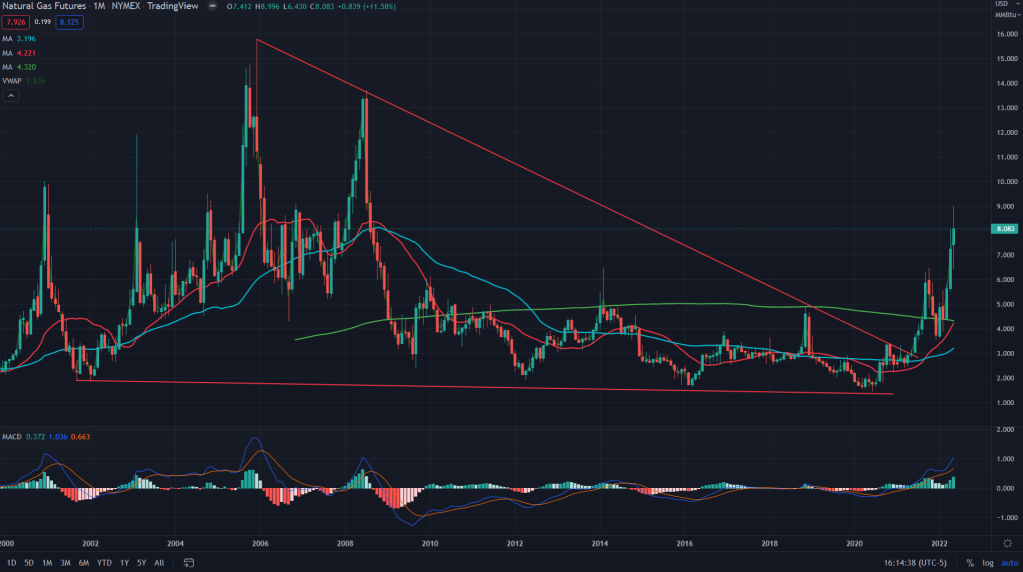
While, that breakout played well, it is now finding resistance in the form of a weekly channel and it would difficult to sustain past this. I would not be bullish on NG here anymore.
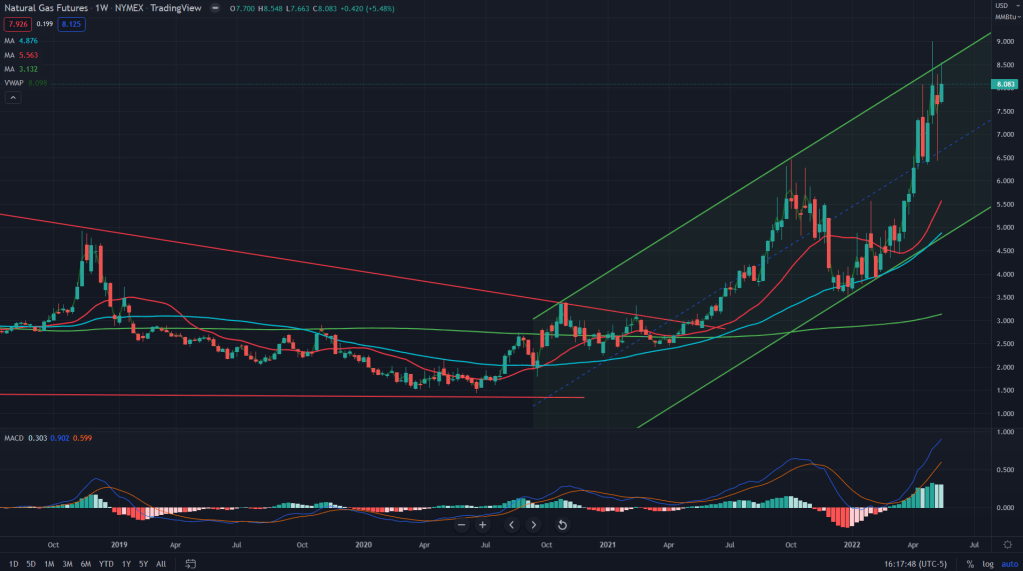
On the daily, while mean reversion resulted in a good enough bounce, I would suspect one retracement towards the 50SMA is overdue.
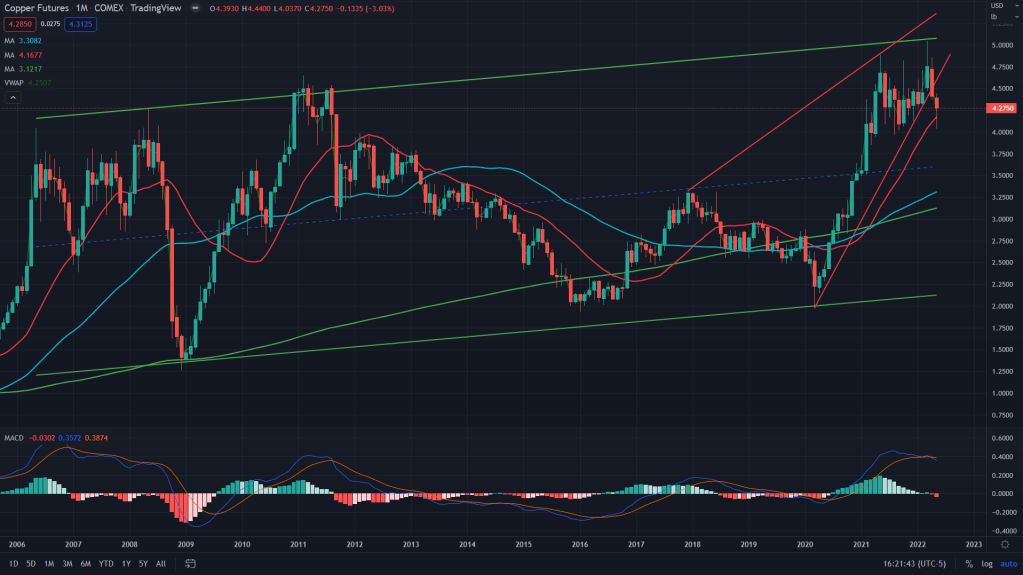
Copper (HG): While all the other key commodities played beautifully to the upside, copper was the only one that broke down of a long term rising wedge. Any rallies in copper should be a selling opportunity for the bears.
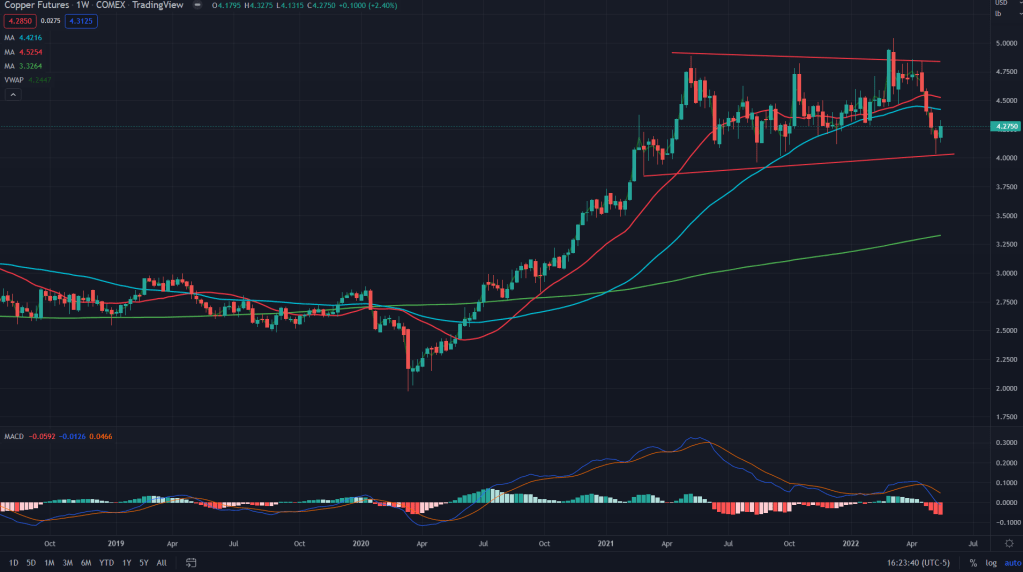
On the weekly, it is basing out for a long time now and its all about a decision time I would say. Breakdown coming? My bet is on the downside.
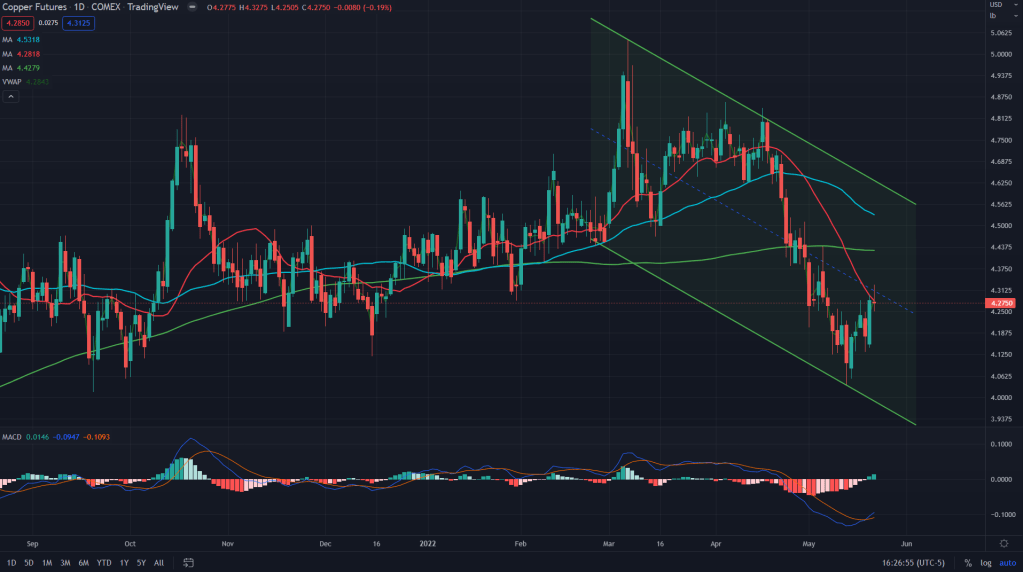
Daily chart of copper points towards trend change and downard channel playing out. Whether it turns into a bull flag, remains to be seen. I would not be bullish as long as weekly and monthly are pointing into other direction.

Leave a comment