Although its been more than a month since I last wrote my article here, but those who follow me on Twitter, they know I have been actively posting my views there and it has been bullish trades more often than not. That begs a question – Why have I turned bullish in these turbulent times when markets have been making new negative headlines all around? Let’s see in this article where I would break it based on technicals as well as some macros, starting with technicals first:
TECHNICALS – What do the charts say?
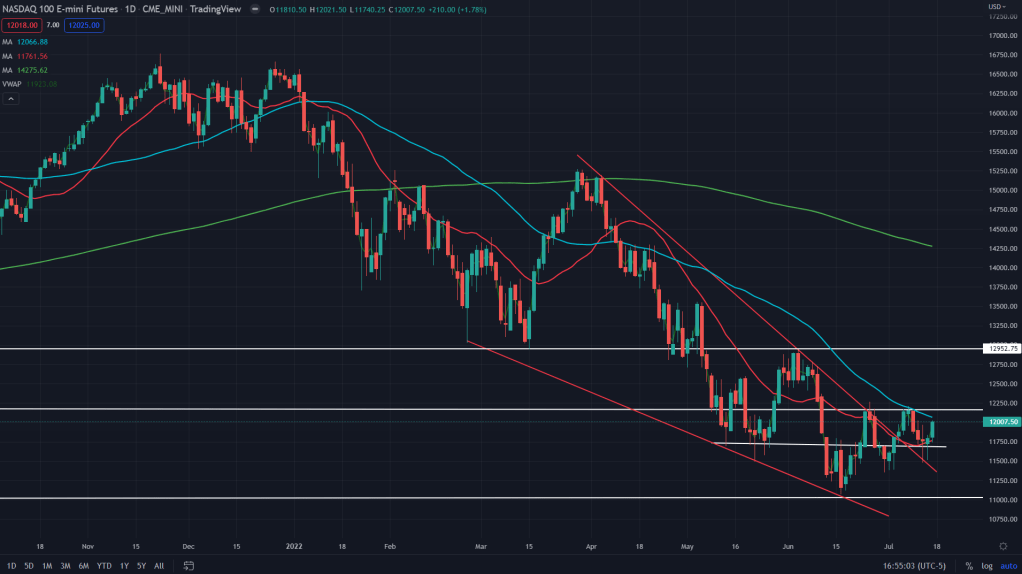
Here’s the daily chart of NQ futures. While I had already mentioned on my Twitter feed (here, here and here), there was a falling wedge breakdown that broke out, backtested and rallied back up. We traded the breakout and the rally after the backtest as well.
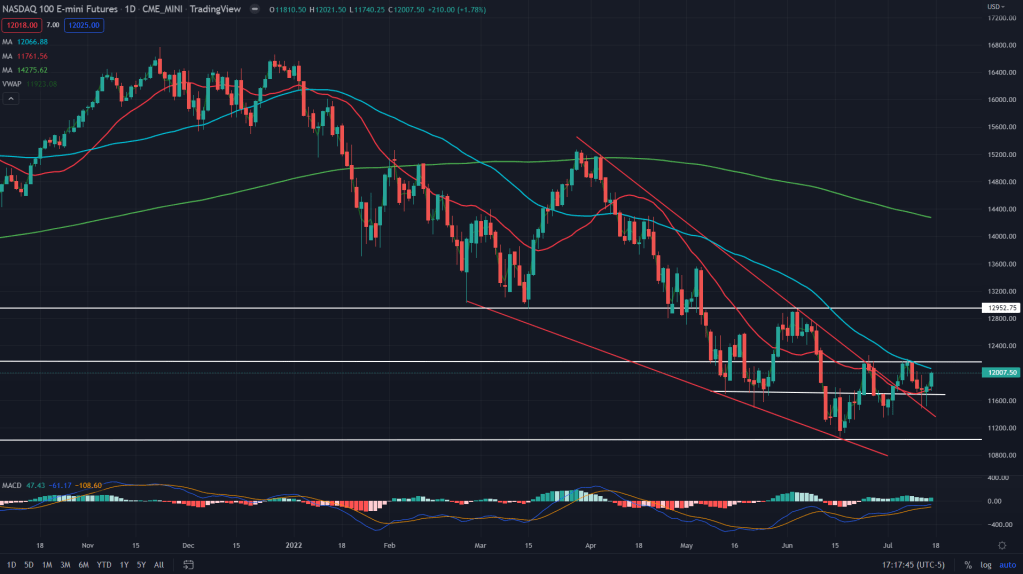
Not only that, the first indication of the turnaround came with the rally from the weekly demand zone (around 11,060 levels) after the sharp sell-off on the June 13th. After that there were many positive divergences on the MACD along with the wedge breakout, 20SMA crossover and daily supply crossover (11690).
This weekly chart on the NQ now gives us more clues on what to look forward?
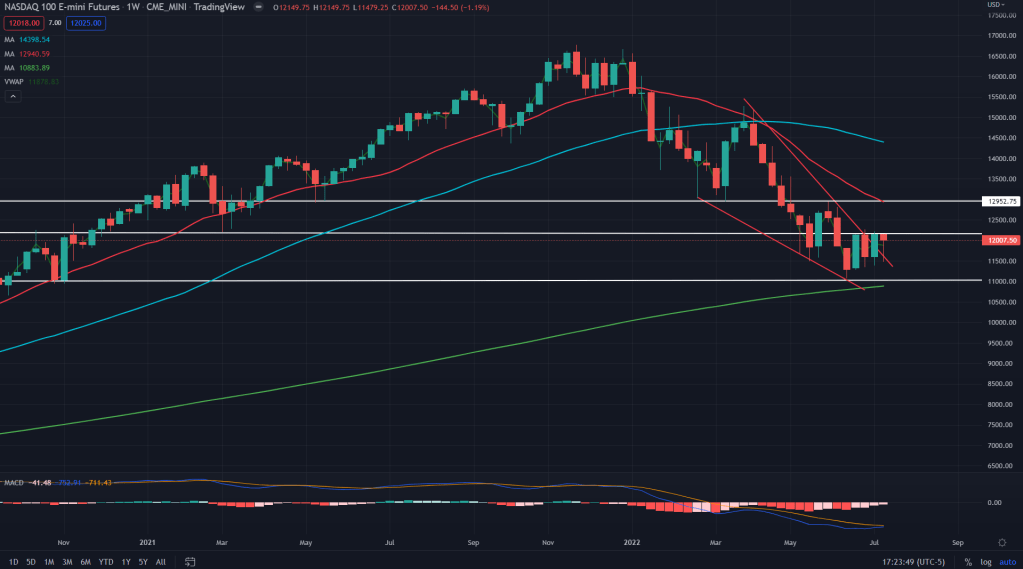
The reversal of last week was based on the hammer candlestick on the daily on July 14th (where we went long at the close) and the confirmation was there for everyone to see on the 15th. Although we do face 50SMA as the immediate resistance along with daily supply zone around 12,160, bulls can still continue to buy the dips as the weekly hammer is formation of last week gives them enough ammo to bet on. Buy the dip remains the mantra for the coming week for the targets of 12,950 where bulls have to face music from the bears at the weekly supply zone.
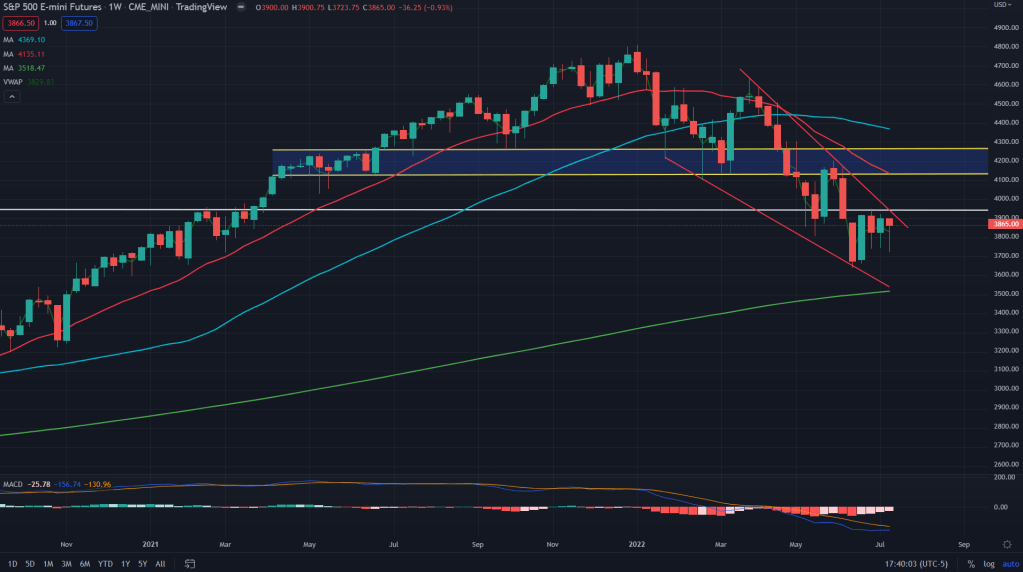
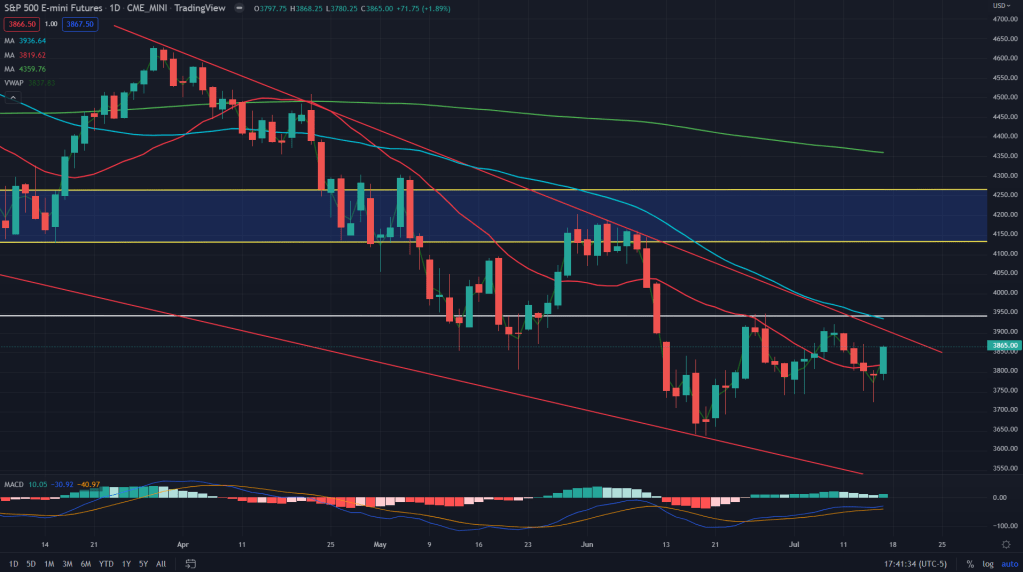
Moving on to the ES now: While, NQ has already seen the breakout of the falling wedge, ES is on the cusp of breaking one and also has a similar weekly hammer candle formation. In a nutshell bullishness abound on the ES too with targets of 4125 supply zone. The weekly and the daily charts below give good enough view of what happened and what to expect going ahead
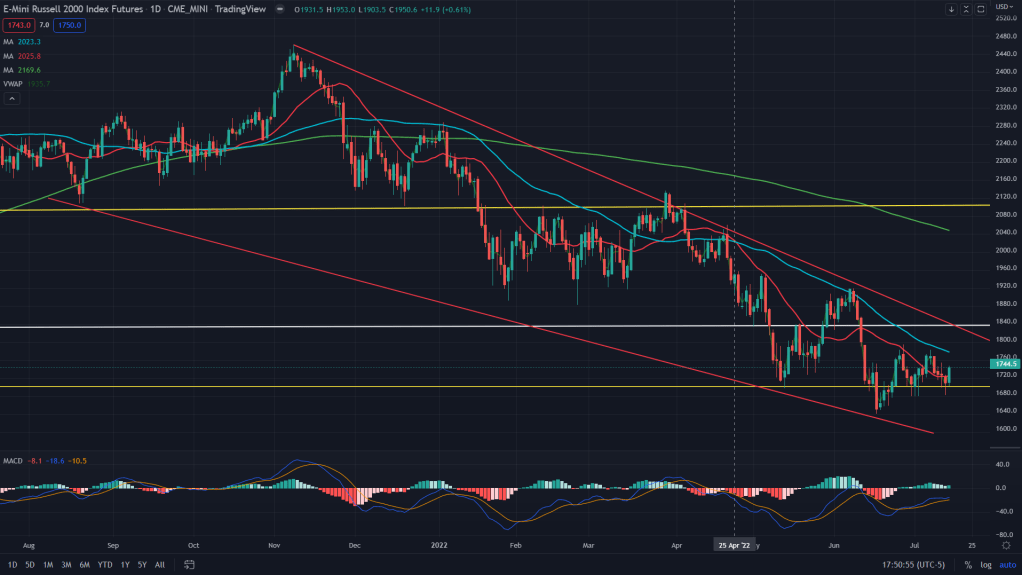
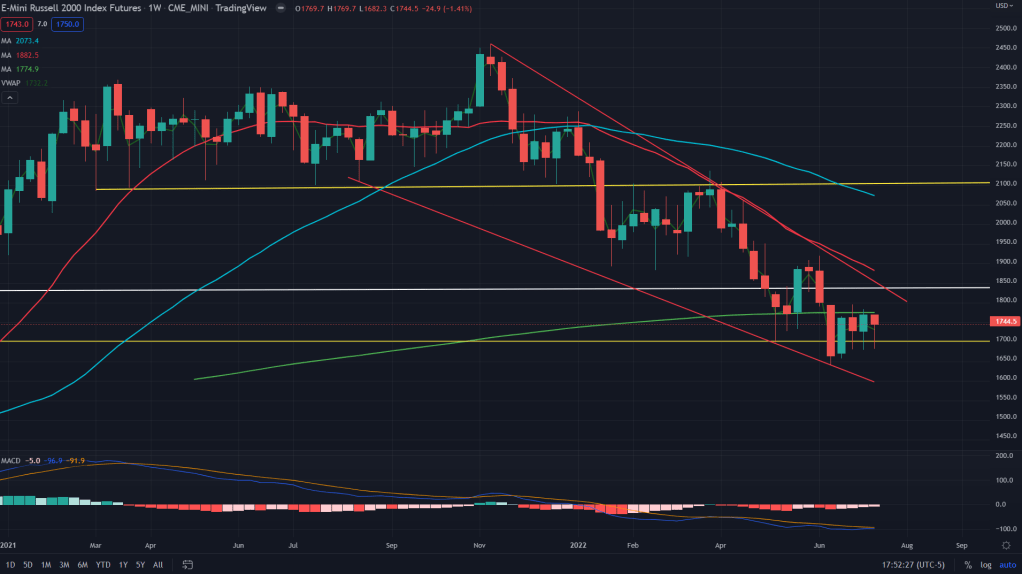
RTY on the similar footing: Weekly hammer, bounce from the weekly supply zone and falling wedge, although not yet completely formed but gives further hope to the bulls, while daily charts still have resistances in the form of 50SMA (17,78) and the supply zone of 1,840. One step at a time on the RTY.
While those were all charts and technicals, lets focus whats happening on the macro front now.
As I have always been mentioning, markets run on a discounting mechanism and what we see today may have already been priced in and there may not be enough of a surprise quotient there. All of last few months the major theme has been what’s happening with inflation and how the Fed may react to it. While, markets continued to believe that the Fed was behind the curve all of last year, but given the way inflation has surprised on the upside and the aggression with which Jerom Powell have had to act, made bond markets and the equity markets price in something that wasn’t even there on the table earlier – 75bps, 100bps hikes in the forthcoming meeting. Not only that, given the stickyness of the inflation expectations, Fed won’t be in a hurry to pause anytime soon.
No wonder, the bond market is pricing in the Fed Fund rate of 3.75-4% by the end of this year. Which means the bond market already has priced in another 225bps of the rate hike by the Fed.
Now lets go back to the hot news of the week gone by: We have had 9.1% monthly CPI print – something that the US has not seen in many decades. The markets reacted negatively immediately, expecting the Fed would be forced to do the unprecedented – hiking by 100bps in the July FOMC meet. But the sell-off didn’t last long enough and the markets rebounded the very next day and the day after too.
This is what discounting mechanism is all about. Markets are a wild animal and is nothing but a function of emotions of traders and investors combined. As they say, when bad news is no more bad news, you know you have to be in a bullish trade. That doesn’t mean we have reversed for good and the bear market is over. Far from it. What we are trading right now is perhaps a bear market rally and what lies ahead is even more tougher – recessionary times.
Yes, the market has already started pricing in the recession too and hence expecting the Fed to start cutting by the end of next year or at best at the start of 2024. While it’s easy to price that in, but markets and the economy has not seen what we are seeing currently – High single digit inflation and the growing economy. This gives enough ammunition to the Fed to continue to hike until the inflation comes down crashing. But will it? Given the workforce demand going strong and the supply constraints remaining to be sticky, it is going to be a rough next few months for the economy and the way Fed and markets may have to react to it.
For now, I would bet my money on the upside as long as it lasts and whatever my charts show me. But I won’t stop looking at the macro numbers to keep an eye out on how I may have to tweak my long term portfolio.

Leave a comment