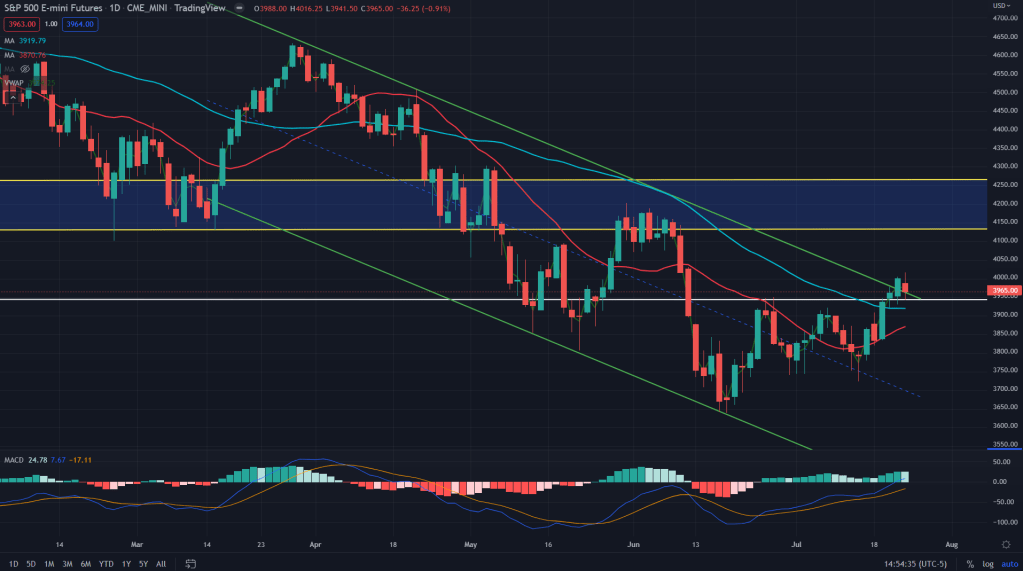
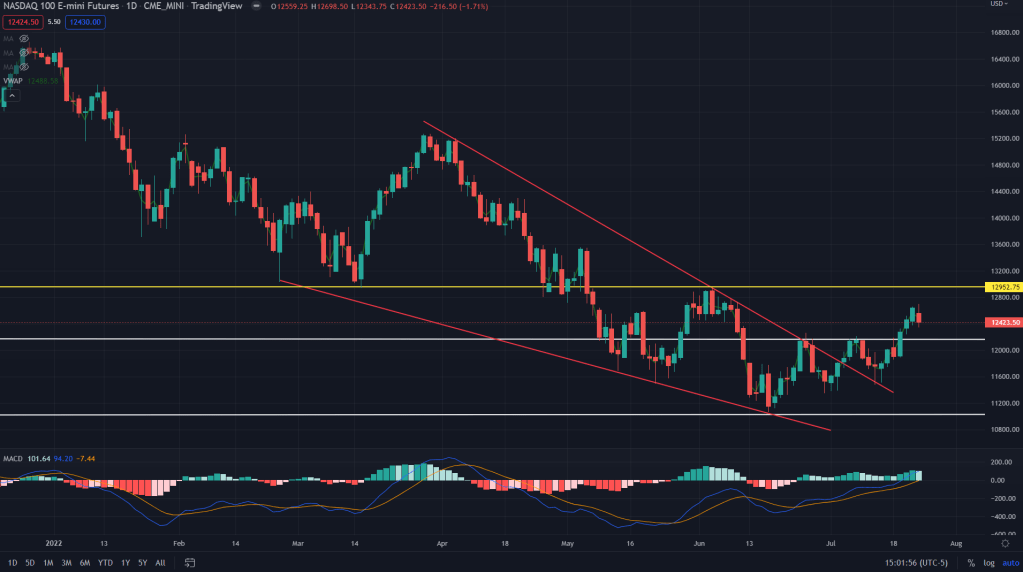
ES (Daily): As posted last week, the ES was on the verge of a falling wedge breakout, which it finally managed to do last week and then gave up some gain (as was again expected during our mid-week post). What’s now visible is that it is either a falling wedge backtest as posted below:
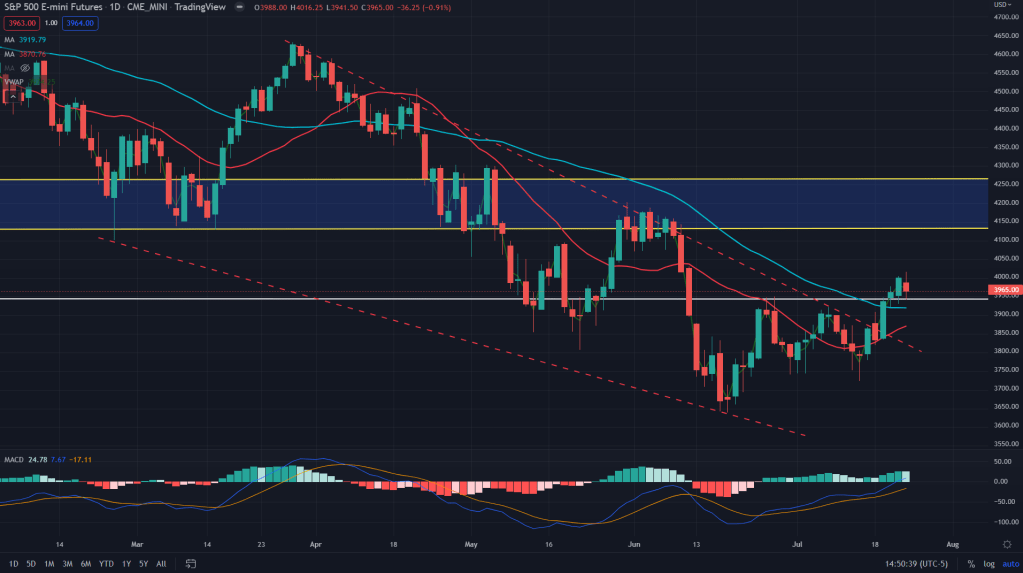
Alternatively, it could also be falling from the upper end of the downward sloping channel (its not a bull flag). In either cases, some more give away is due before markets figure out the next course of action.
ES Weekly: When we look at the weekly charts, the moemntum on the downside looks to be diminishing for now and even if the downtrend resumes (after it seems to be cratering from upper end of the channel), the chances of a sharper bounce are higher from any lows it may make in the coming weeks.
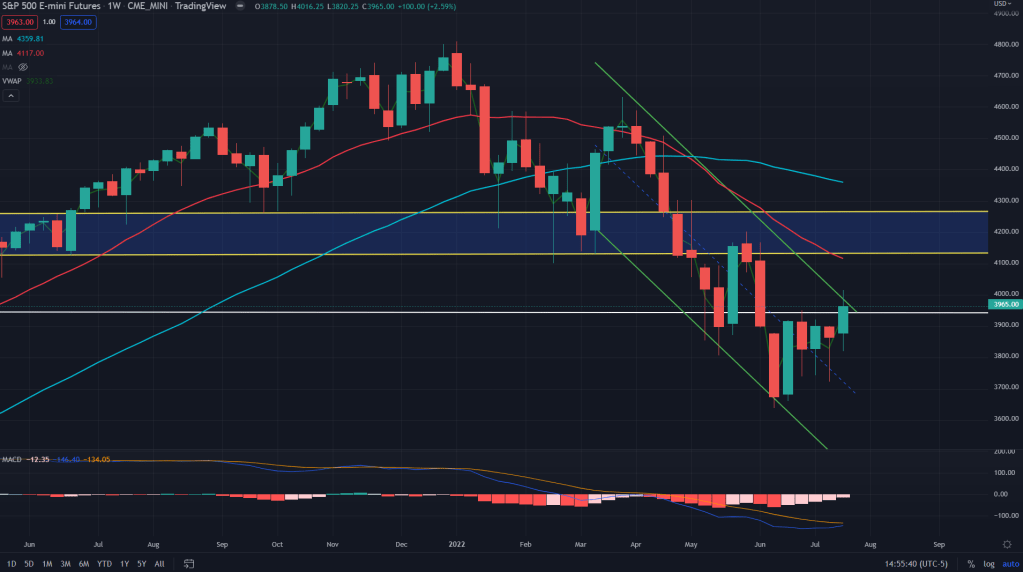
And there is a reason why I went short on Friday (shared on Twitter). Negative divergences have started developing on lower time frames and there was opportunity to make money by going short. There is every likelihood that these divergences develop into higher time frames as well. But, for that markets do need to go higher.
ES conclusion: In short, downside looks limited from here (for now) and I would be willing to go long as and when opportunity shows up.
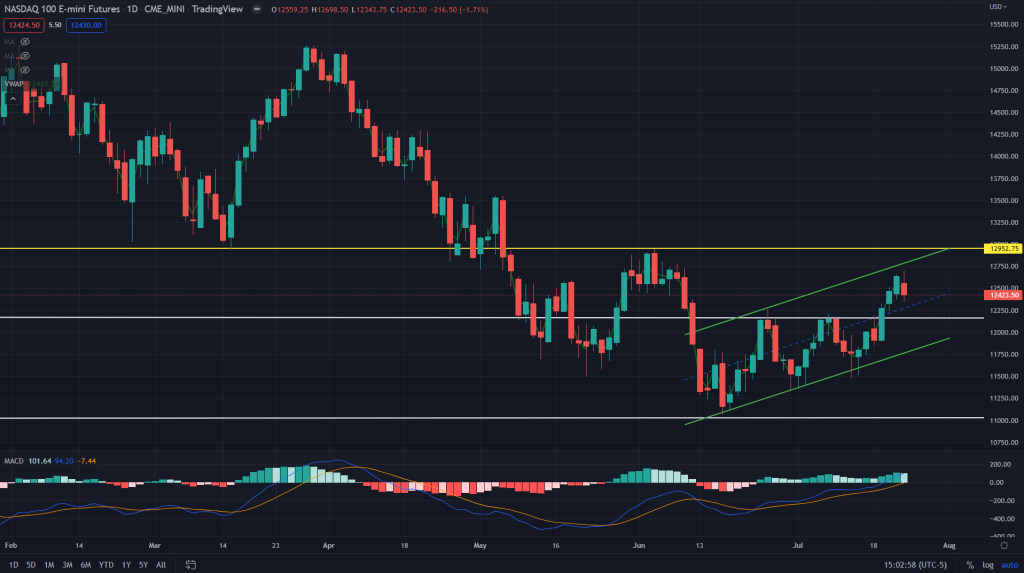
NQ (Daily): NQ was among the first ones that broke out of the falling wedge on the daily chart, backtested and then rallied again, as we noted in the previous posts.
But when we look at the charts in a different way, it also is forming a bear flag on the daily and as long as this pattern is in the making, bulls can’t be heaving a sigh of relief.
And as the weekly chart notes, it almost went short of touching the weekly 20SMA and wwekly supply zone (in yellow).
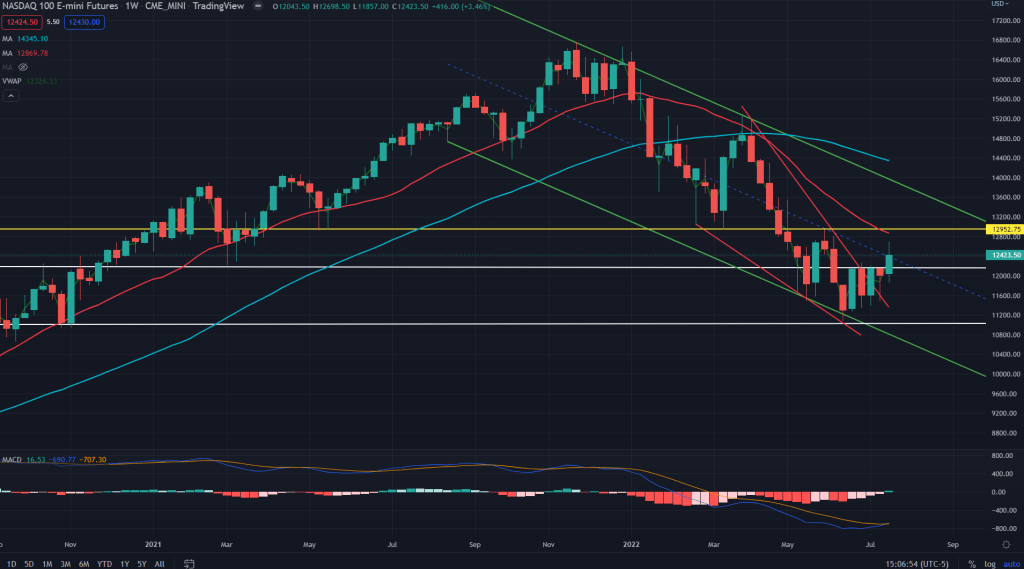
NQ conclusion: I won’t be taking any new bullish position on the NQ as of now until the crossover of 20SMA and weekly supply zone.
RTY (Daily): Almost there bulls, almost there. Every other index futures broke out of their respective falling wedges and rallied, the only one lagging thus far is the small cap index RTY. I would expect it to crater a bit before attempting to breakout in the coming week. Worth buying it around the 20-50 SMAs (1750-1775 as of Friday’s close) for an attempt to breakout.
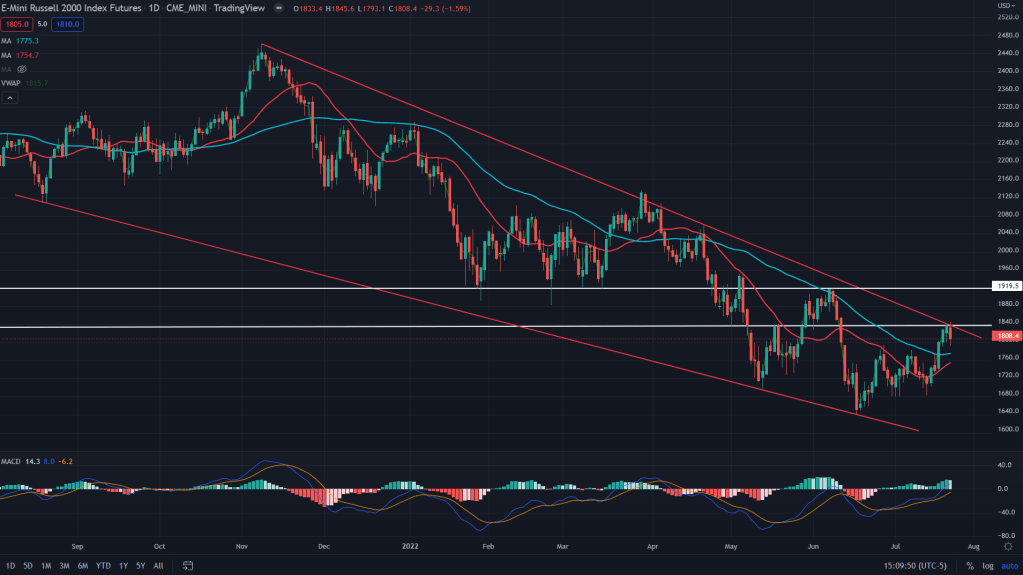
Alternatively, it is also forming a bear flag on the daily and if bulls give up on the 20 and 50 SMAs then one would have to watch out for a bear flag breakdown. I’m not bearish until we close below 1740 on the daily.
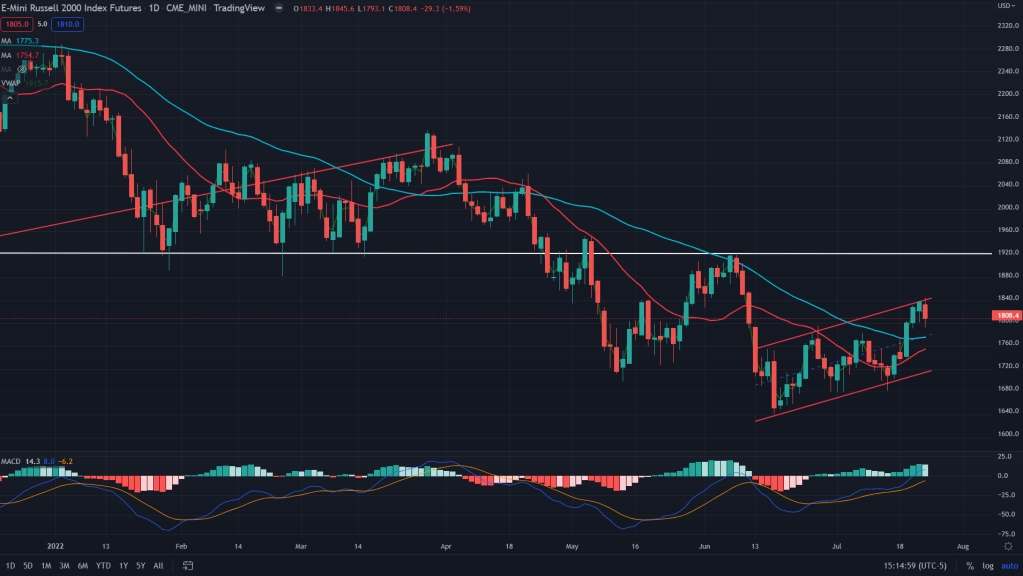
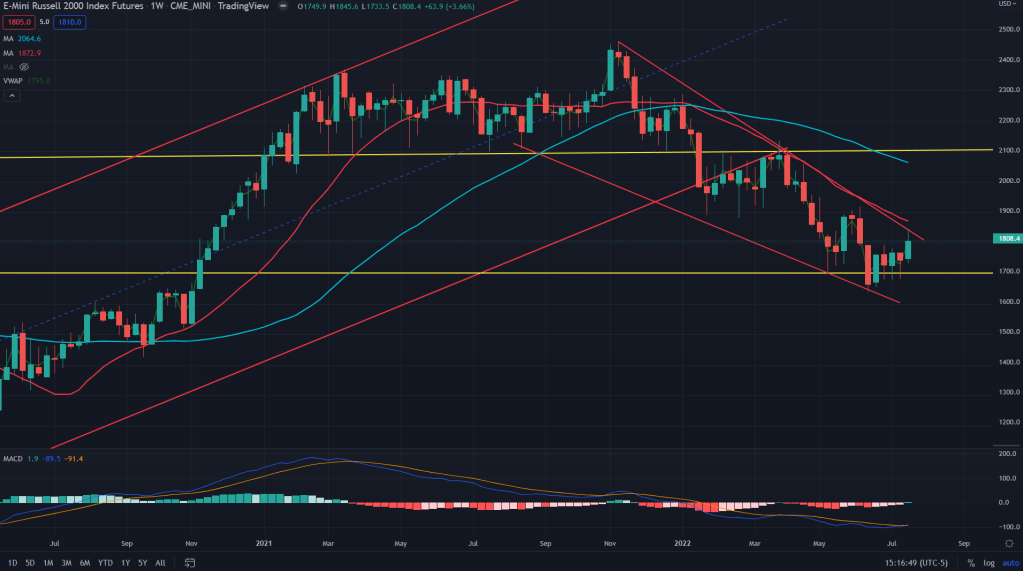
RTY (Weekly): The falling wedge that we talked about on the daily is clearly visible on the weekly. Bulls can get excited as soon as we cross past the upper trendline (1830-40). There is also 20 weeks MA at 1870 currently which might provide some resistance next week.
RTY conclusion: For now, lets keep an eye on the daily 20-50 SMAs to be on the buy mode.
YM (4H): The industrial index futures of the Dow Jones is on the verge of breaking down of a rising wedge on the 4H charts. Once broken down it can easily fall rapidly towards 30,500, about 1300 points more from Friday’s close.
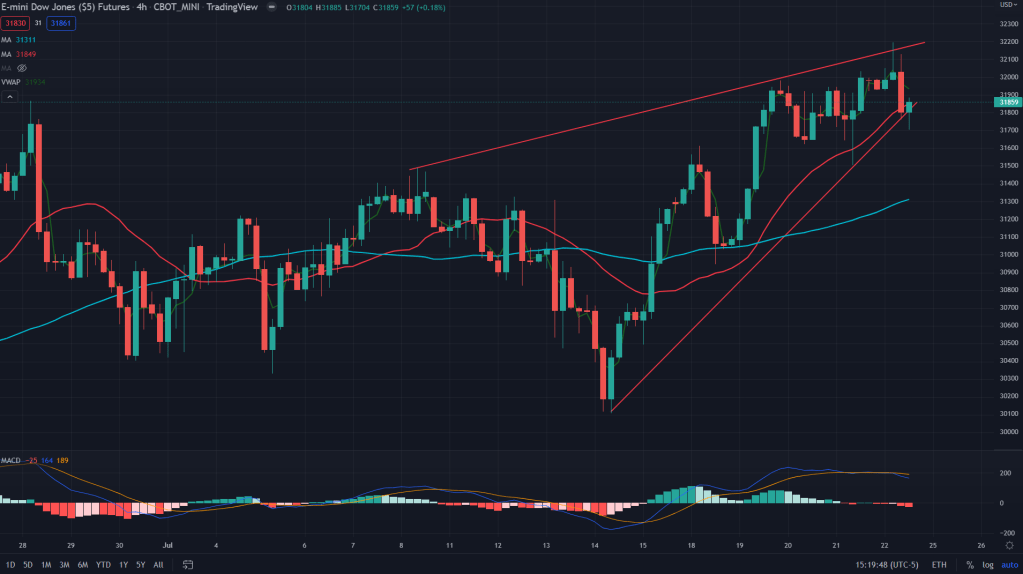
Alternatively, on the daily charts, there is a bear flag formation too. In either case (4H and daily), its a bearish sign for the YM and the risk rewards are in favour of the bears. I would go short once it breaks down on 4H charts. I would update it live on Twitter (if it breaks down while I am awake and not overnight during sleeping hours).
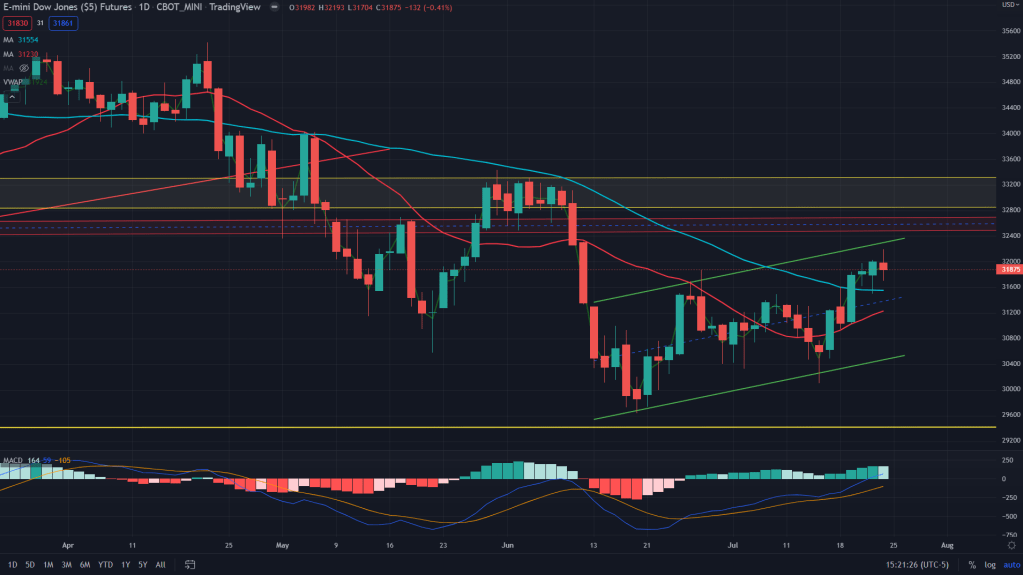
YM weekly: The weekly chart of YM shows it is following downward sloping channel and it cratered from upper end of the channel. Expect some more weakness on the weekly too.
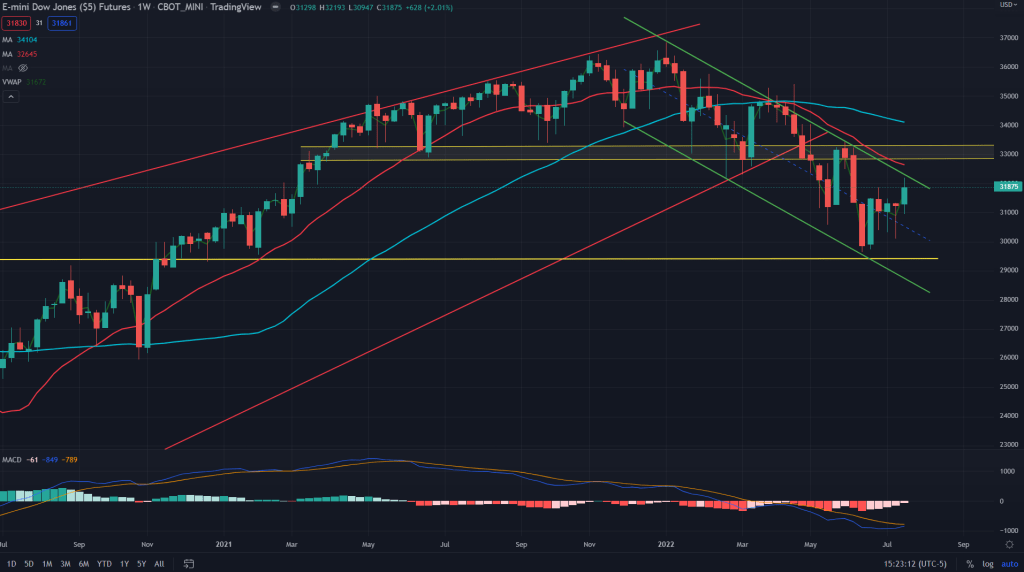
YM conclusion: I would be going short based on 4H and daily candles.

Leave a comment