Quick update on what’s happening and what is developing on the charts.
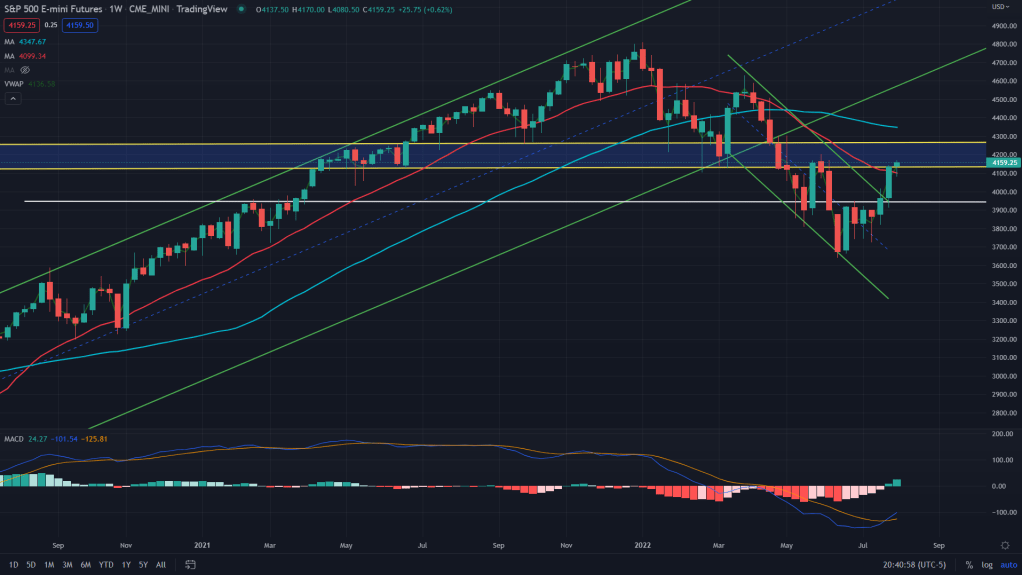
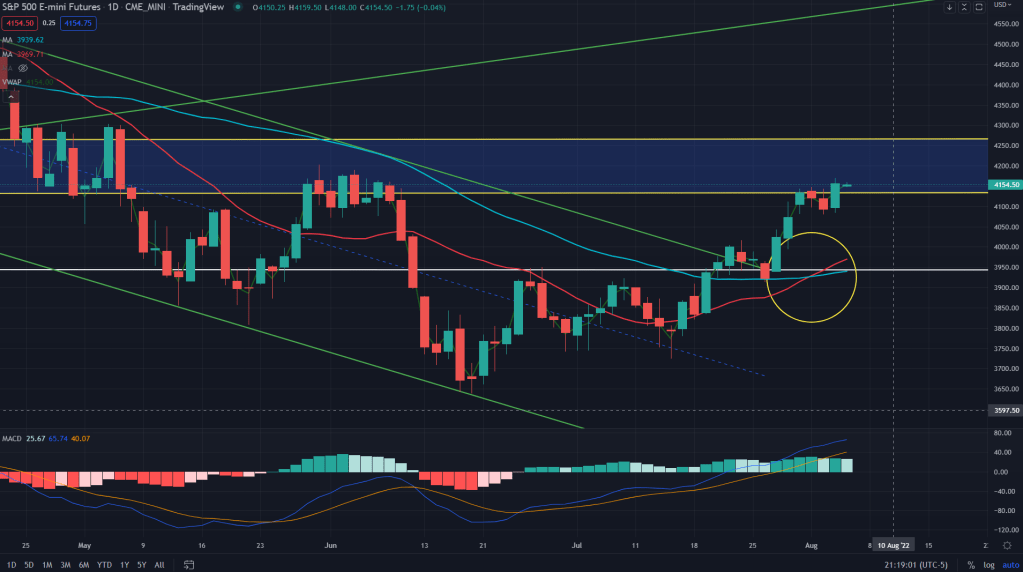
ES (weekly): While, the 20 weeks MA has crossed over, bulls have to be very careful as ES is sitting right at the middle of a weekly supply zone of 4125-4260.
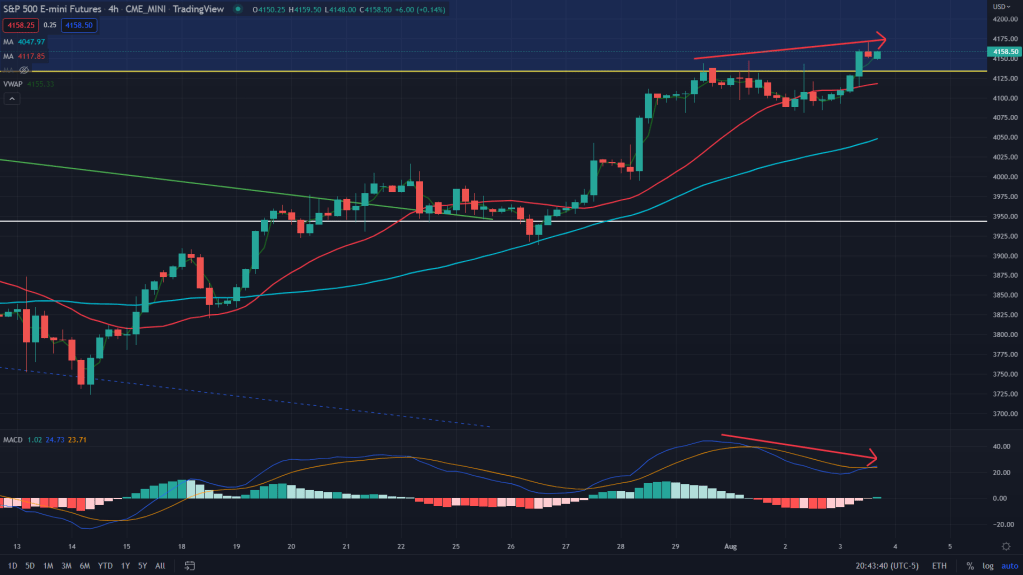
ES (4H): When we zoome in and look at the 4H chart, we can see momentum fading away as the negative divergence takes shape as depicted in the chart below. I would expect ES to give up some gains towards 4080/4040 levels befire resuming the uptrend.
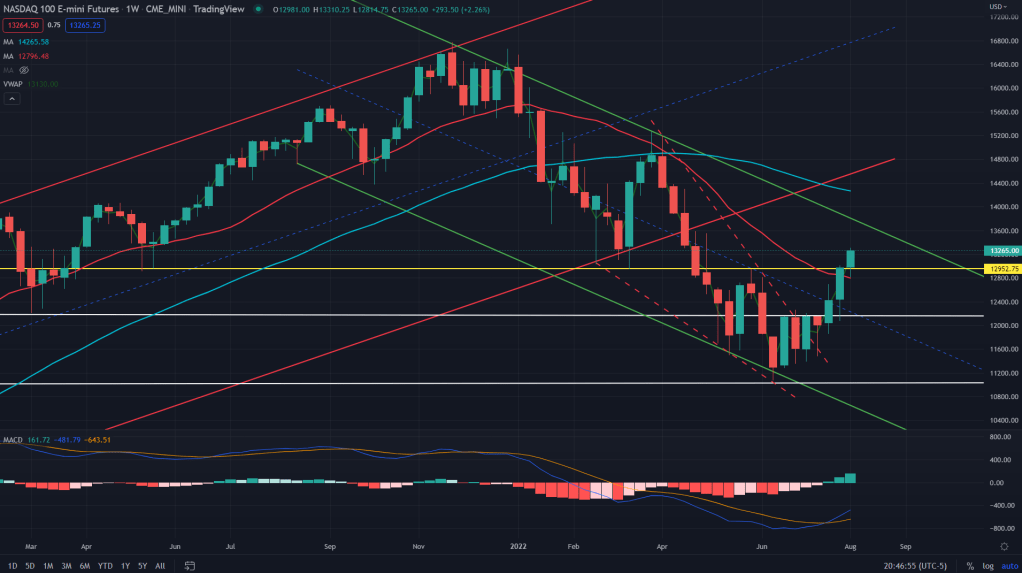
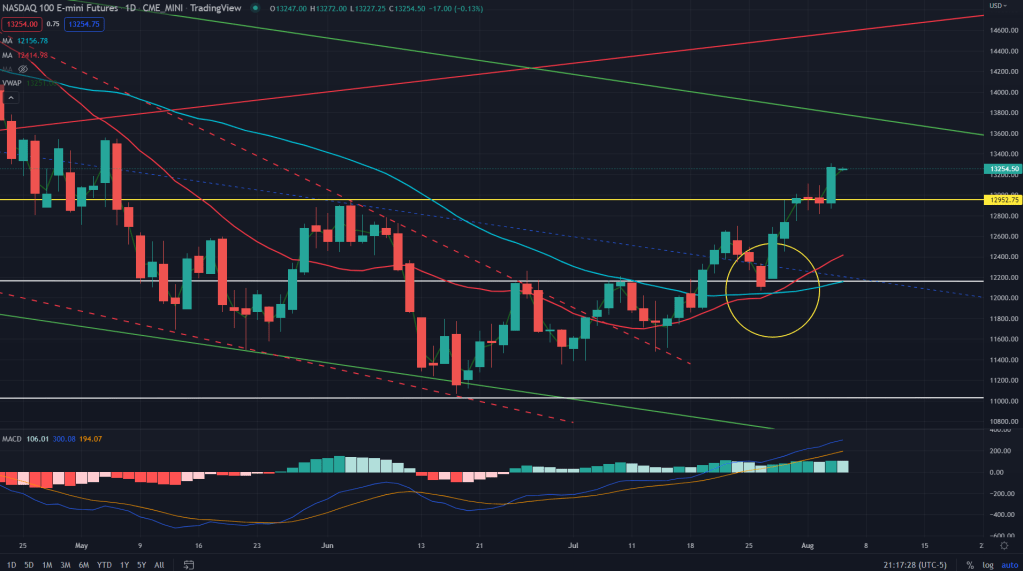
NQ (weekly): The tech index future, NQ has been on a tear ever since the Jue bottom, breaking all the barriers one by one – daily and weekly MAs and also now its past the daily supply zone.
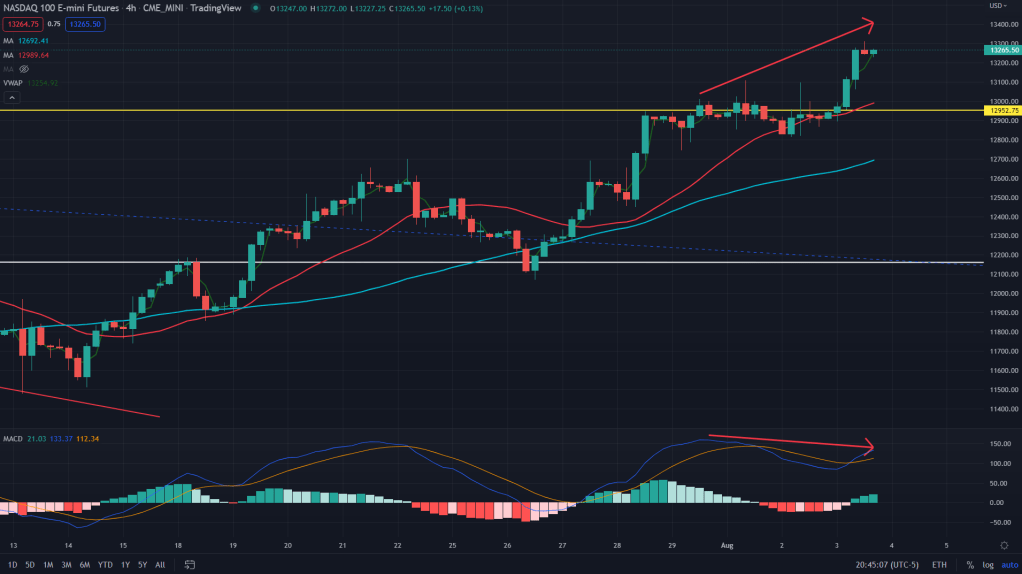
NQ (4H): What can derail or perhaps pause this rally is fading momentum as visible by way of negative MACD divergence in the chart below. 12950 is where I would see NQ to stabilise and resume the uptrend again.
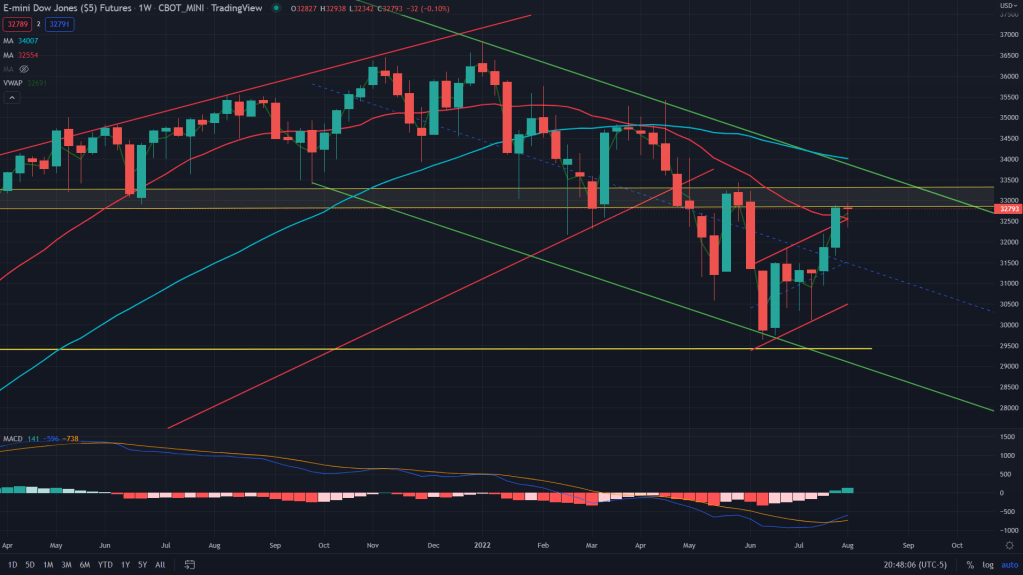
YM (weekly): The Dow Jones industrial futures too is right at the weekly zupply zone and it hasn’t seen much momentum this whole week while all the others were rallying. Quite clearly, the pause in commodities rally is now affecting the Dow Jones index too.
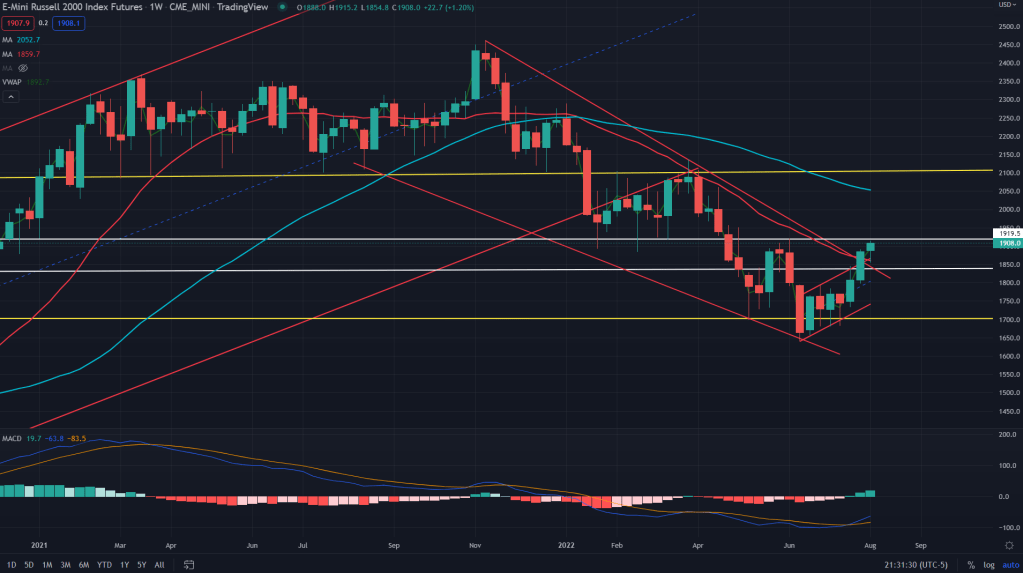
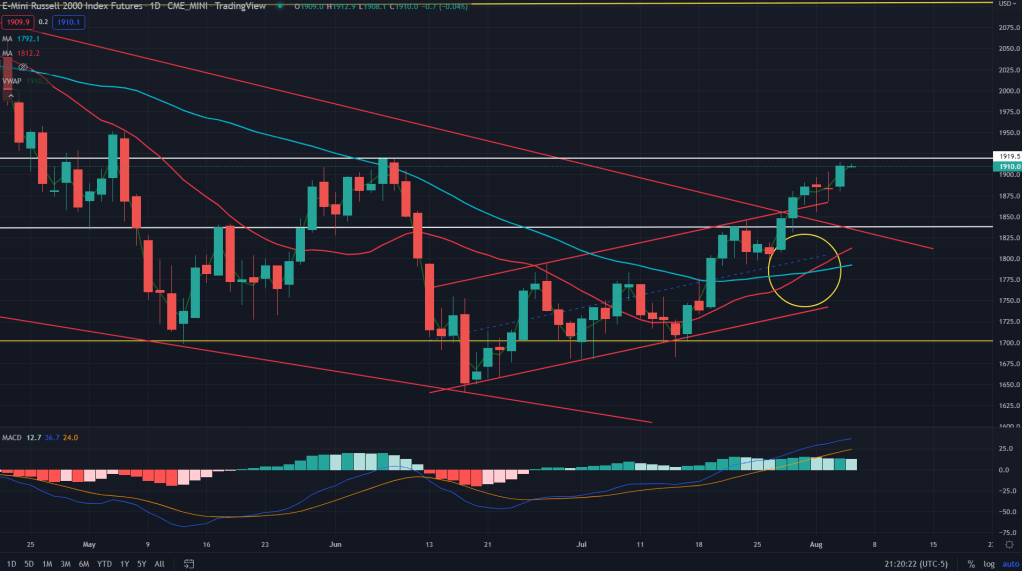
RTY (weekly): The laggard RTY index future has taken a long time to break out of this falling wedge while all the other majors moved. Now that it has broken out of the weekly falling wedge, there are two immediate hurdles it has to tackle as shown in the following 2 charts, the daily supply zone
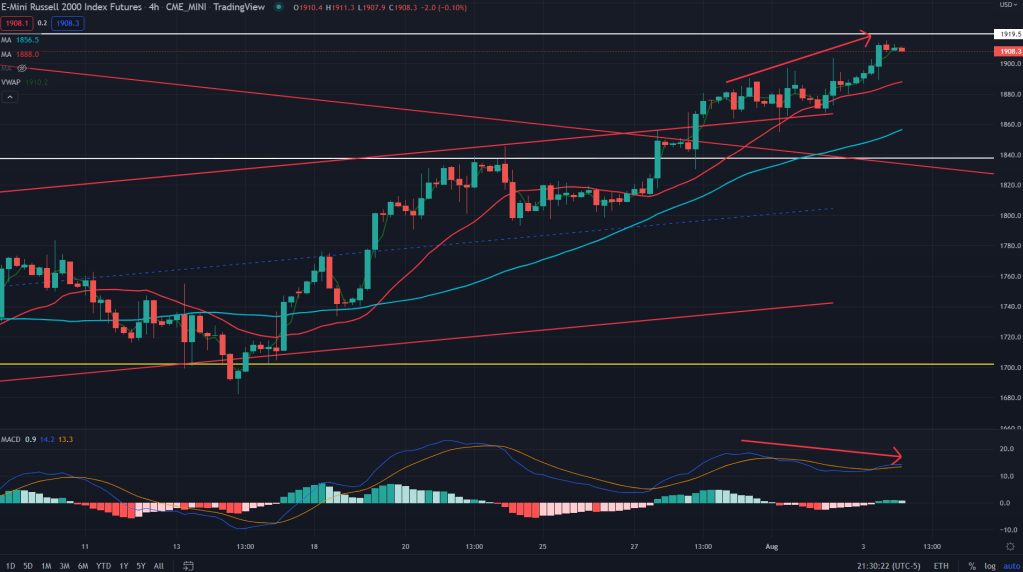
RTY (4H): And the negative divergence on 4H chart. Expect the small cap index to dip towards 1880-65 before resuming its uptrend.
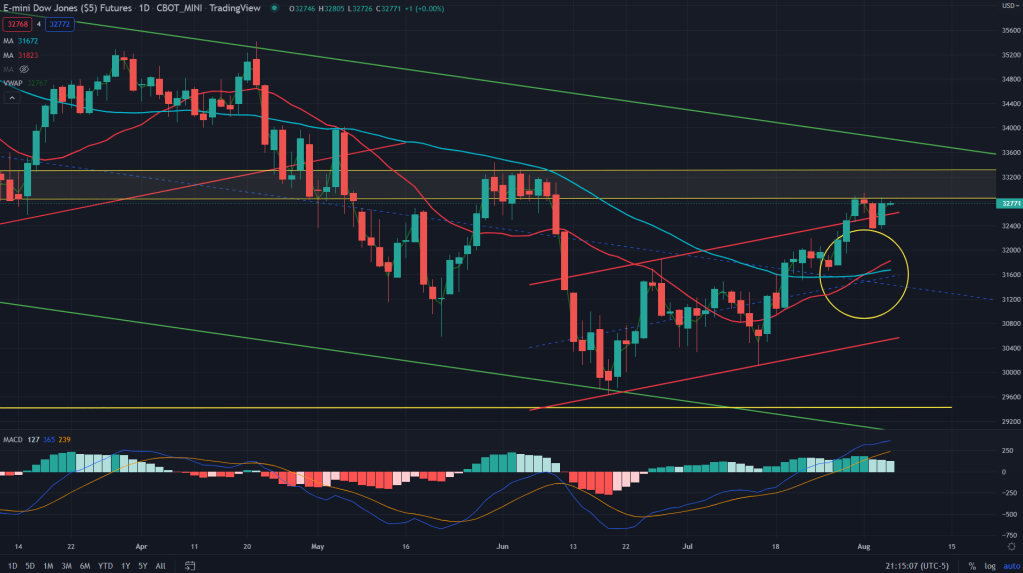
Trend change? There was a reason why I didn’t mention about the daily chart above – The trend has changed to the upside as per trend following indicators. 20 and 50 MAs have crossed to the upside along with making higher highs and higher lows. As long as the weekly chart supports, the trend remains on the upside now. All the daily charts below paint the same picture. Which also means, its become buy on dip market, unless otherwise proven, for now.
YM (Daily):
NQ (Daily):
ES (Daily)

Leave a comment