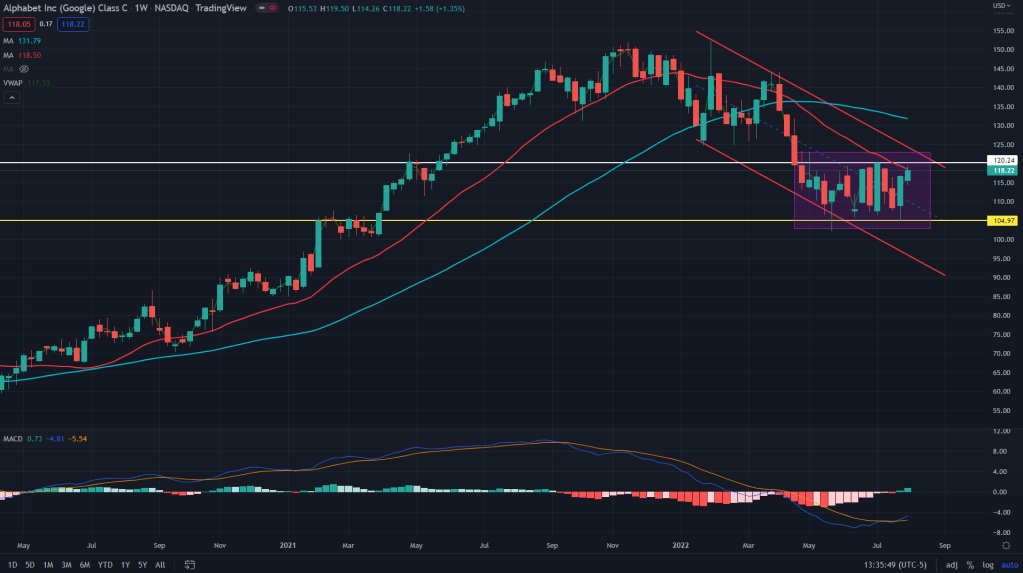
GOOG (Weekly): While looking at the daily chart of the search giant GOOG, one might want to believe its consolidating but when we zoom out, it has bounced off weekly supply and now finding it difficult to cross past the daily supply. It would be wise to sell 2-3 weeks out 125/130 call spread at this point.
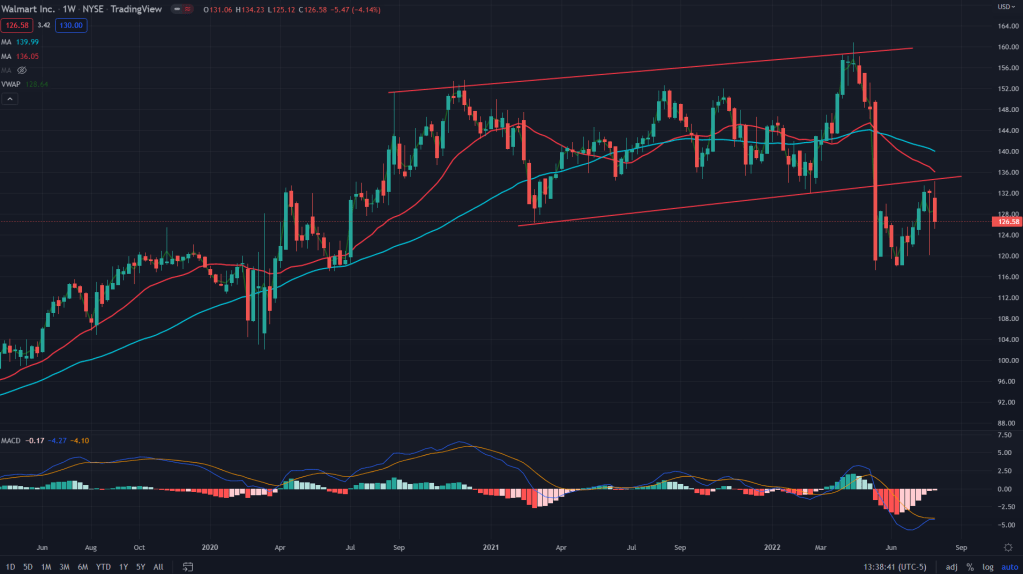
WMT (Weekly): The retail giant broke off a long term channel support, backtested and then sold off again. I would expect the May lows to be retested and perhaps new lows be made in the weeks ahead. I would prefer buying 4-6 weeks out 120/115 put spread.
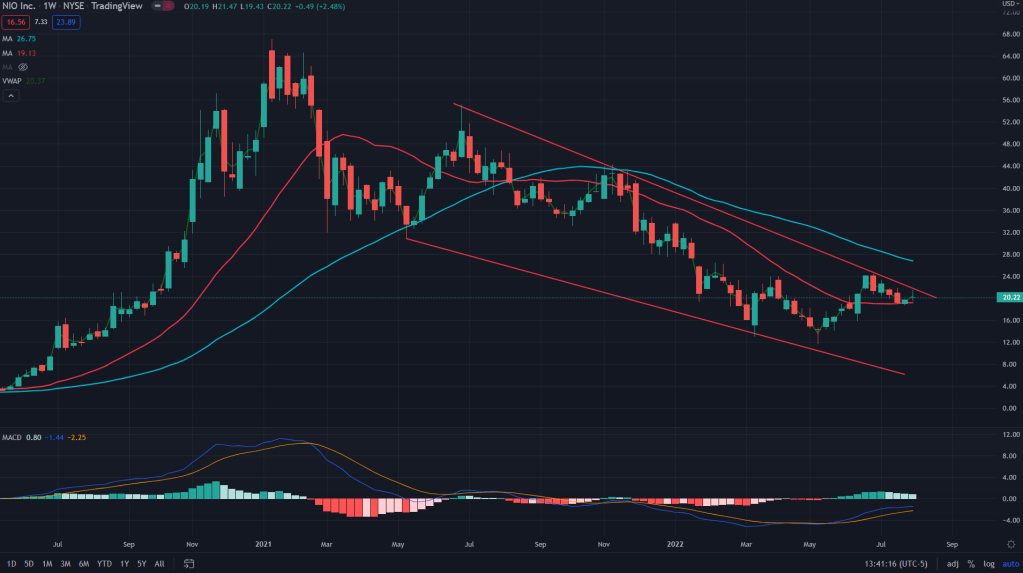
NIO (Weekly): On the verge of breaking out of a ulti-week falling wedge. Given how shaky markets have been, I would prefer the stock to break out before entering a bullish trade on this one.
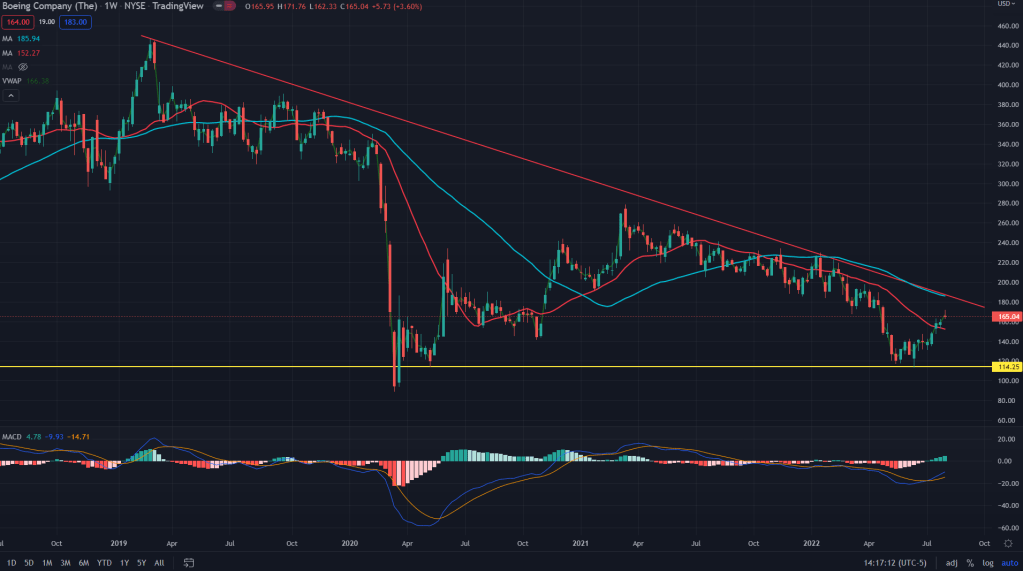
BA (weekly): Descending triangle formation on the weekly chart, once the weekly demand zone of 114 is broken expect the flight to nosedive.
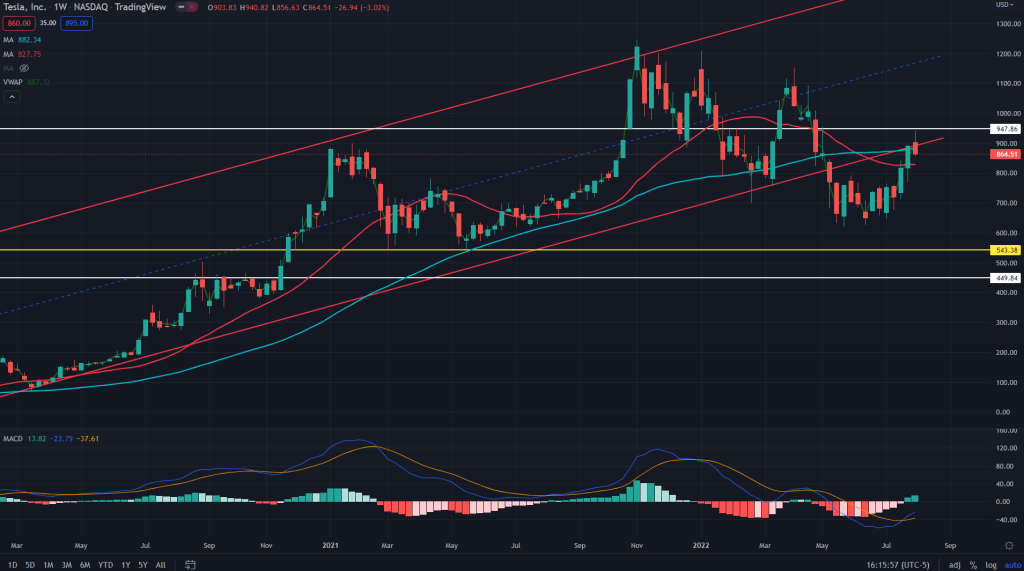
TSLA (Weekly): The EV giant has backtested once broken channel support (now resistance) along with finding sellers at the daily supply line of 947. Prefer selling 2-3 weeks out 900/950 call spread on this one.
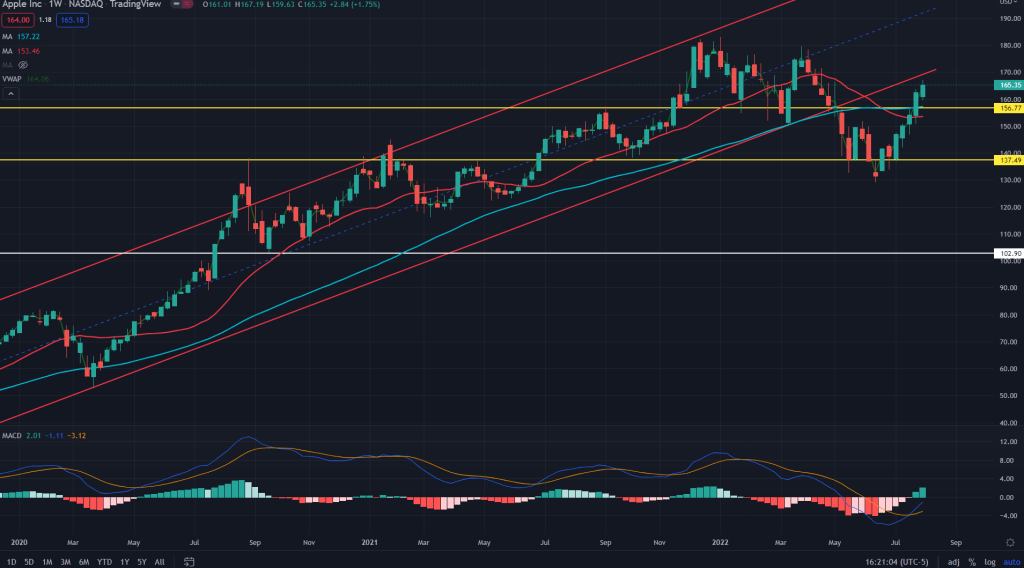
AAPL (Weekly): Yet another backtest of the long term channel resistance that was once broken. Prefer selling 170/175 call spread on this one too.
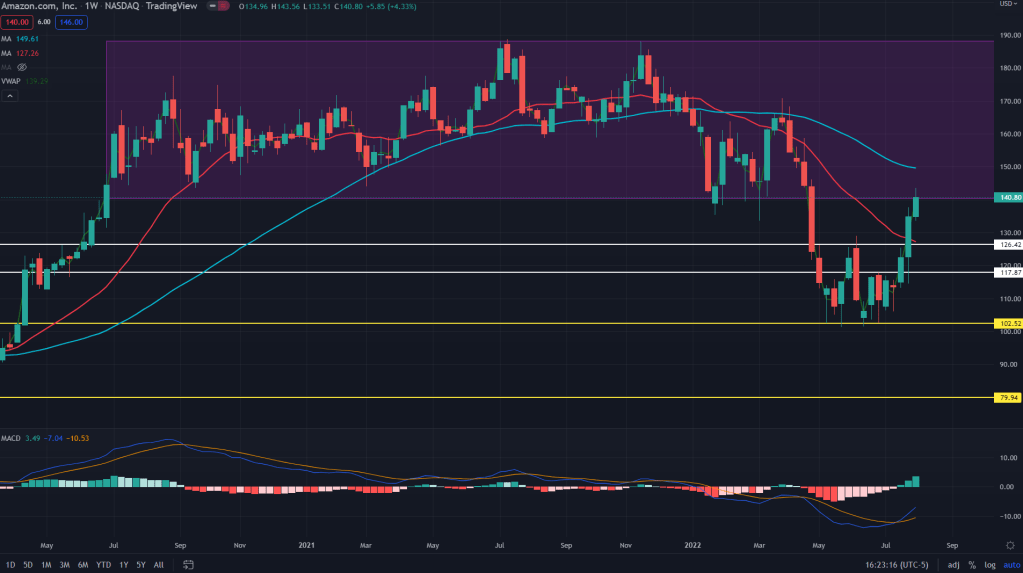
AMZN (Weekly): AMZN, although comfortably crossed past all the daily supply zones, but has now entered into the consolidation zone that defied bulls and bears equally, all through last year. I would expect it to retrace from here towards the daily demand area of 126/117.
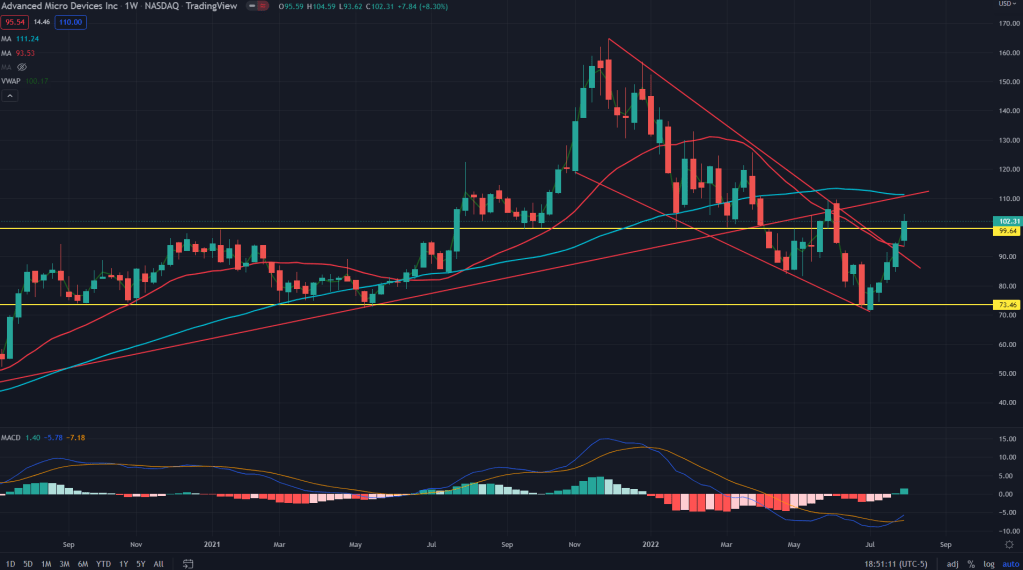
AMD (Weekly): Broken out of a falling wedge on the weekly chart and is now comfortably sitting above the weekly supply too. I would expect the stock to now find resistance around the very trendline it once broke down of – around 110 area.
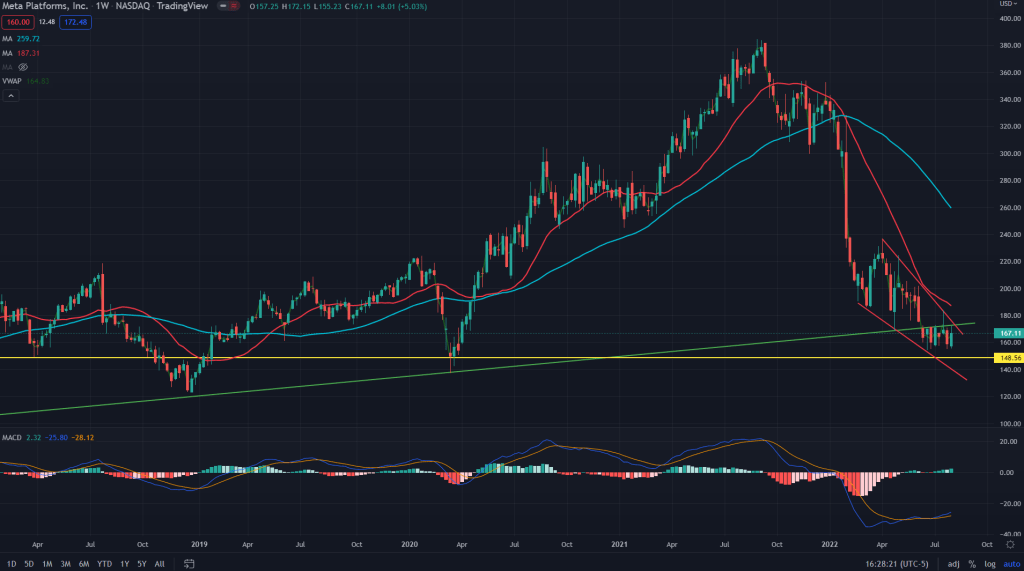
META (Weekly): The social media giant has long been underperforming the market and has been flirting with long term trendline support as well as weekly demand around 148. Although bulls can find solace in the fact that there is a falling wedge forming on the weekly chart and once broken out, it can rally towards 200+ levels. I would wait for the breakout before trading it again.
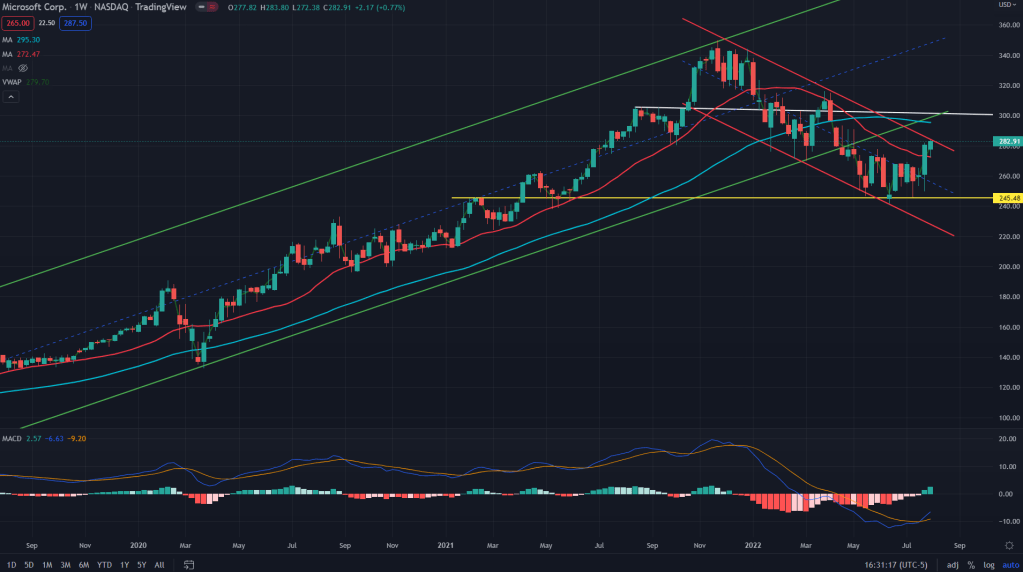
MSFT (Weekly): MSFT is sitting exactly under the weekly channel resistance and just above the weekly 20 SMA. I would expect prices to retrace a bit before its next move.
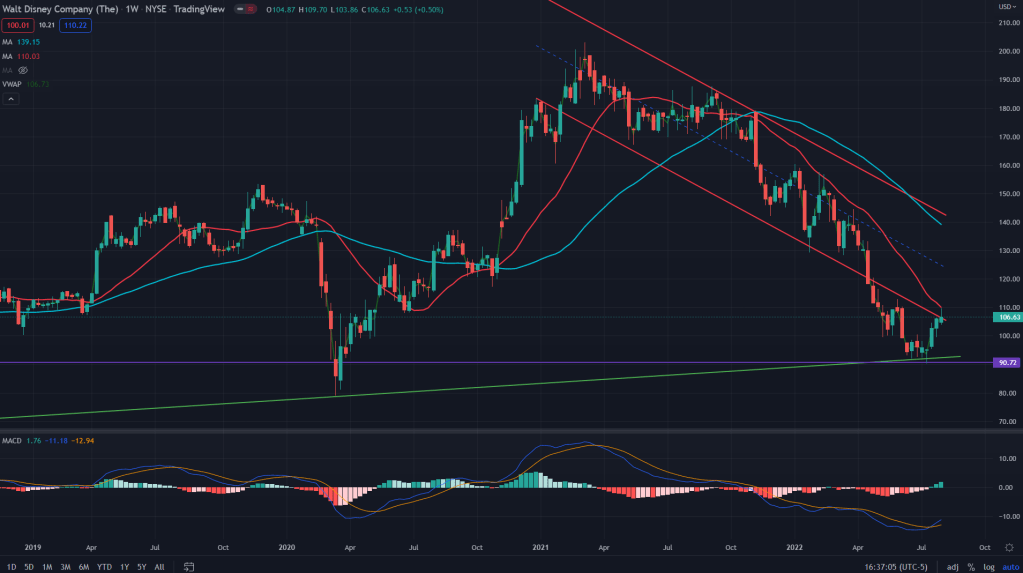
DIS (Weekly): DIS broke down of the long term downward channel and is now backtesting the same. Prefer selling 110/115 call spread.
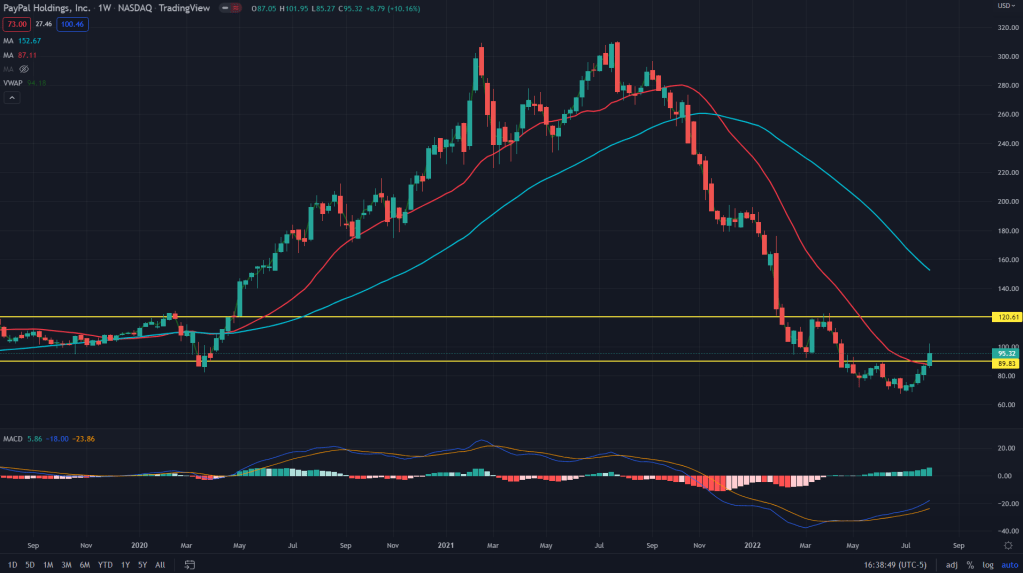
PYPL (Weekly): Although from the surface it looks like a backtest of the weekly demand breakdown. But when you look closely and see positive MACD divergence, you know there is more to this bounce. I would expect bulls to take it all the way upto 120 supply area. Buying 3-4 weeks out 100 calls would be worth the risk here.
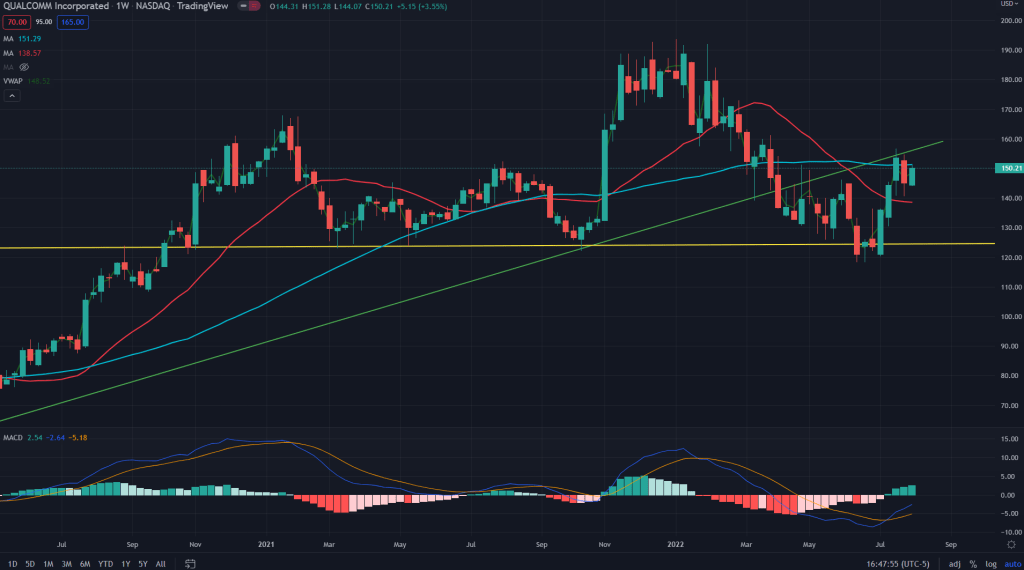
QCOM (Weekly): QCOM is worth the short given that the price has now backtest the long term trendline resistance that was once a support. Although I would wait for a day before venturing a trade in the stock.
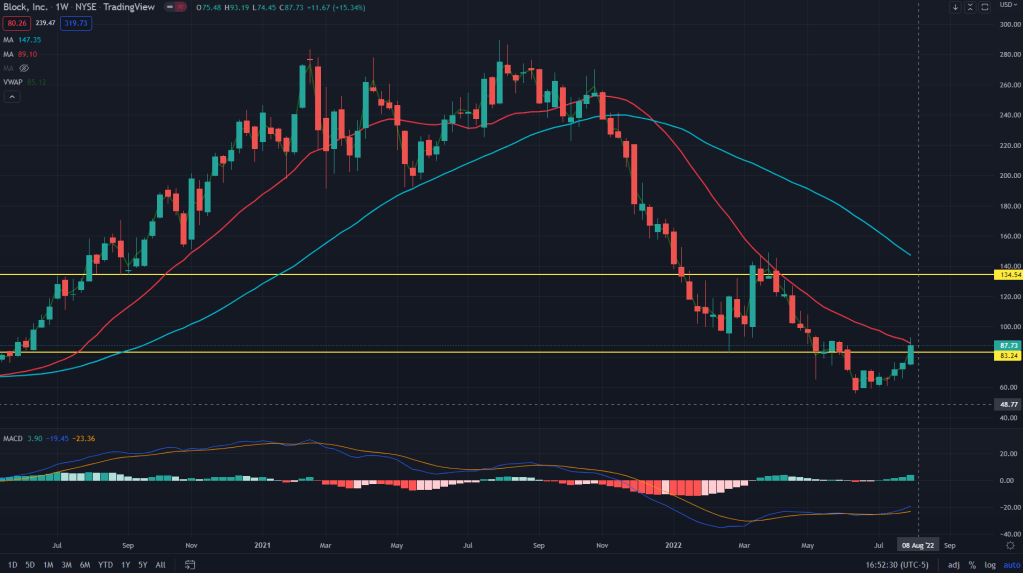
SQ (Weekly): SQ and PYPL have almost always traded identically to each other and this time its no different. Positive MACD divergence along with reclaiming the weekly supply line of 83, gives me confidence to trade bullish on the stock. I would prefer buying 90 strike calls on the stock, 3-4 weeks out.
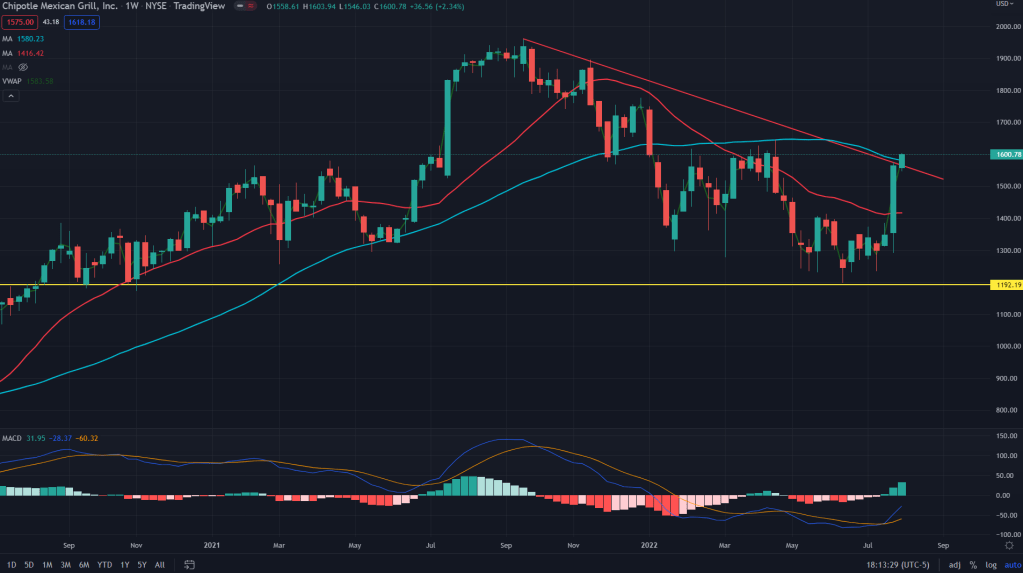
CMG (Weekly): Looks like a breakout to the upside of a descending triangle (very rare), while it is also sitting just above the 50 weeks SMA. I would wait a while before entering a trade here.
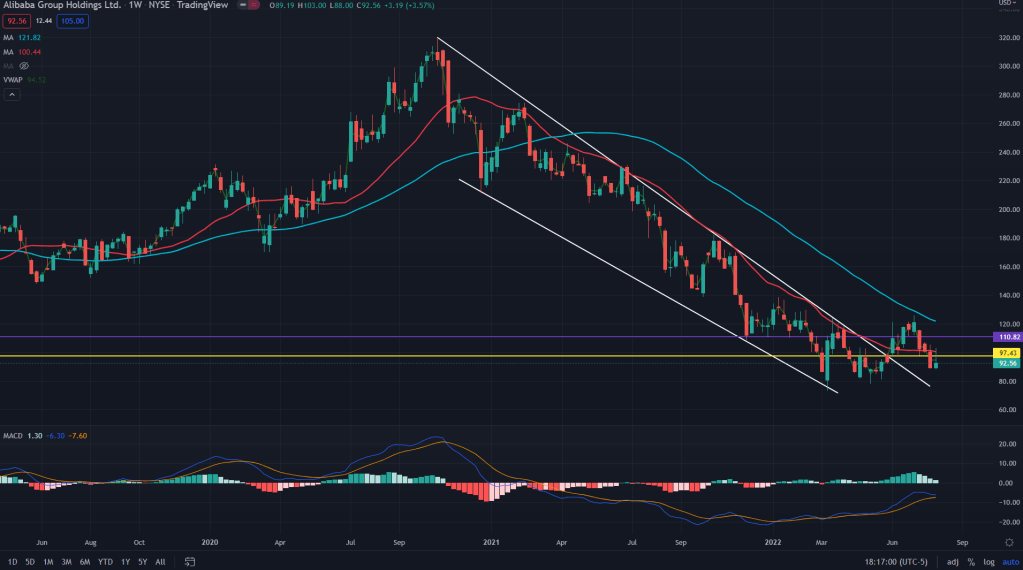
BABA (Weekly): Bulls were excited on this long term breakout on BABA, only to get disappointed as the stock couldn’t sustain monthly supply line of 110 and the weekly 50 SMA. What gives strength to the bears is bearish inverted hammer on the weekly. Prefer buying 90/85 put spread on this one.

Leave a comment