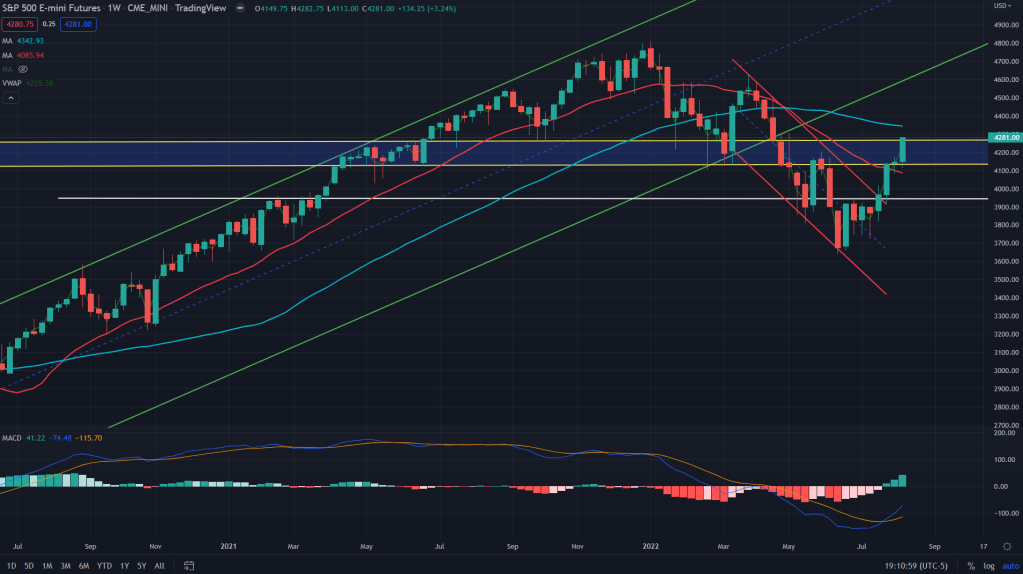
ES (weekly): What a week it was. While we did get a small pullback in the market, but it was quickly bought back without any meaningful trigger the next day. This madness that we are seeing in the market currently is a sign of two kind of markets – One when its euphoric and there can not be any logical explanation to a rally and another is during a bear market rally wherein we just see sharp bounces without actually having a reason to assign to it. We certainly know its not a euphoria and hence it gets easier to explain that its a bear market rally.
Given that it indeed is a bear market rally, how far can it go and if we have to see markets tanking again, then how and when? Focusing purely on the charts, I would expect markets to top out somewhere between the current levels (4281) and the 50 weeks MA (4343) with some 40-50 points as a room for fake breakout. Till then, I won’t be a buyer of ES in this market. The only reason I believe markets can top out right away is that the ES is still about 15-20 points away from the weekly supply zone of 4265 as shown in the chart and just as there are no reasons for the rally, there won’t be any warning before this sell-off. It would just be.
And when we look at the daily charts, 4325 is where 200 MA comes into play that could provide enough resistance for the bears to show up.
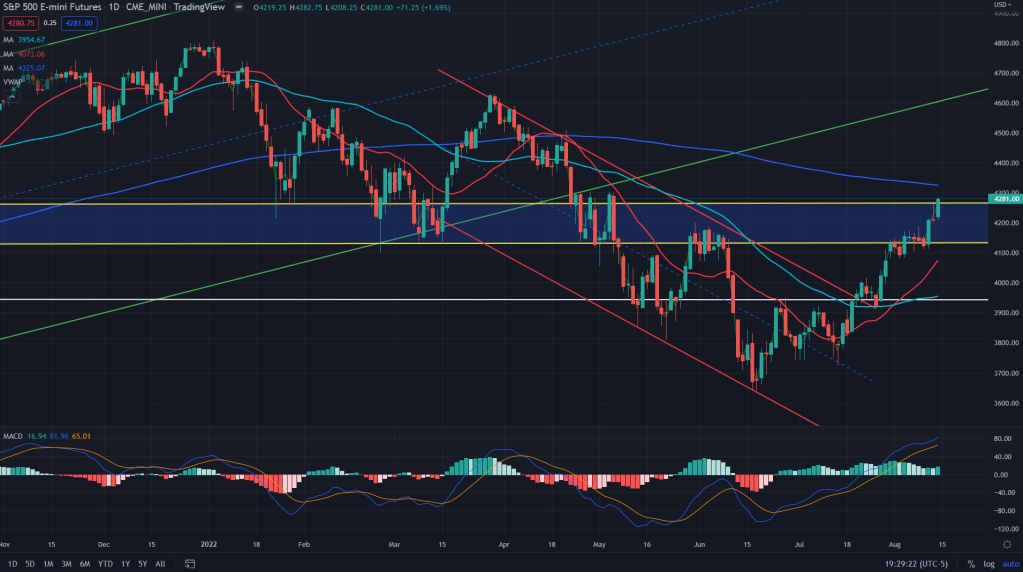
ES conclusion: I would attempt my shorts between 200 days MA (4325) and the 50 weesks MA (4341). Although won’t be aggressive on the ES just yet.
NQ (Weekly): When markets topped out back in November last year, the sell-off was led by tech stocks and if we have to look for any signs of markets topping out this time too, look no further than the tech stocks and the benchmark NQ. Its sitting just under the keey trendline channel resistance of 13,700 where bears have a good enough chance to attack the bulls. Along with two more key moving averages right above – 200 days MA at 14,059 and 50 weeks MA at 14,228. I would bet on the 50 weeks MA as the key resistance before markets top out. Although yes, small selling opportunity is right there at the channel resistance of 13,700 where we can expect small pullback and then rally again.
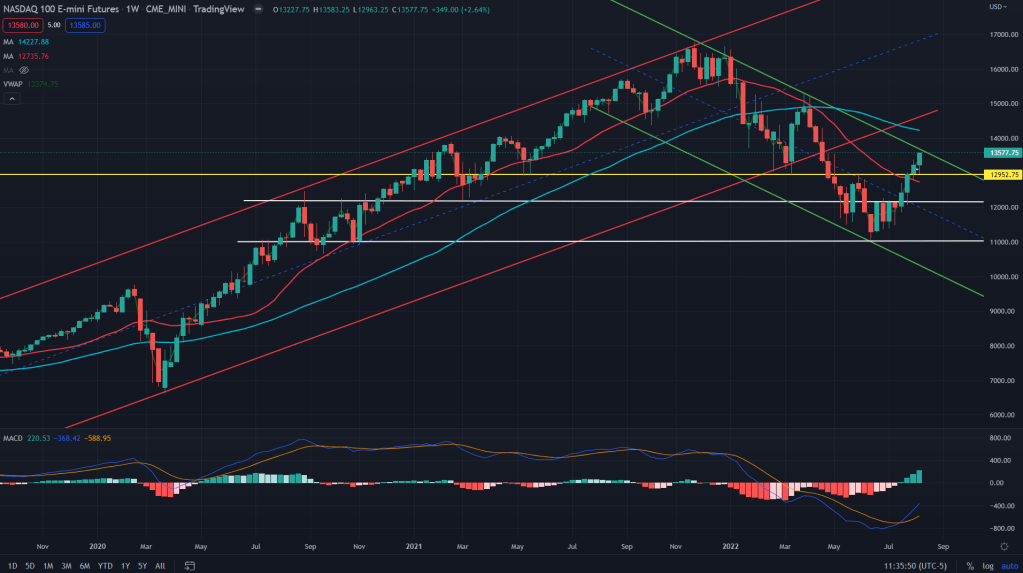
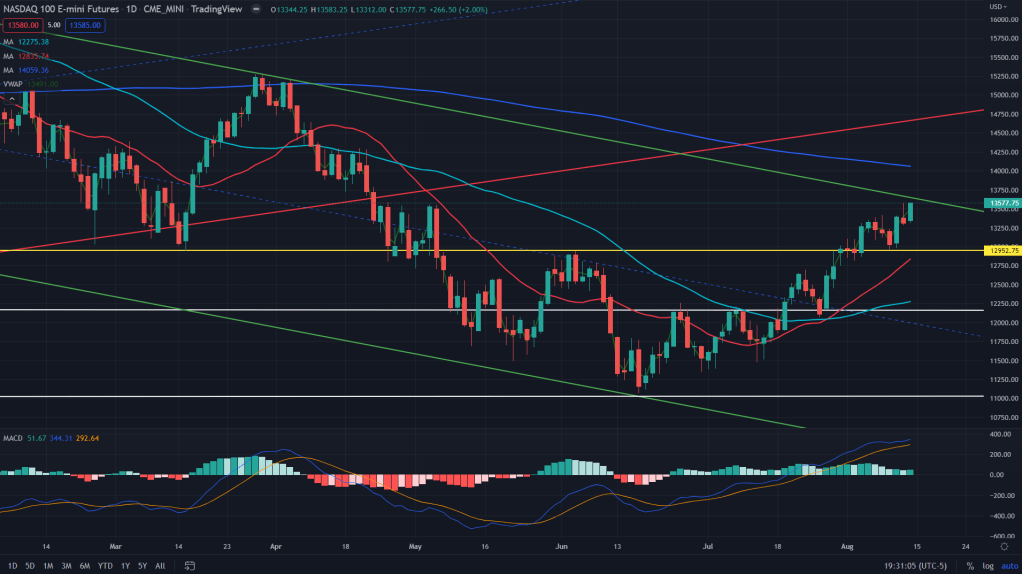
NQ conclusion: Small short can be attempted as trading bet around in the range of 13600-13700 although actual sell-off may not happen before 200 days MA (14059) and 50 weeks MA (14228). I would start my aggressive shorting only once NQ touches 200 days MA.
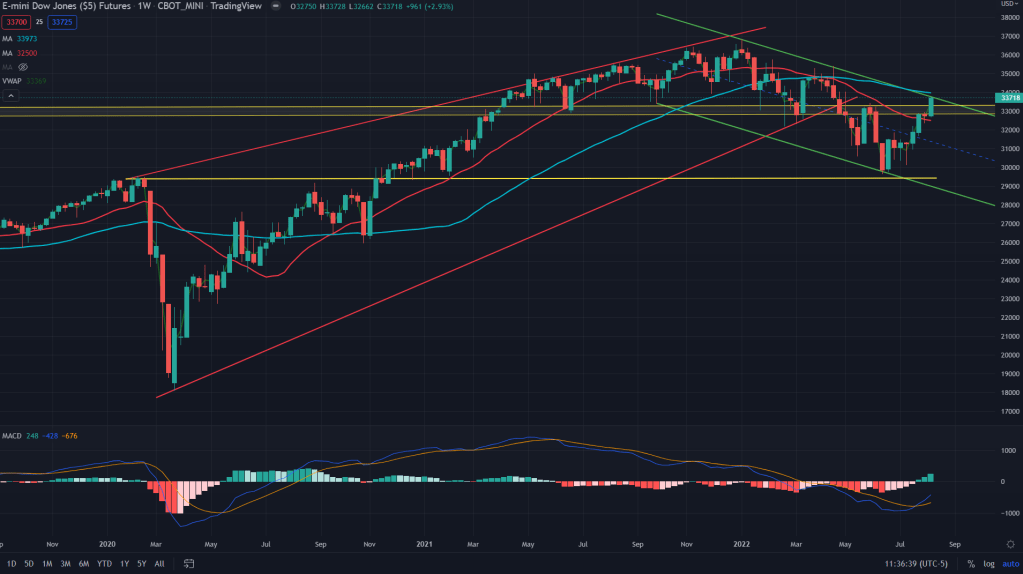
YM (Weekly): Even the Dow Jones Industrial index future is sitting right under the channel resistance drawn from its all time highs and just above is 50 weeks MA at 33,973 and right there is also its 200 days MA at 33834.
YM (Daily):
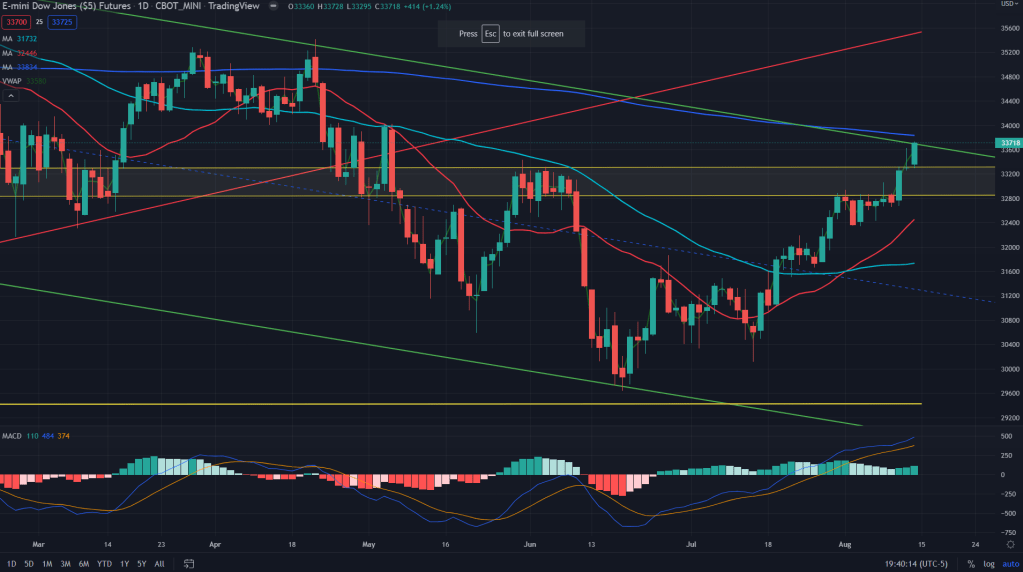
YM conclusion: I would prefer shorting the YM right here and add more on the rallies as and when I see negative MACD divergence on the daily, which is still missing.
RTY (weekly): While this was one of the underpeformers earlier, has now becoe outperformer of last week. Given the relative strength of small caps, there would still be some steam left before bulls throw in the towel and I would expect RTY to resume its downtrend swomehere from around the 50 weeks MA – 2047. Although 200 days MA is right here where it closed on Friday – 2011 and prices normally do go farther than 200 MA before catering.
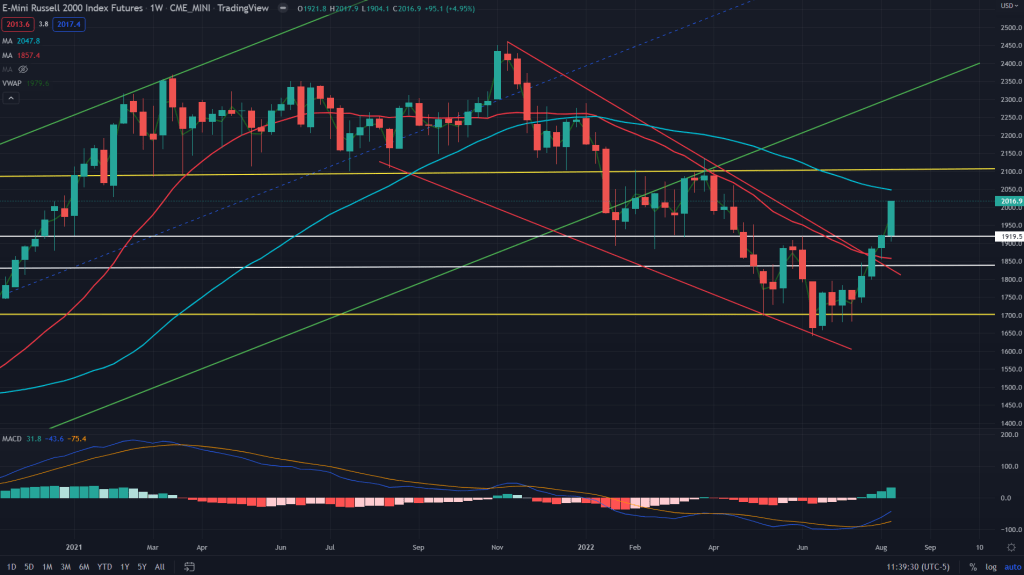
RTY conclusion: Selling between here and the 50 weeks MA and would add more when MACD diverges on the daily, which might take all of August before actual bear market resumes.

Leave a comment