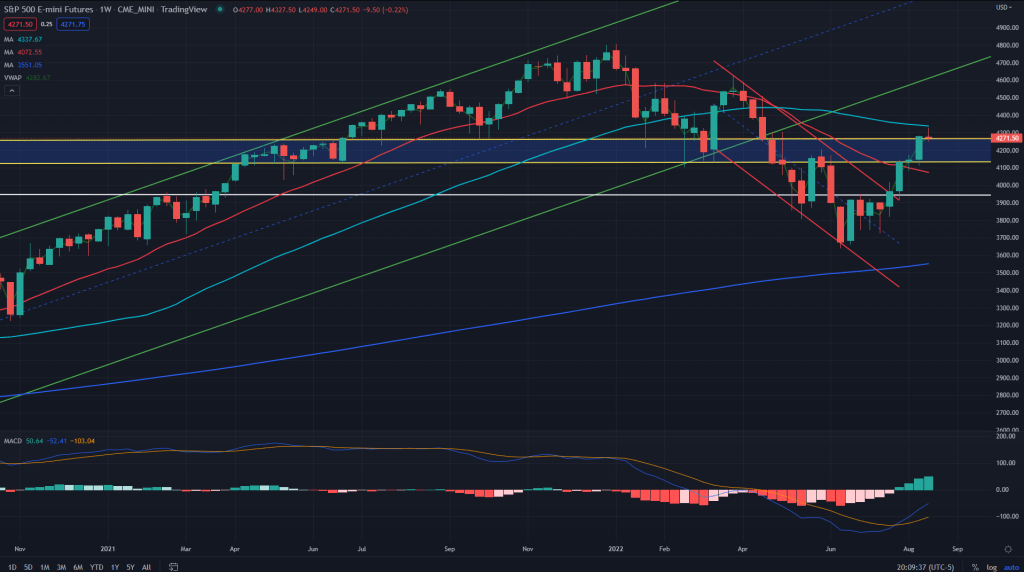
ES (Weekly): As posted in the last post over the weekend, 50 weeks MA and 200 Days MA both proving to be a good enough resistance for now and as long as both these key MAs are not crossed, we can safely assume that the top for this leg is in place and I would expect ES to retrace upto 20SMA to start with. There is still a very slim chance, however, that that we may still make a new high within next 2 weeks while MACD diverges negatively. In that case, the sell-off would be far more sharper and brutal. 4080 is the line in the sand for the bulls, which shouldn’t be broken for any hopes of new highs to be kept alive.
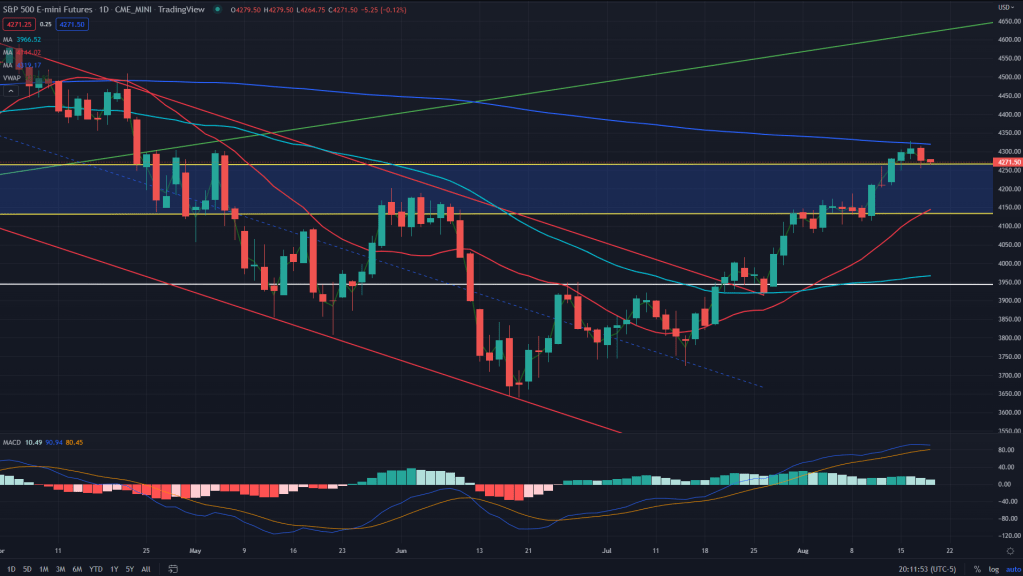
ES (Daily):
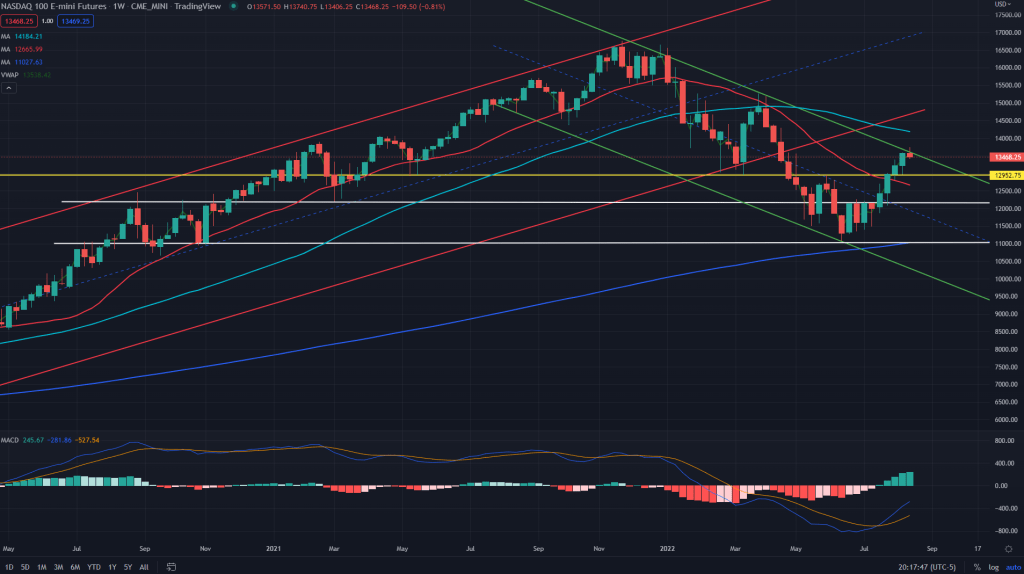
NQ (Weekly): While NQ couldn’t even reach 50 weeks MA or the 200 DMA, it found stiff resistance from the downward sloping channnel that has been plaguing it since the ATHs of last year. 12650 is the line in the sand for the tech bulls.
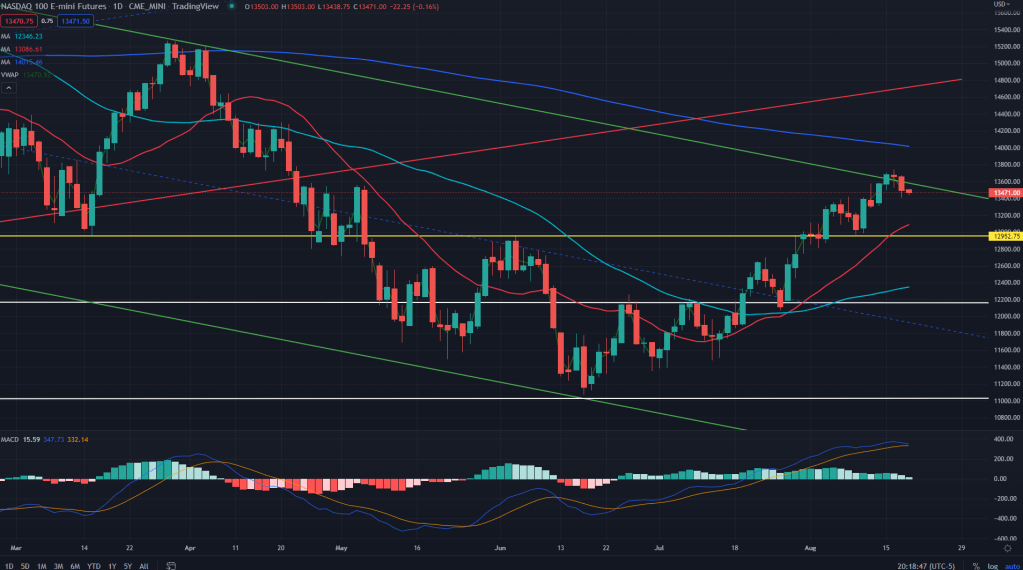
NQ (Daily):
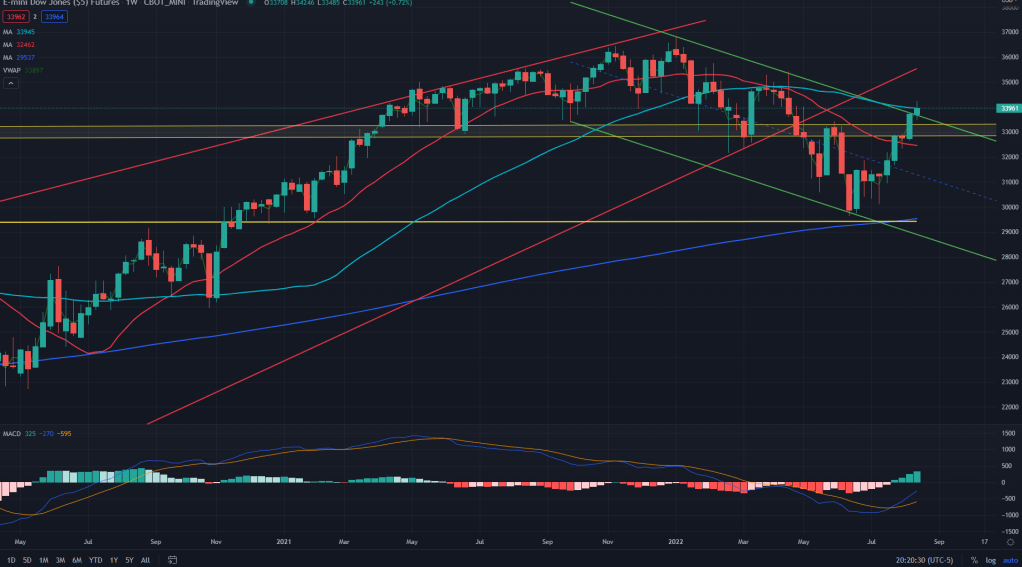
YM (Weekly): The only major index that could cross past its 50 weeks MA and the 200 DMA this week. Although it is struggling to hold above those key levels so far and also lies beneath are 2 key levels – downward sloping channel support (earlier resistance) and the weekly demand (earlier supply and now weak). I would expect these levels to be broken by the end of this week. Key level for the Dow Jones bulls is 32200.
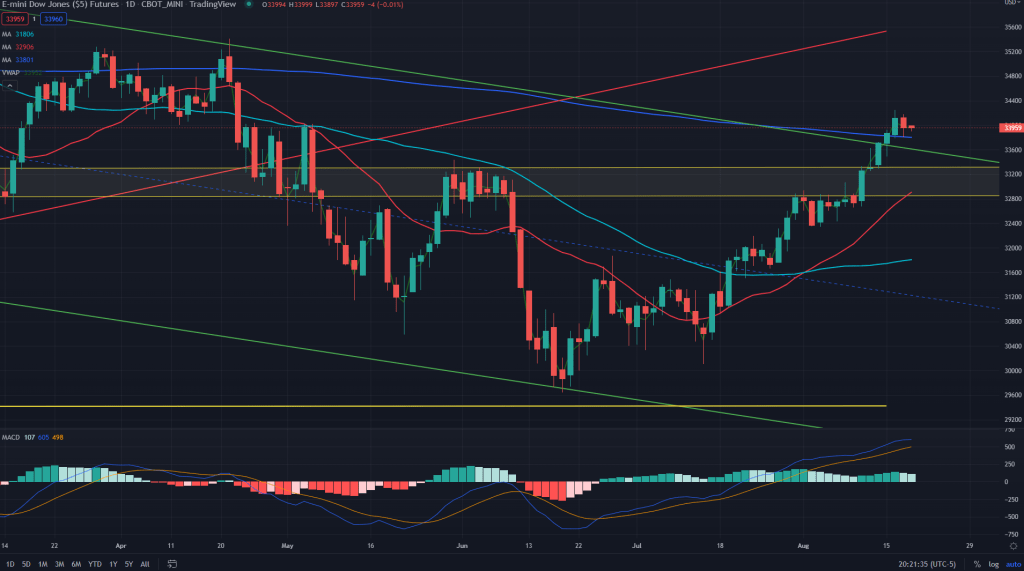
YM (Daily):
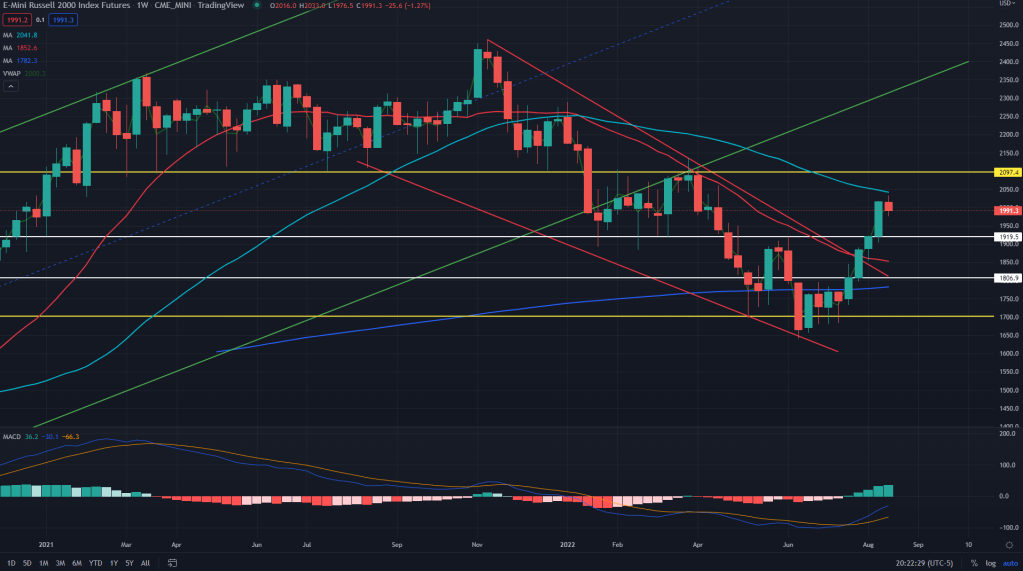
RTY (Weekly): RTY too couldn’t cross past its 50 weeks MA, although the bulls had managed to take it past its 200 days MA, but as mentioned last weekend, it is quite common to see minor crossovers of the 200 DMA before prices crater. 1880 would be the must hold level for the bulls to remain alive in the game.
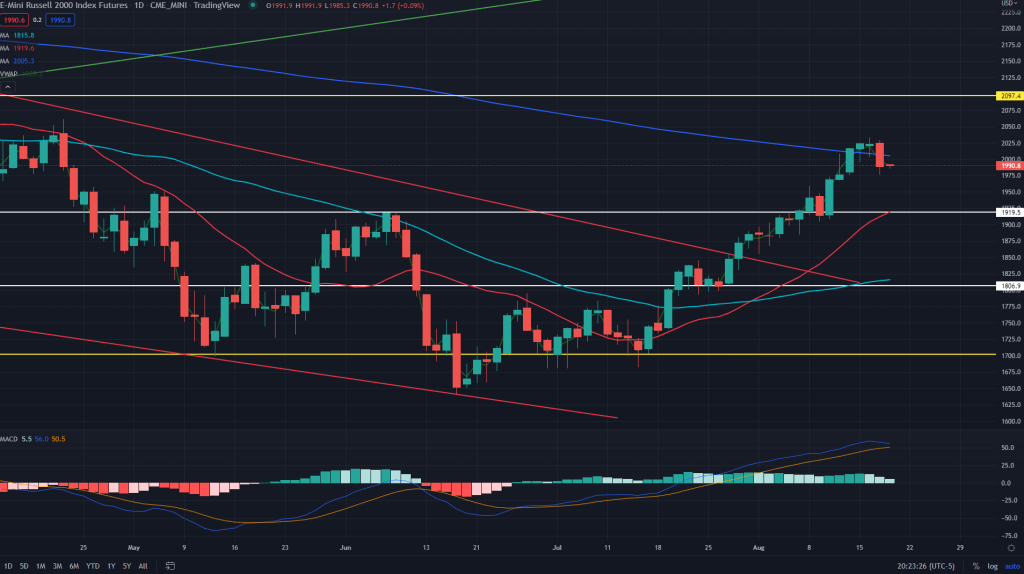
RTY (Daily):

Leave a comment