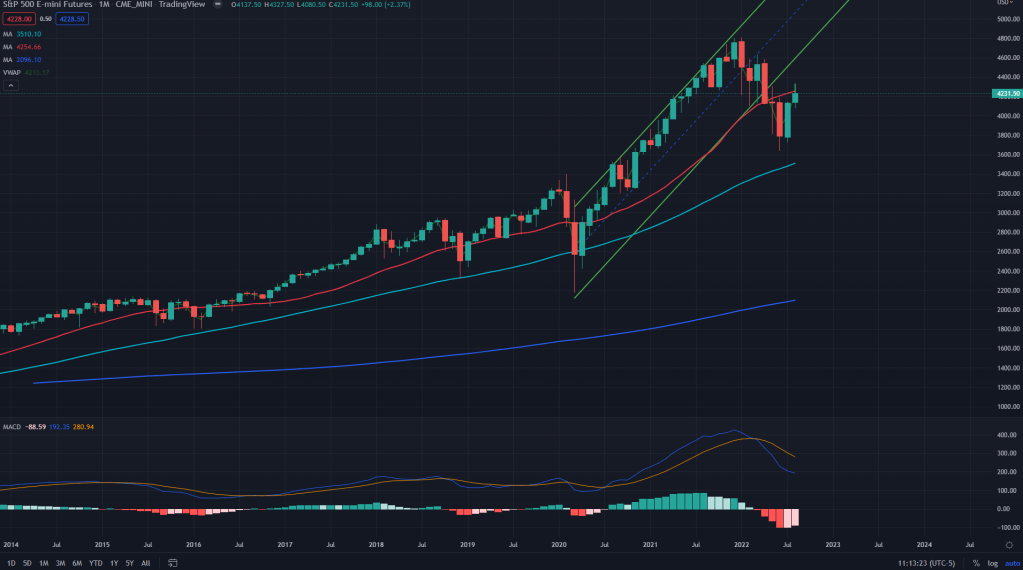
ES (Monthly): For long I have been talking about how the weekly time frame is something that has been driving markets ever since we topped out last year. While that still is true, but when we zoom out further and look at what monthly charts are showing us, it seems there is more to this game that didn’t seem to be clear earlier.
ES is now well below 20 months SMA and seems to have backtested long term channel breakdown of earlier this year. Also, the downside momentum of this bear market has still not died down as visible on the MACD and I would expect new lows to ensue in the coming months.
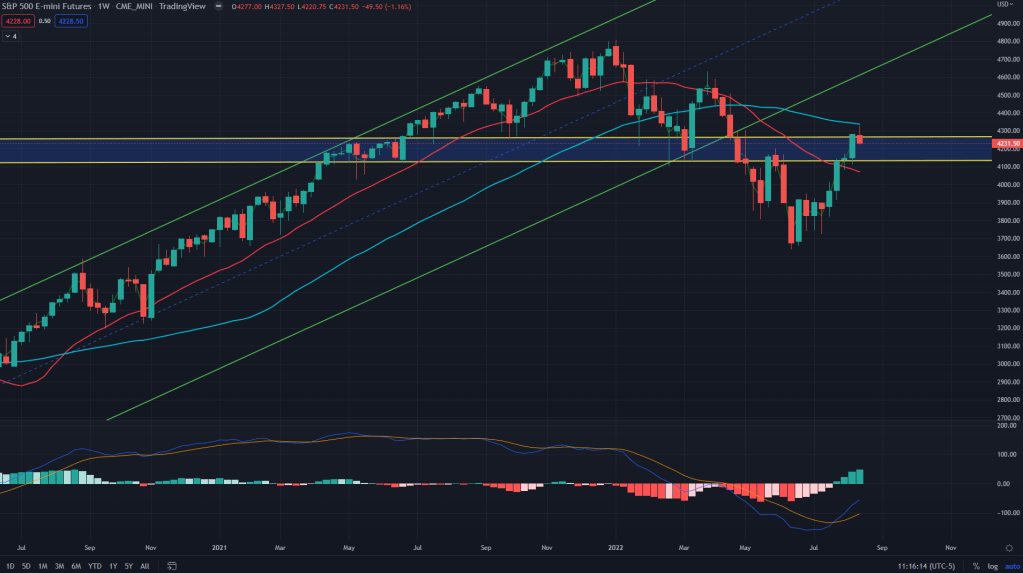
ES (Weekly): On the weekly too, the ES has failed to cross past the 50 weeks SMA and is now back below the demand line of 4270, classic failed breakout.
ES (Daily): Immediate critical support for the bulls would be managing to hold on to daily 20SMA, currently at 4158.
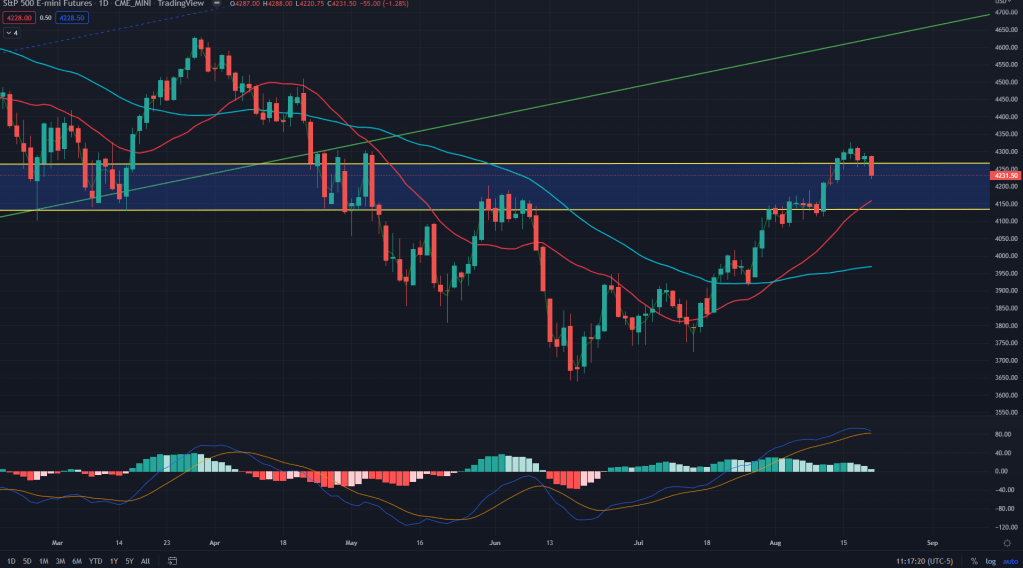
ES conclusion: Monthly and weekly MAs rejection is not a co-incident along with backtesting of long term channel breakdown. While we continue to hold our shorts (As posted on twitter earlier this week), key development would be when bears continue to throw the price below key levels without any hesitation. Those key levels would be the 20 SMA on the daily (4158 for now) and 4130 (weekly demand line). The monthly closing for August would be watched closely.
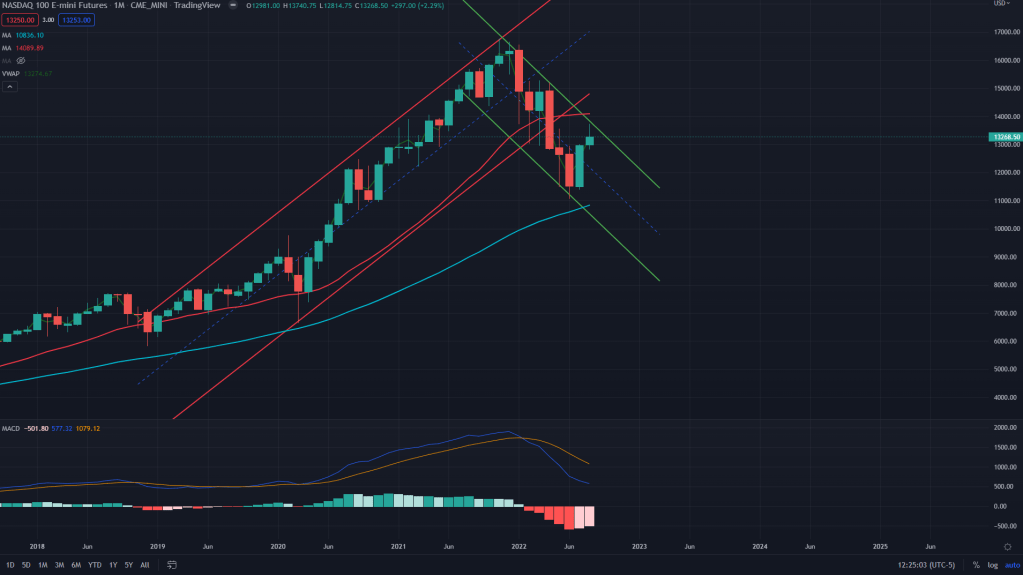
NQ (Monthly): As mentioned in the last week’s post, this bear market was driven by tech stocks and whatever happens to the NQ is of great sigfnificance. Bulls’ inability to even touch 20 months’ MA and rejection off the long term downward trending line is a good enough sign for the bears to come back with full force.
NQ (Weekly): Even on the weekly, bulls couldn’t even touch 50 weeks MA and we are now staring at the weekly demand line of 12950, once broke, we are surely headed towards the new lows on the tech stocks.
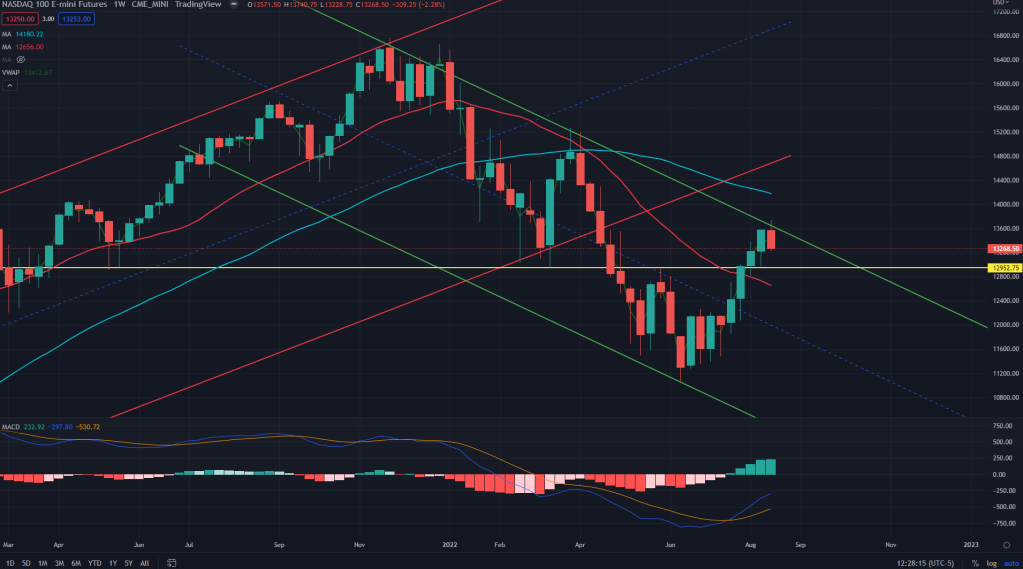
NQ (Daily): Bulls, however have their last hopes pinned on the daily 20 SMA.
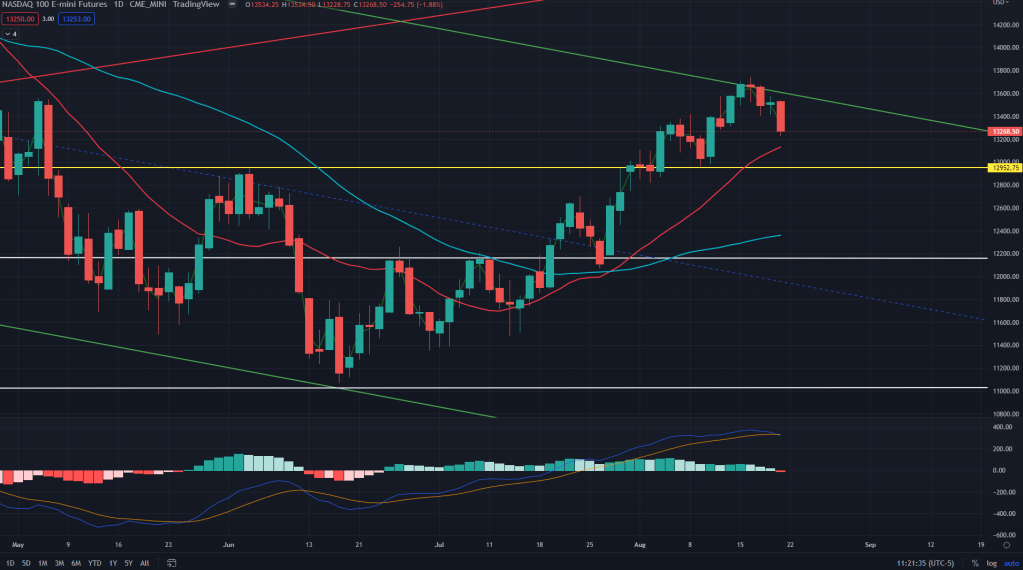
NQ conclusion: Since prices are now driven by the monthly chart, as its clearly visible, I wouldn’t be surprised to see the 20 SMA on the daily gives up in no time in the coming week. Buying Septmeber QQQ puts or buying bear call spreads would be quite a money spinner in the times ahead.
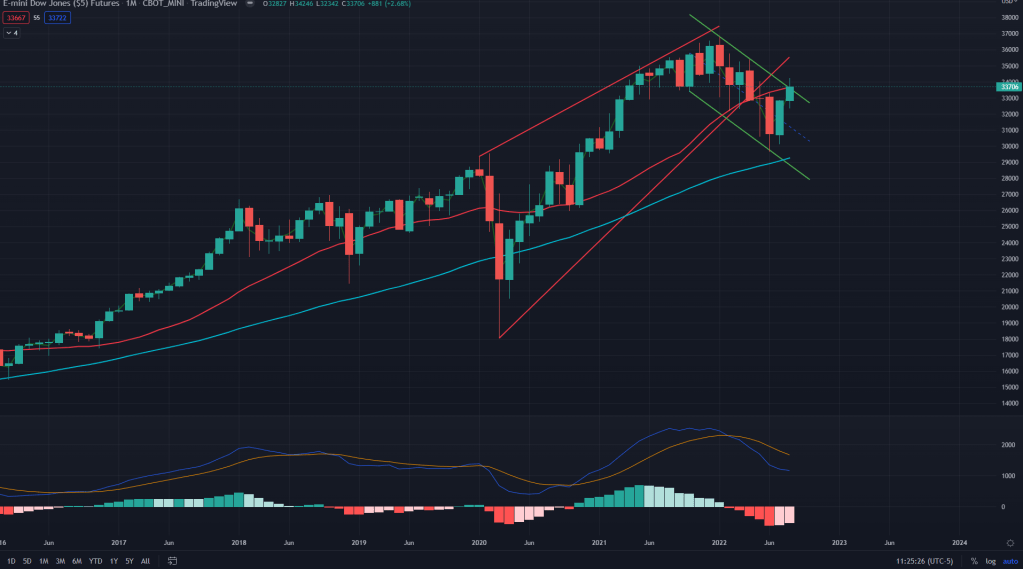
YM (Monthly): Yet another monthly chart has yet another revelation for us – rejected off the 20 months’ SMA ad backtested long term rising wedge breakdown. What lies ahead is painful journey to the pits once we cross past few levels as posted below on the weekly and daily charts.
YM (Weekly): On the weekly too, it has not been able to sustain past the 50 weeks MA and closed with a bearish gravestone doji formation for the last week. Weekly demand zone of 33,300 – 32800 is now key for the bulls to pin their hopes on. I won’t be bullish though.
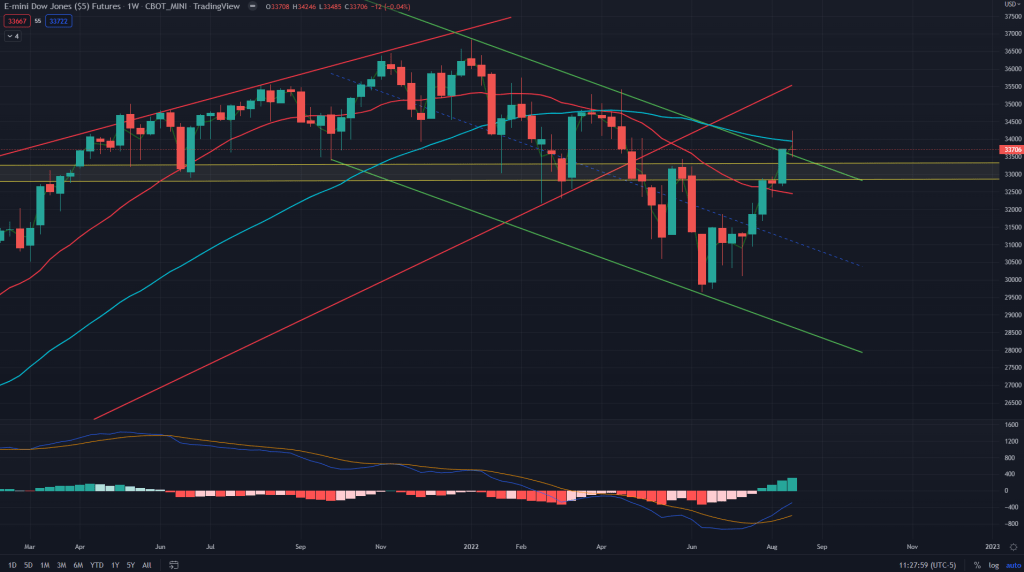
YM (Daily): Bulls have their hopes in the form of weekly demand zone (33300-32800) and the 20 SMA on the daily (32999 currently).
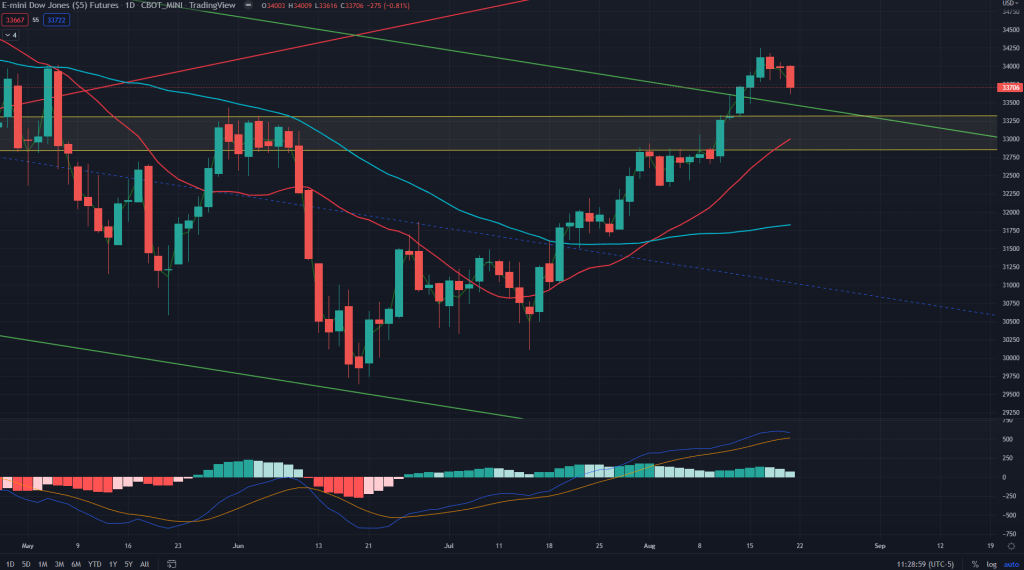
YM conclusion: YM has not participated much in the previous rally, nor has it followed NQ and ES as much on the downside. One key reason being the fact that it is formed of industrial and cyclical stocks and in the last 12 months, those stocks have been outperforming (thanks to the commodities supercylce). Although, the signs are all bearish, but being short NQ and ES would be far more profitable as against the YM.
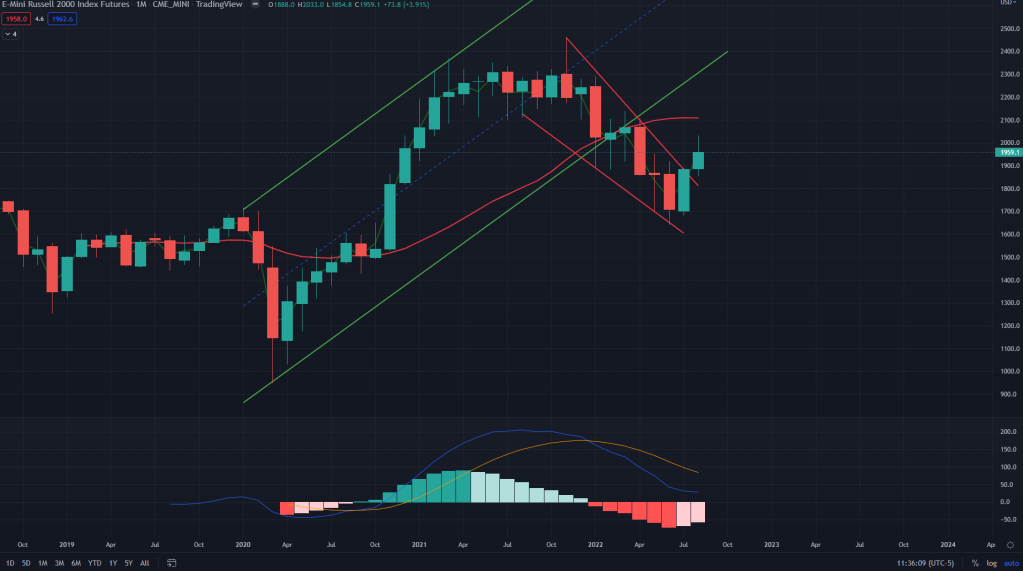
RTY (Monthly): Just like NQ, even the small cap index hasn’t been abl to reach its 20 months SMA after breaking past the weekly falling wedge. I would suspect this breakout to be backtested and failing to hold the backtest.
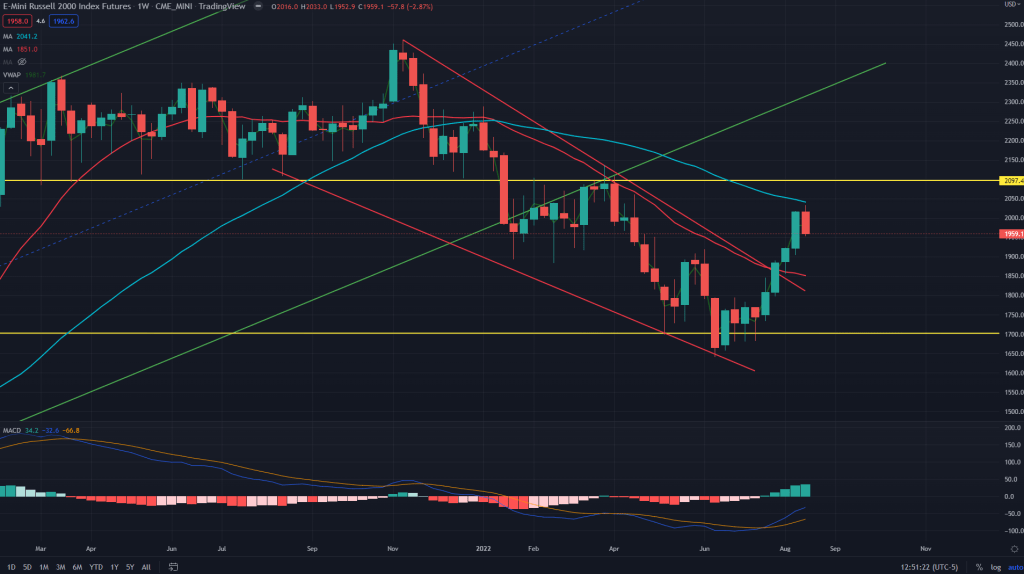
RTY (Weekly): On the weekly, it followed similar path like others – unable to cross past the 50 weeks MA and now headed lower.
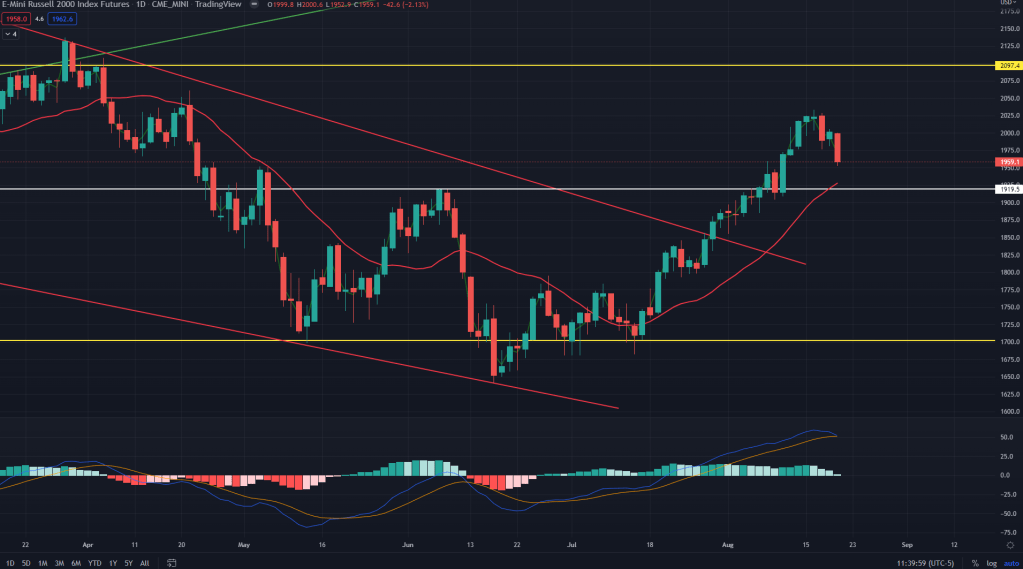
RTY (Daily): Bulls have their hopes pinned on the daily demand line of 1920 and 20 SMA currently at 1927.
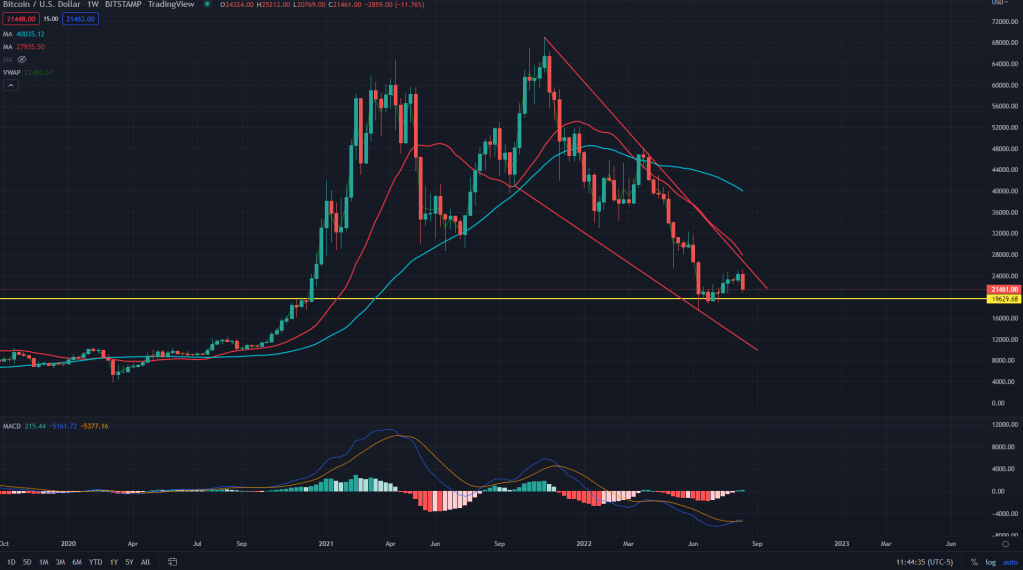
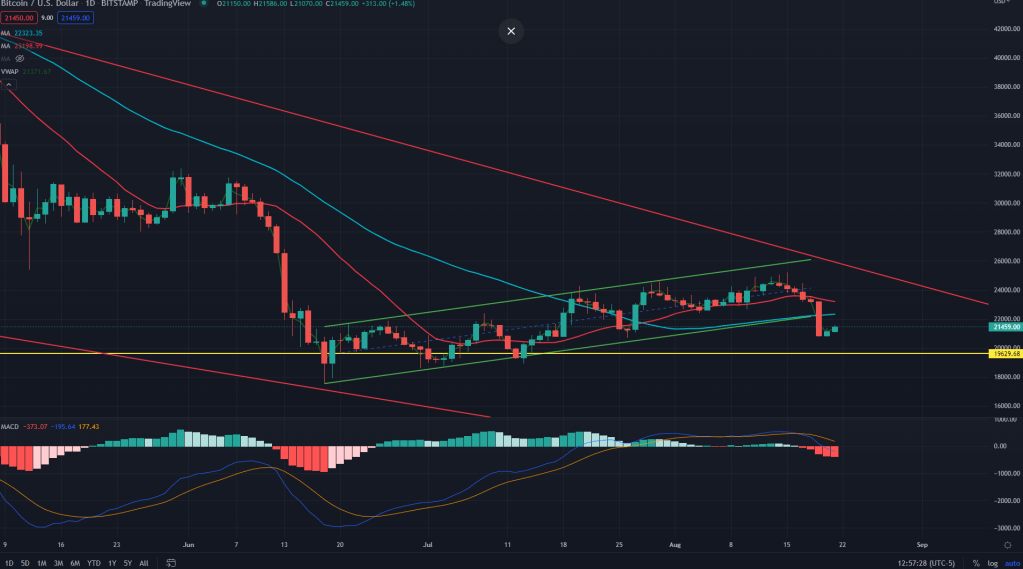
Bonus update – BTC (Weekly): As posted on twitter, Bitcoin has broken down off the bear flag on the daily chart that’s been forming ever since the June low and is also rejected off the upper trendline of this weekly falling wedge. What lies ahead if the weekly demand line of 19630. I would expect new lows in the coming weeks for the Bitcoin before it starts resepcting the falling wedge for the upside.
BTC daily:
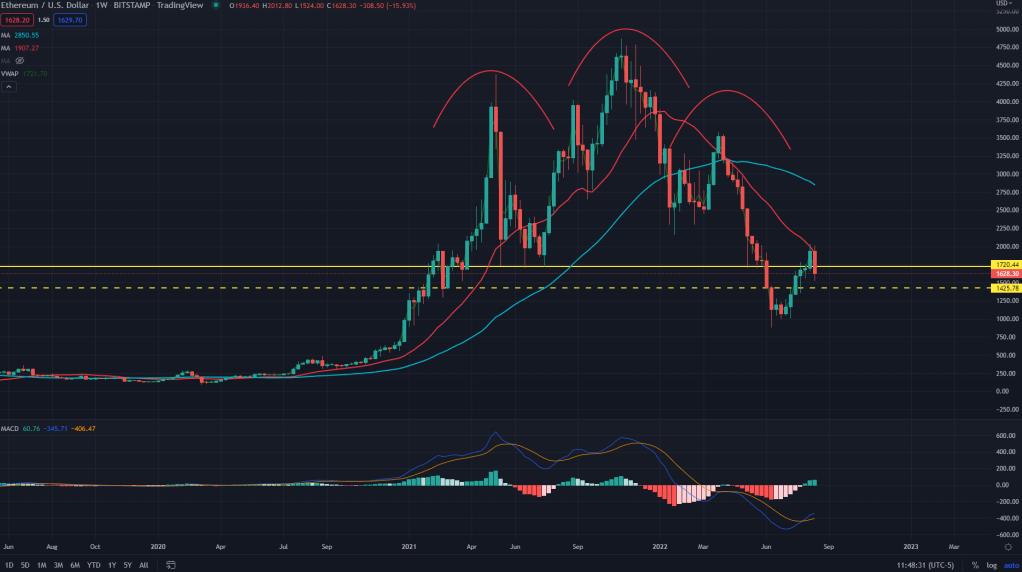
ETH (Weekly): Ethereum has backtested its H&S breakdown on the weekly chart and is well below the shoulder line (And the weekly demand line) of 1720. 1425 lies next in the form of anothe demand line and the new lows after that.
KEY NOTE: The views above posted based on the monthly chart may change based on how we close the month of August and hence following the price matters more than predicting it.

Leave a comment