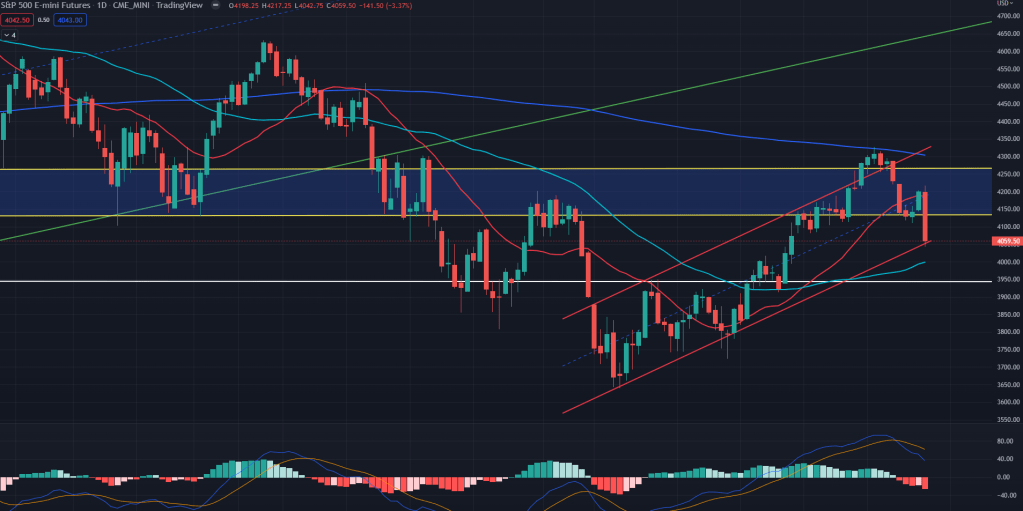
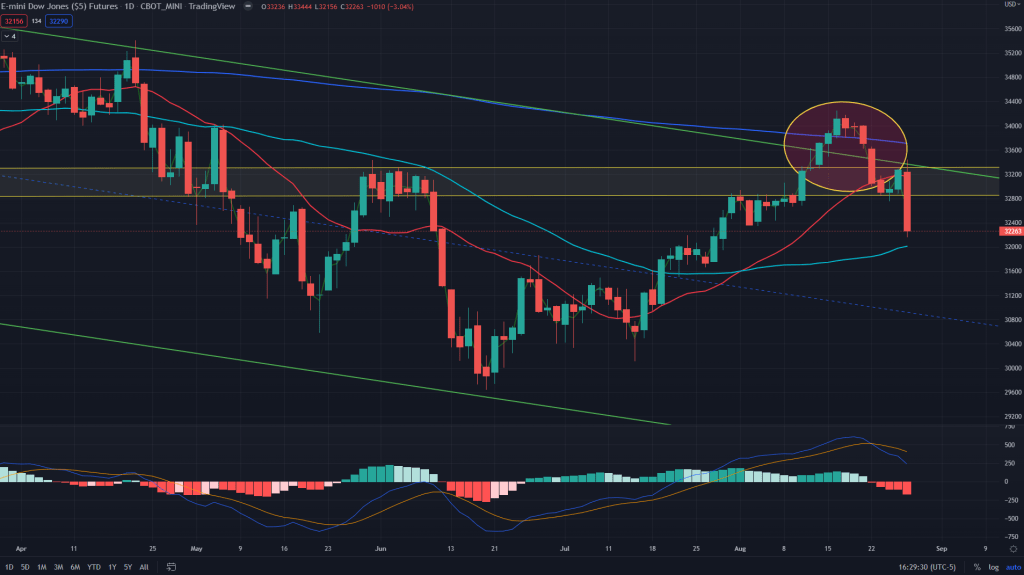
ES (Daily): As mentioned in the post last week, markets finally have done what was expected – reversed from the critical levels on all time frames. 200 DMA on the daily has proven to be a good enough resistance for the bears to attack.
ES (Weekly): Along with the 50 weeks MA. Resulting into ES giving up all key critical demand zones and I won’t be surprised if we see the lows of June to be retested in the coming days.
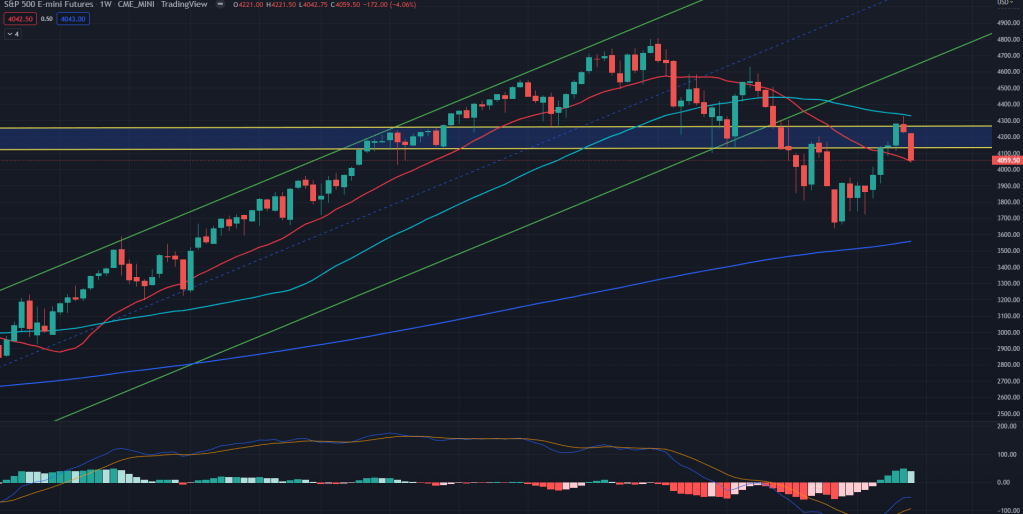
ES conclusion: Stay short and if not already, any bounce should be used to create short position as I expect ES to break June lows of 3639 and create new lows somewhere around 3500.
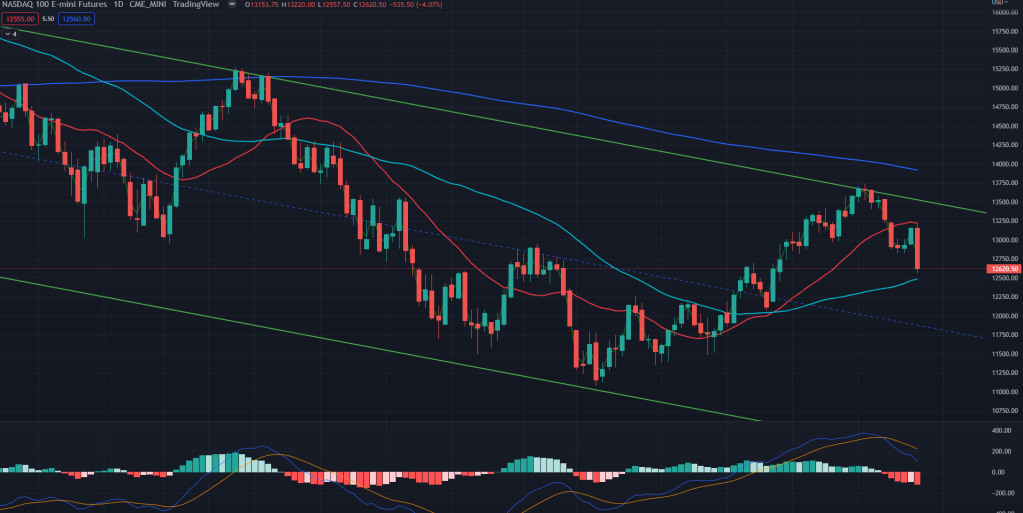
NQ (Daily): The reversal on the NQ has been far more outstanding than the other indexes. It reversed exactly from the key downward channel trendline resistance on the daily and then broke 20 SMA too without any fuss.
NQ (Weekly): It did not even try reaching out to 50 weeks MA on the weekly chart and now staring at 20 SMA of the weekly after breaking key demand zone on the weekly – typical fake breakout yet again.
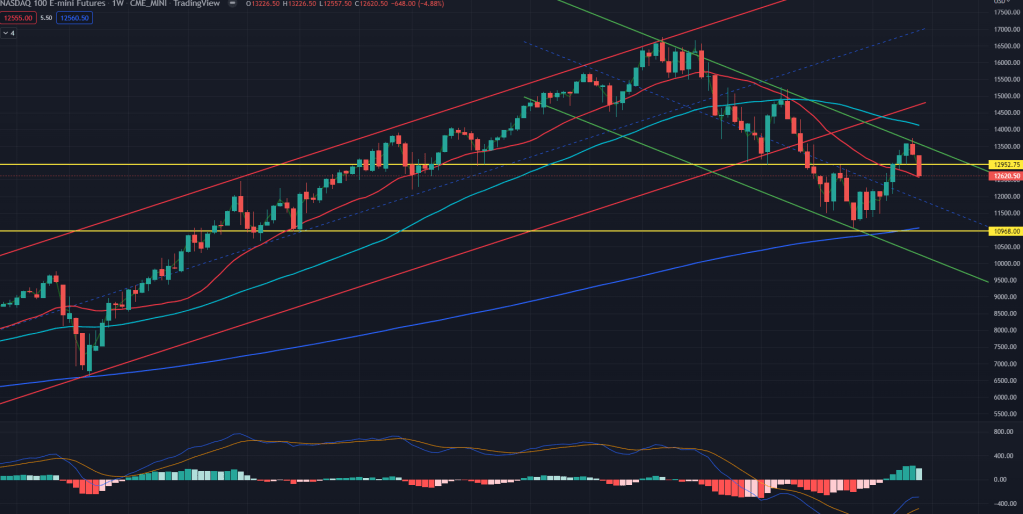
NQ conclusion: I would expect NQ to crack far more deeply than the other key indexes and June lows of 11068 won’t hold in this next round. All bounces are a selling opportunity.
YM (Daily): Even YM has shown a typical fake breakout – Breaking past 200 DMA and key weekly supply zone, only to reverse again. And all it has to do is now break below 50 days SMA. Not big task after that big reversal of last week.
YM (weekly): On the weekly, it couldn’t sustain past 50 weeks MA as posted in the last update and now already below 20 weeks MA too. Here too, new lows are on the horizon.
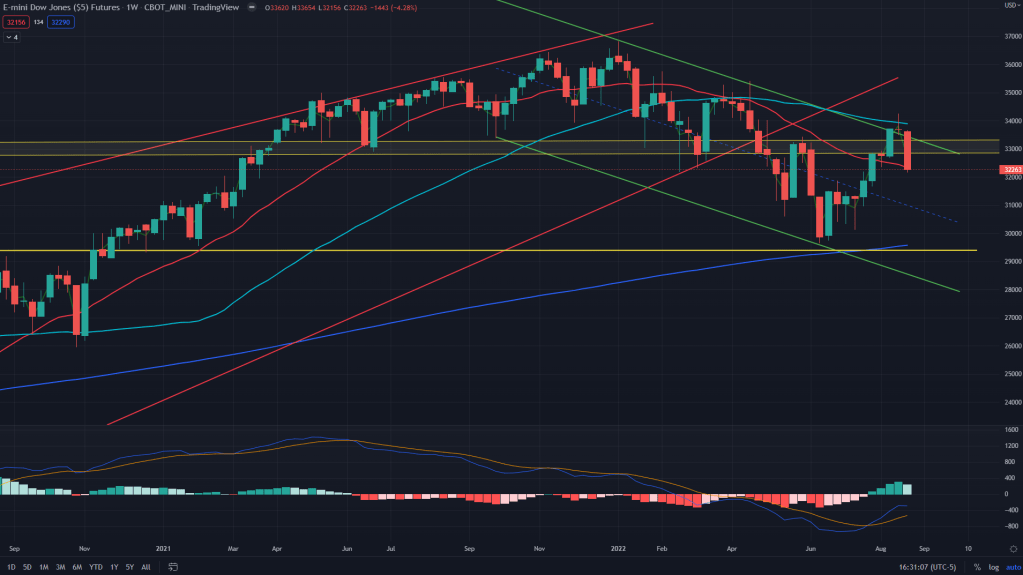
YM conclusion: Key demand line of 29400 is where it may try to show a brave face, but I won’t be surprised to see it cracking past it to make a deeper new low for the YM.
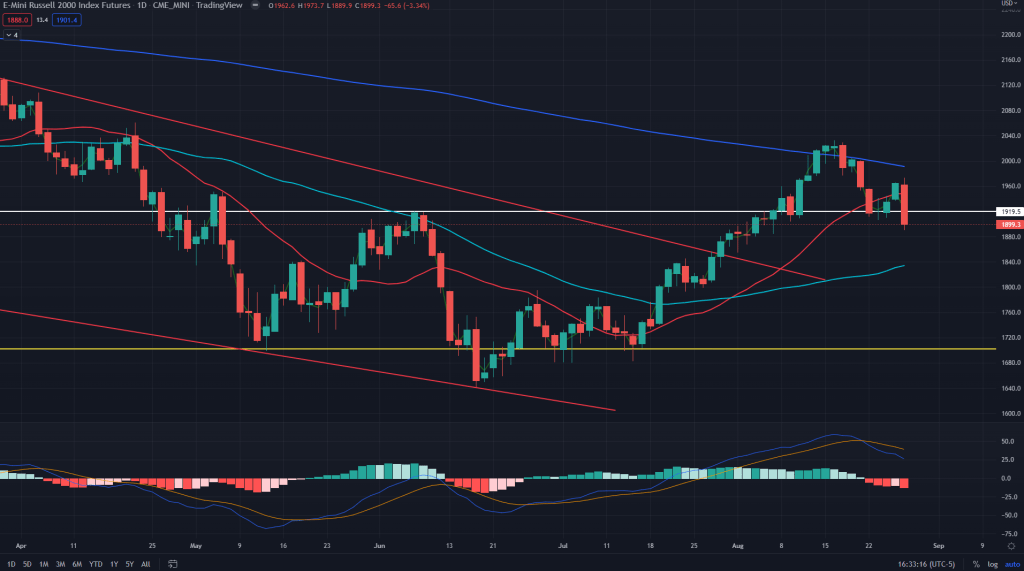
RTY (Daily): Reversing exactly from the 200 days MA and now below the daily demand line and 20 days SMA. After NQ, I expect RTY to fall deeper than other key indexes.
RTY (Weekly): On the weekly too, it has reversed from the 50 weeks MA and now some confluence of supports are staring in the form of previously broken out falling wedge’s upper line support, 20 weeks MA and 200 weeks MA. It would only be a matter of time before all of it gives up.
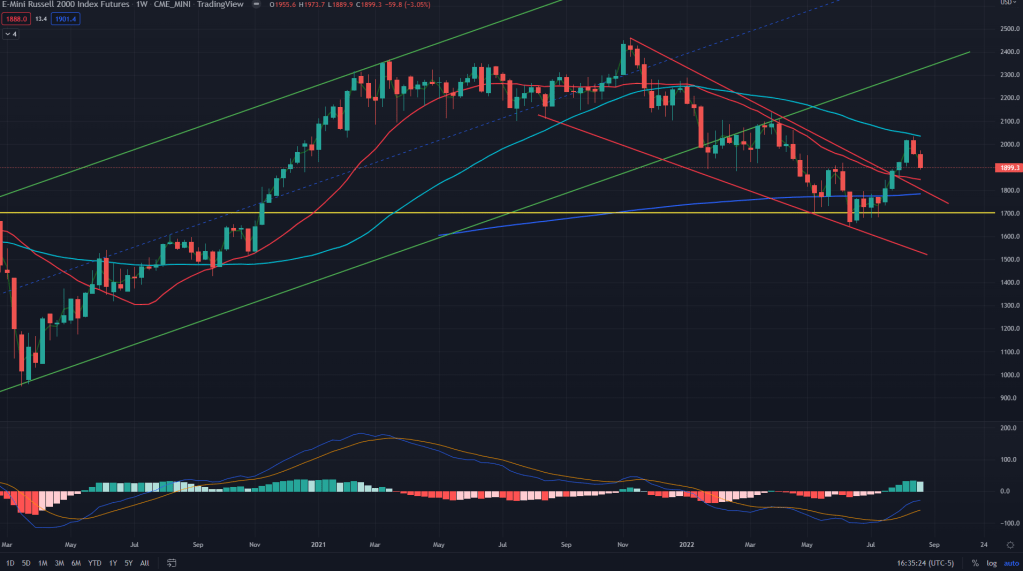
RTY conclusion: Fake breakout (of falling wedge) reversal on the cards with new lows not far off. Yet again, all rallies are a shorting opportunity for a new low towards sub 1600.

Leave a comment