Market is a beats of collective minds and emotions of all the traders, investors combined and all you can do is follow what it shows you. While I was bearish in my last weekend’s post that made me conform to the bias that we are headed into the new lows, lower than 3600, when market is about to change its course, you better be on watch.
As I have mentioned earlier as well, there is no point in having a bias in the market because that makes you fixated to a particular view and when tide turns, it hits you the hardest.
This mid-week update, I would start with my view on currencies, mainly EUR and the USD and then we’ll talk about the futures.
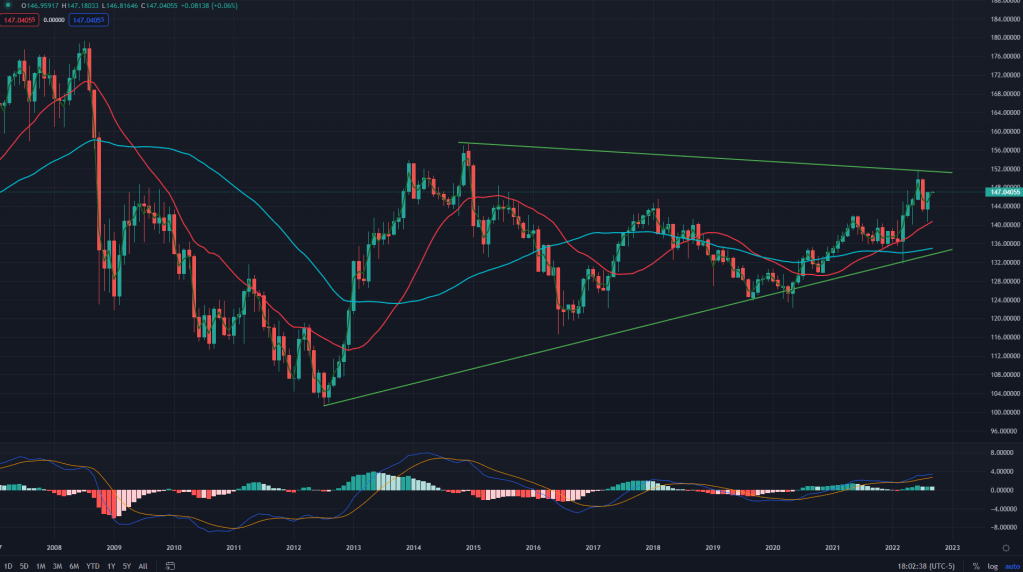
Starting with the EUR first (Monthly): For the last few days I have been watching charts of EUR and GBP quite closely, I was tilting towards GBP heading for a bigger rally in the times ahead but its the EUR that has surprised me. First we take a look at the monthly chart of an equal weighted EUR chart and what you get is an ascending triangle awaiting its breakout. Not far behind. But as always, nothing goes up or down in a straight line and when we talk about monthly charts, each candle represents a month and it could well be a month or two more before it breaks out.
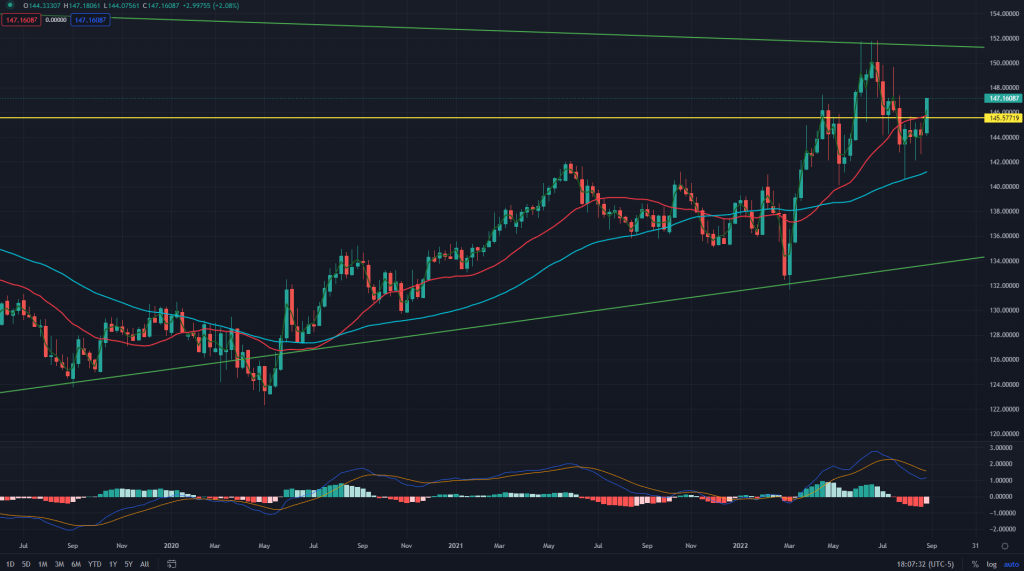
EUR (Weekly): The move of last few days has occured with a force that has broken past the weekly supply line of 145.57, along with crossing past the 20 weeks MA. While, the news from the Europe has been going from bad to worse with the ongoing energy crisis, it was a no brainer which way it was headed and yet when you look at the equal weighted EUR chart, you see a different story as against what you see on the standalone EUR/USD price which has been on a southward journey all along.
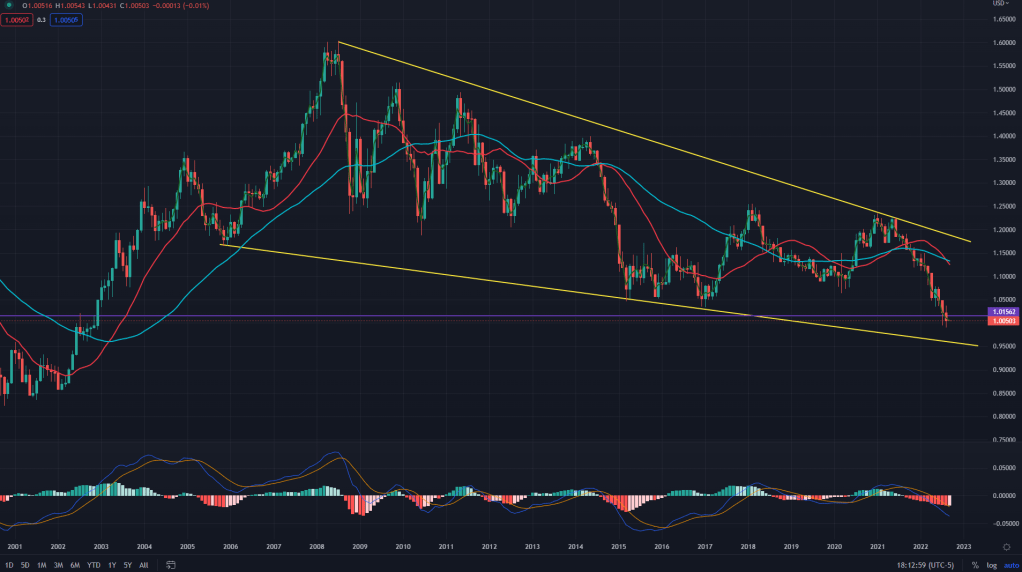
EUR/USD (Monthly): Here’s a view on the monthly EUR/USD chart that tells us what is happenig with the currency pair. It has been on a journey to the South ever since peaking out in 2008, post GFC era. What has been more depressing off late is the breakdown of the monthly supply line of 1.015. Yet when we take a closer look, it is forming a multi-year falling wedge which is probably on the verge of completion (may take few more months before it start peaking). I would only try and guess that it may show a brave face around 0.95 odd levels which is lower end of this falling wedge and then make a U-turn here, or probably sooner if the equal weighted EUR inded has its way.
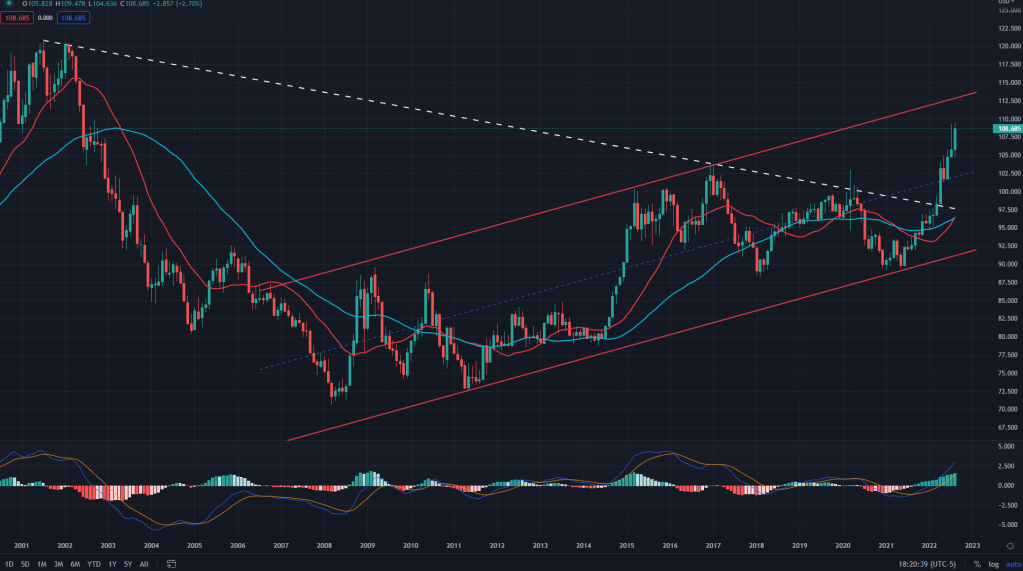
DXY – Dollar Index (Monthly): EUR has more than 50% weight in the DXY index and hence whatever happens with EUR, has a large bearing on the DXY index as well. Here’s a quick view of the DXY monthly chart which tells us it has definitely not peaked but the risk rewards are not comfortable for the bulls here to be long. Probably 112-113 is where it could max out along with bottoming of the EUR/USD. Remember, EUR/USD is conversely correlated with DXY because of the way it is paired.
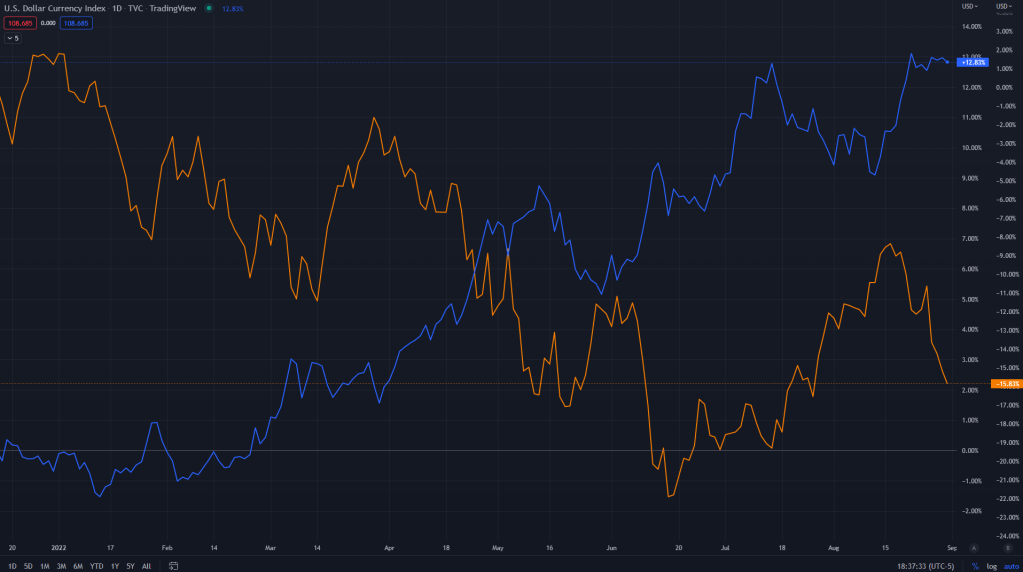
And now, here’s a chart that shows comparison between DXY and ES all through this year – And it seems clear that the dollar’s rally somehow has co-incided with the correction/bear market in the ES where ES has fallen about 17% through the year and DXY has risen about 14% in 2022. That can not be just a co-incident. It tells us that investors have been parking their money in the dollar as a safe haven while they pulled their money from the stocks.
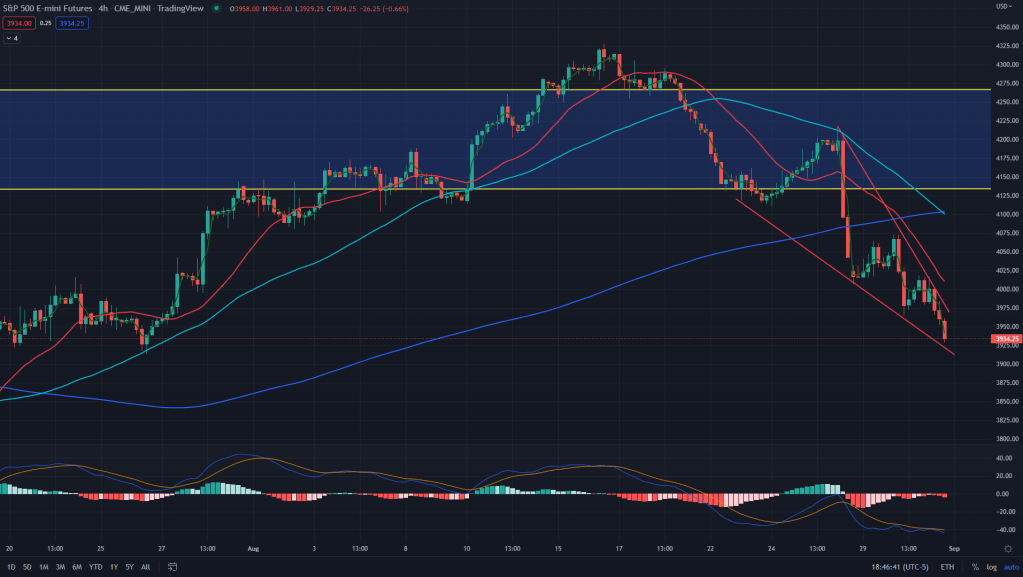
ES (4H): And before I conclude, let’s take a look at whats happening with the ES on the 4H chart – It is forming a falling wedge and it would be suicidal to go short here around current levels. At best, it would be worth buying around the low end of the wedge where risk reward would be favourable to go long.
Conclusion: While it is too early to call for a bottom in the stocks (and EUR) and top in the DXY as of now, but it is clear that the time is near and we might see reversal of fortunes in all these key asset classes. One would be better off to not let their guards off and keep close eyes on what’s happening in the currency markets, especially EUR which has already started shaking off the bears.

Leave a comment