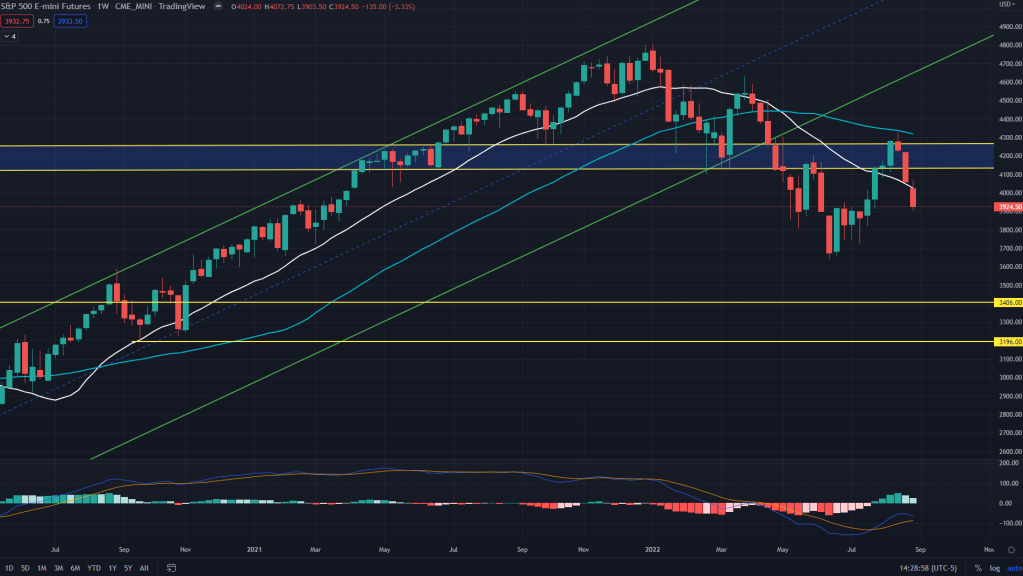
ES (weekly): What a crazy week it was. While we were able to capture some sell-off in the last week, we also captured the bounce right after the mid-week update. Although the view in that article based on currencies regime change is not a short term view and there is still some time before it materialises in the long term, but we captured the bounce off 4H outlook and now its more important to see where are we headed. The weekly outlook is still negative and any bounces are still on sell on rise mode. But when we zoom out and look at the daily and the 4H charts, what do we get?
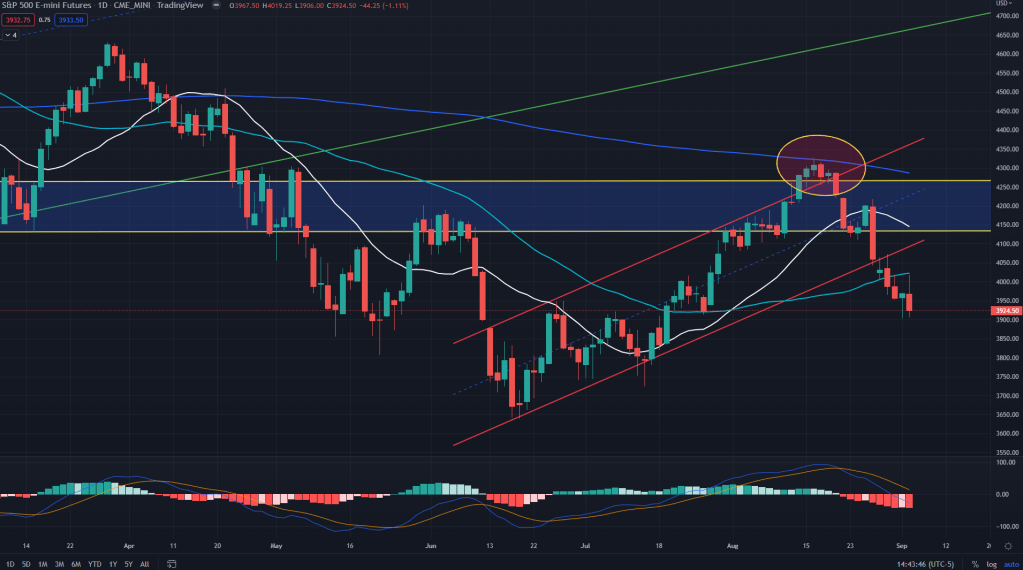
ES (Daily): The daily too got rejected off the 50 SMA and is now clearly headed southward as the momentum too is sell the rallies.
ES (4H): While there is 4H demand line right at 3915, it seems weak now as it bounced off the demand and sold off again, I would expect this sell off to go past the 4H demand line.
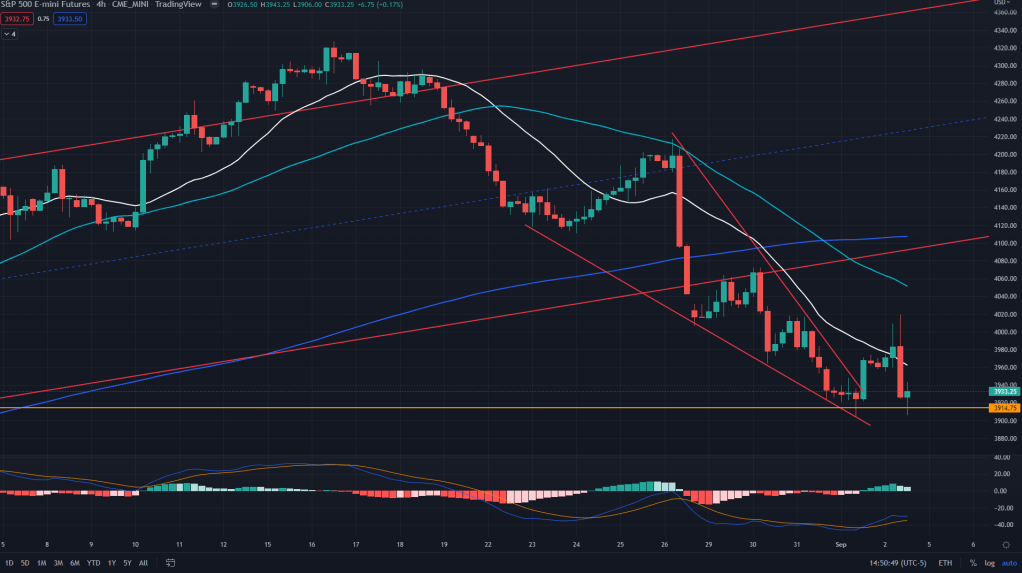
ES conclusion: All the rallies would only be an opportunity for the bears to come with full force. Anyone looking to enter new shorts should keep their stops above 3960.
Comparable SPY trade: Buying 2/3 weeks out 390 SPY put would be far more lucrative at this moment, with stops above 396 on the SPY (or 3960 on the ES) with targets around 371.
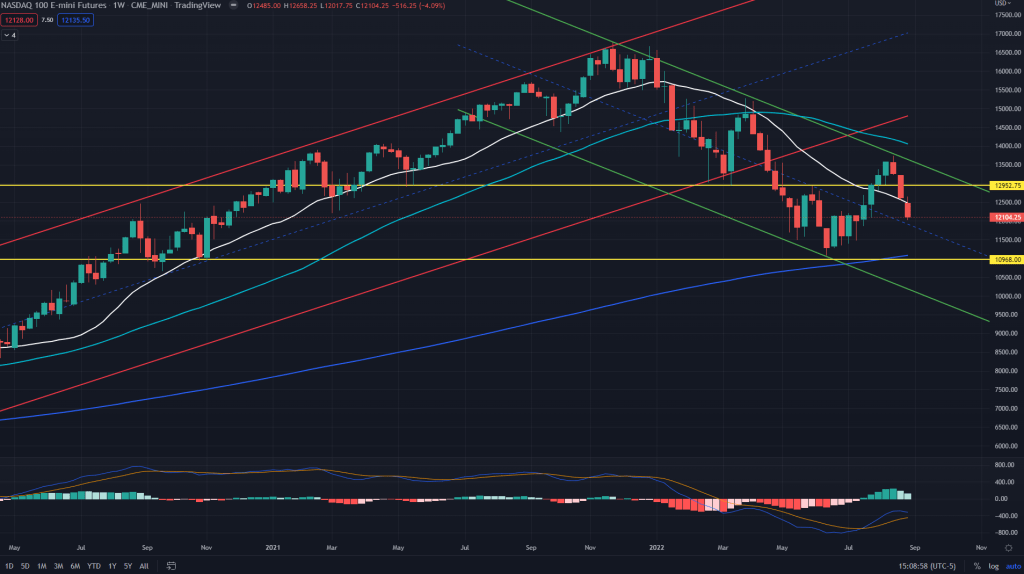
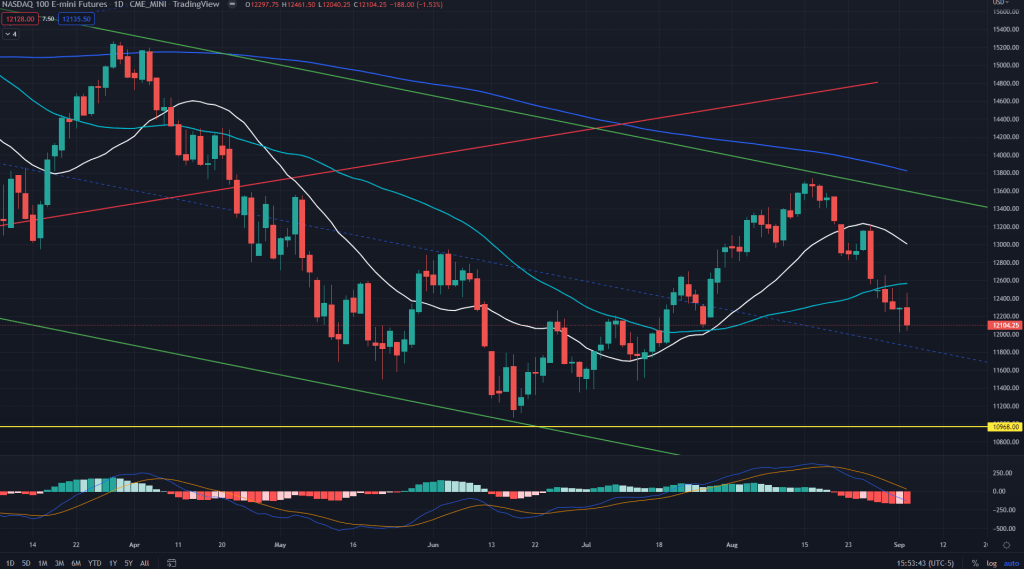
NQ (weekly): Rejected 50 weeks MA, 50 days SMA and now sitting just above the 4H demand line, the very line that resulted in a good 400 point bounce middle of the week and is now weak as it gets retested. Rallies are to be sold here too.
NQ (daily):
NQ (4H):
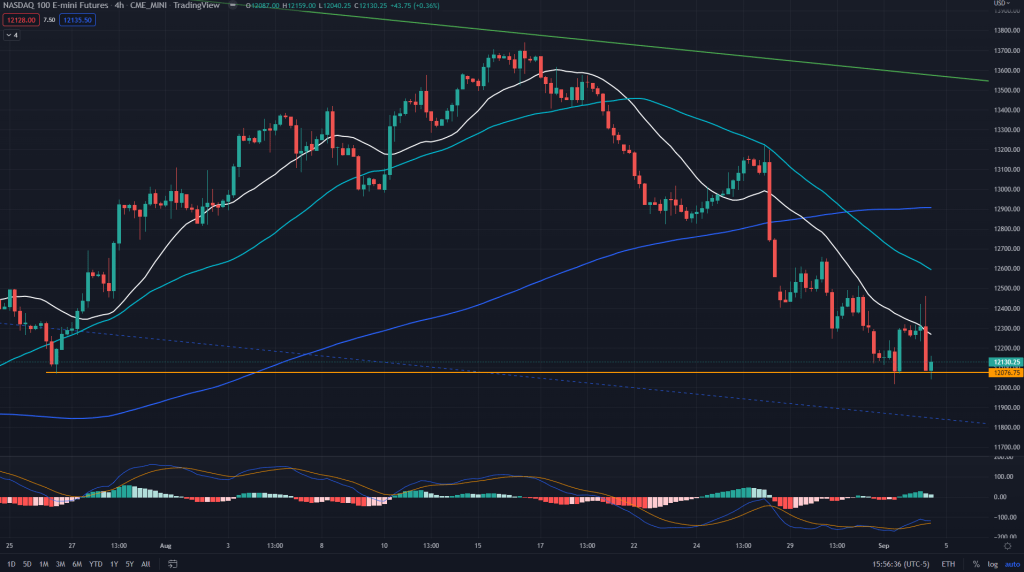
NQ conclusion: Selling NQ with a stop above 12300 with target around 11400 is a good risk reward for the bears.
Comparable QQQ trade: Buying 290 puts (two/three weeks out) with stops above 304 on the QQQ and targets around 269 provides a good trading risk reward.
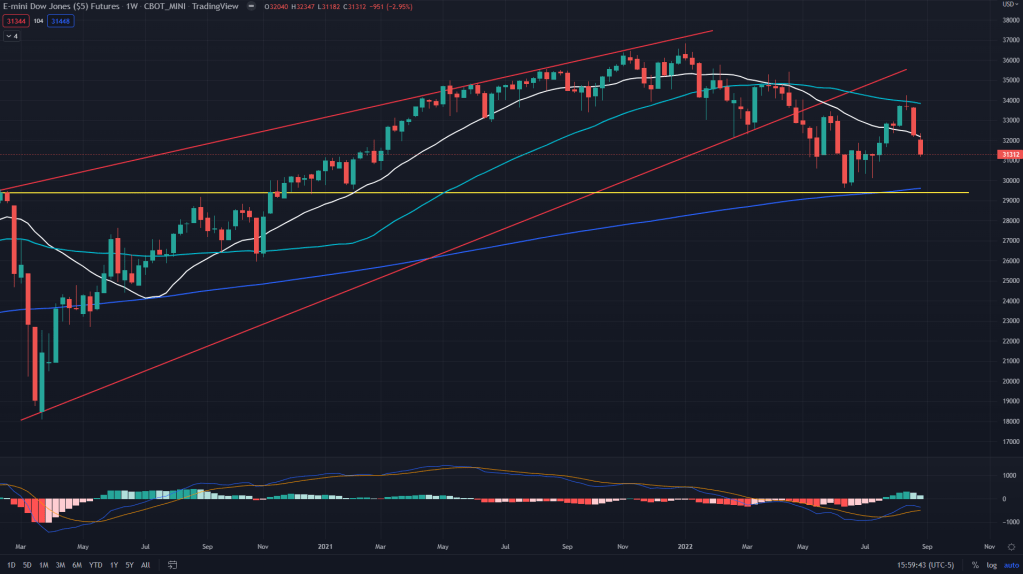
YM (weekly): Similar pattern on the YM as well.. rejected off the weekly 50SMA, daily 50SMA and headed towards 4H demand line of 30939.
YM (daily):
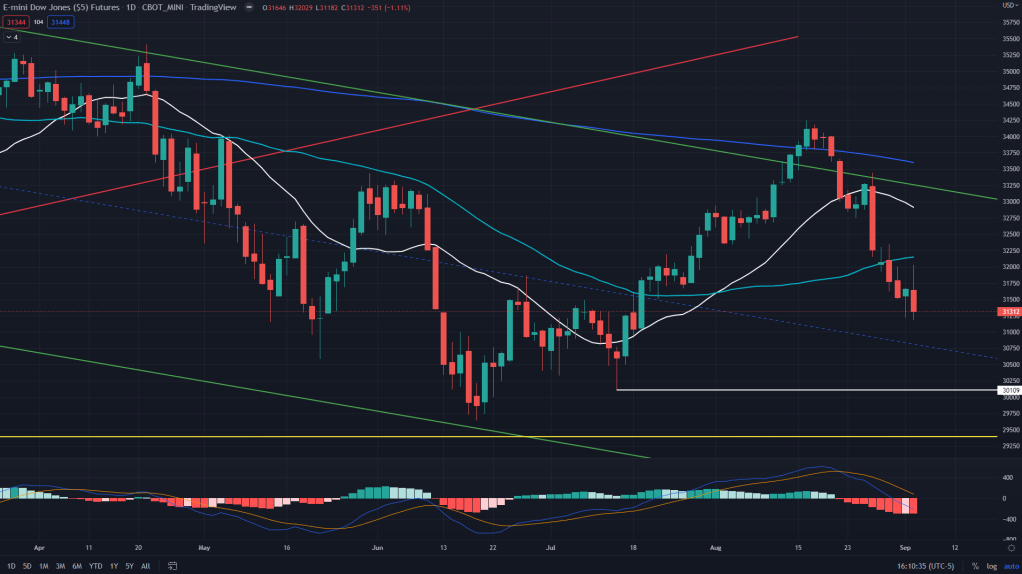
YM (4H):
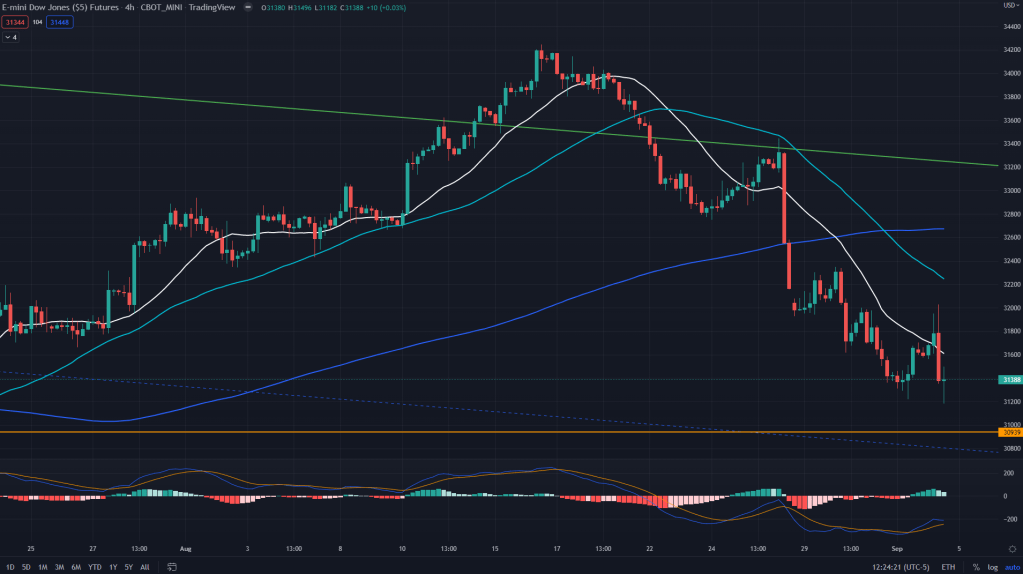
YM conclusion: Shorting YM with 31700 as stop with targets of 30100 would be a good deal.
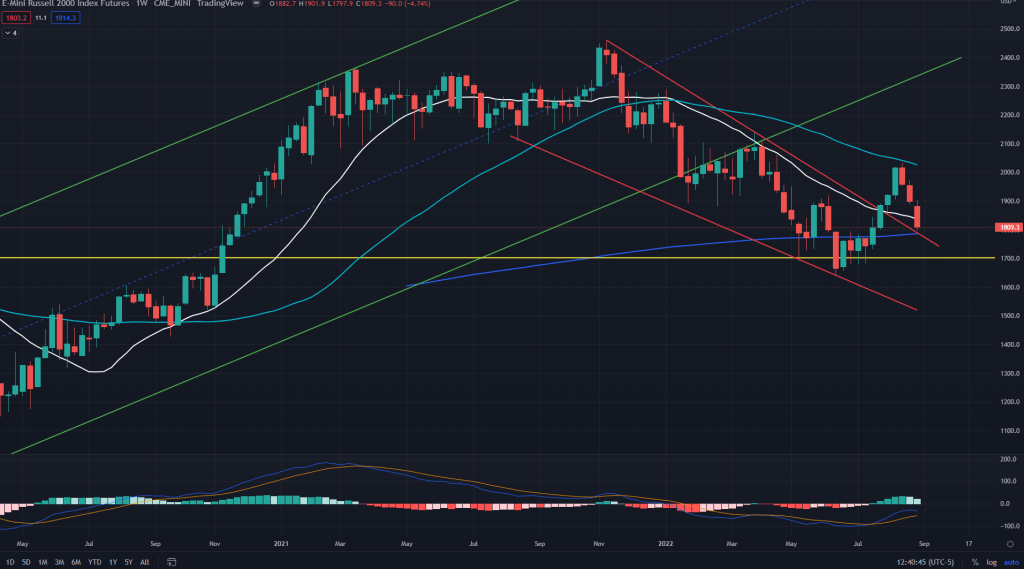
RTY (weekly): The sell-off in RTY has been a bit less severe compared to other key indexes. So far it has only reached the backtest line of the wedge breakout and right at the 4H demand line of 1790 along with rejecting off the 50 days SMA. Expect the weakness to continue.
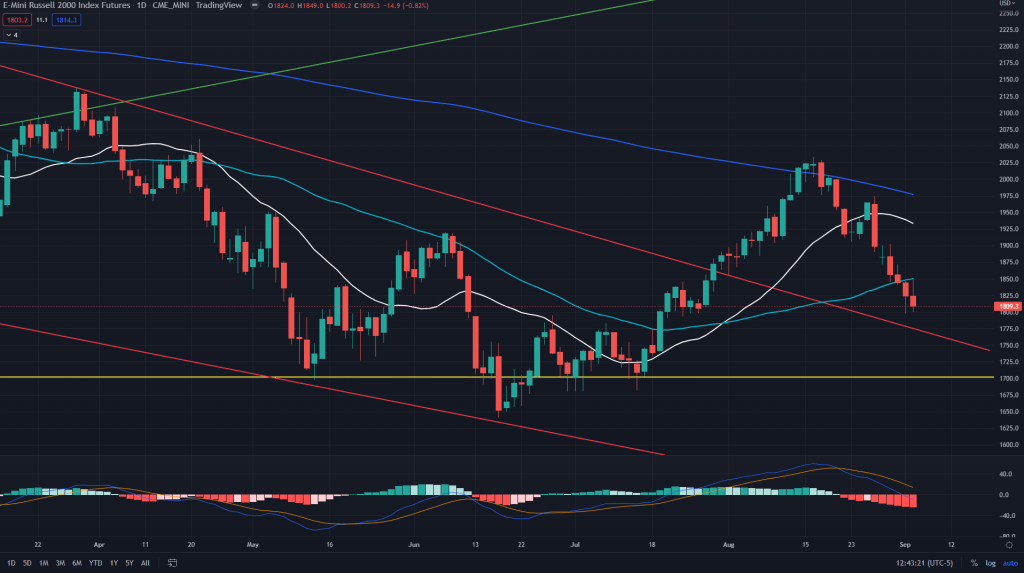
RTY (Daily):
RTY (4H):
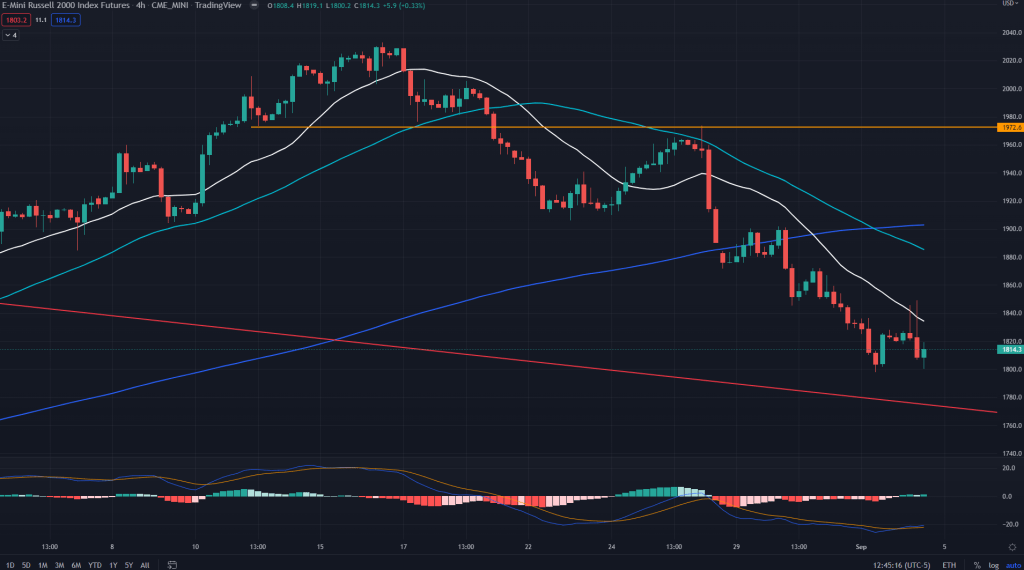
RTY conclusion: Shorting RTY with 1825 as the stop and targeting around 1775 to start with and 1700 would be where we may get some relief bounce for the bulls.
Comparable IWM trade: Buying 175 put (two weeks out) with a stop above 183 and target around 162 would be a good risk reward.

Leave a comment