Last week we managed to capture the bounce in the market and then waited for our moment to get back in. While we are still carrying the shorts, here’s the rationale for why we entered the shorts and how the week ahead looks likely to be?
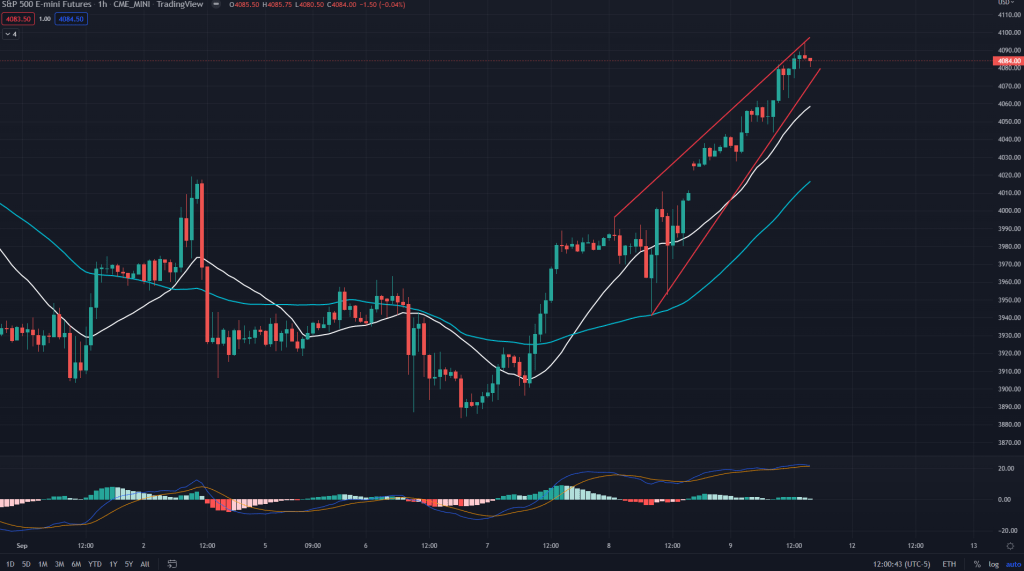
ES (1H): We shorted ES around the upper end of this rising wedge formation on 1H charts. While we got 12 points (twice) from the entry after shorting, that’s not for which the short entry was as the wedge breakdown is still far off and the real game would play out only after the breakdown.
ES (Daily): And when we zoom out on the daily chart, it gives us all the more reasons to be short – almost close to 20 SMA and falling trendline resistance just around.
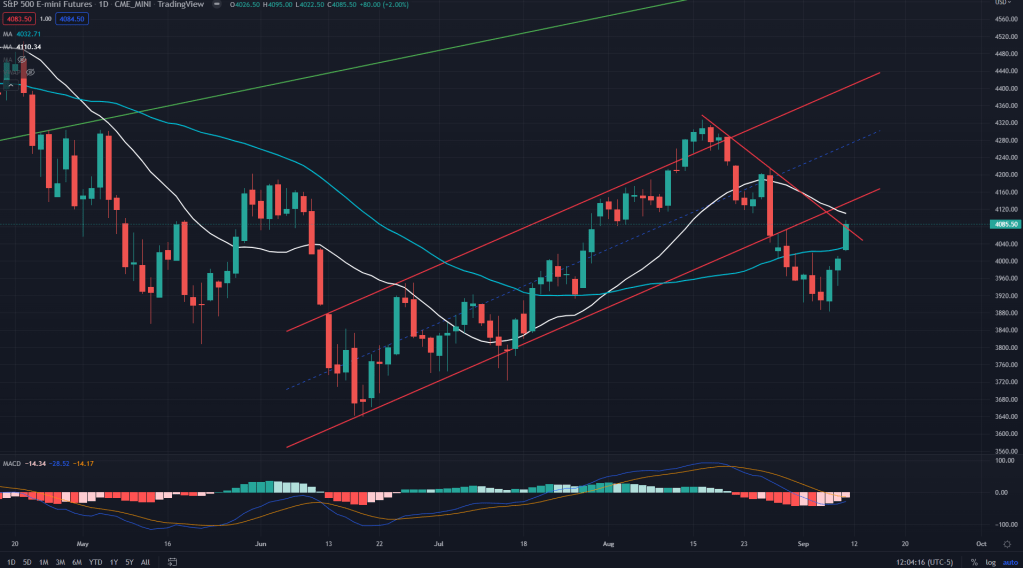
ES conclusion: While entering a position it is important to have more than 1 one reasons and here we have aplenty. 1H rising wedge, 15 mins negative divergence, daily falling trendline resistance, 20SMA overhead and backtest of the channel breakdown. We continue to hold our position with stops slightly above 4150 for the positional shorts and for anyone with short term time horizon 4110 could be a good stop to hold on to.
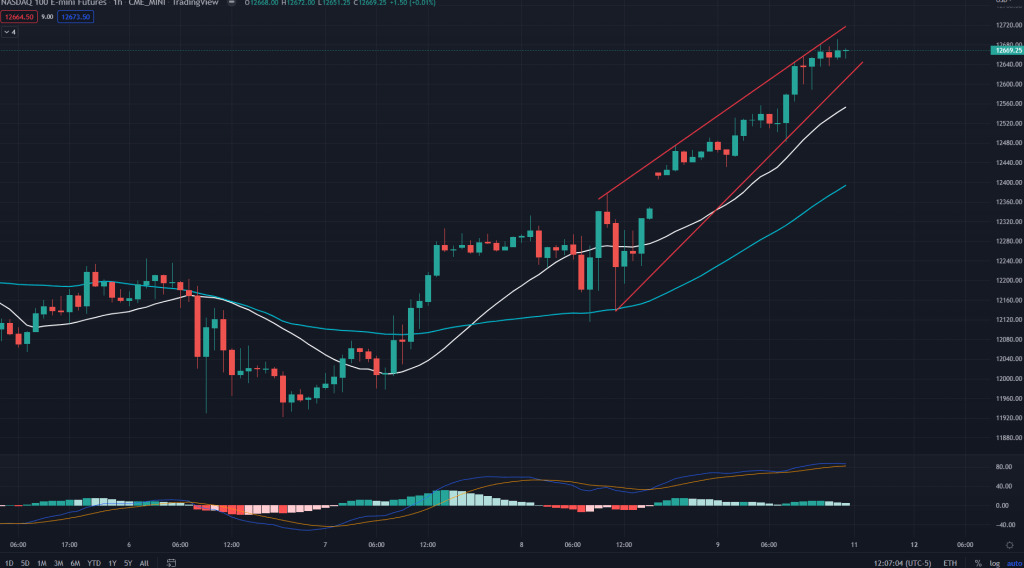
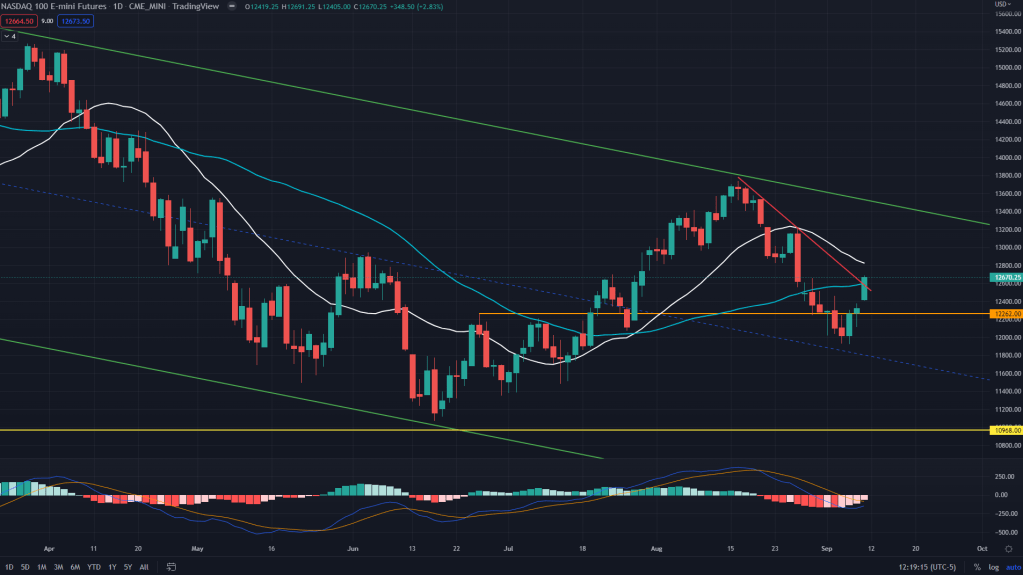
NQ (1H): Similar fate on the NQ as well, no extra commentay needed.
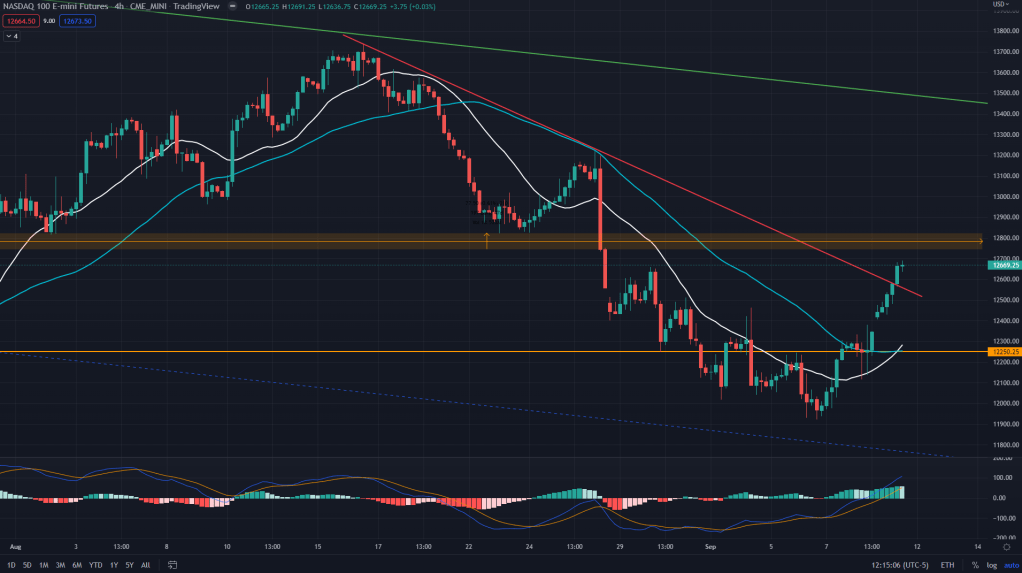
NQ (4H): 4H trendline resistance and supply zone not far above – 12750-12800.
NQ (Daily): On the daily too, pretty similar to what ES has done.
NQ conclusion: We continue to hold our shorts with so many confirmations on various time frames, although we did get 45+ points from our entry at 12635, but the game starts after the wedge breakdown on NQ too. Stops placed at 12810 for the positional play.
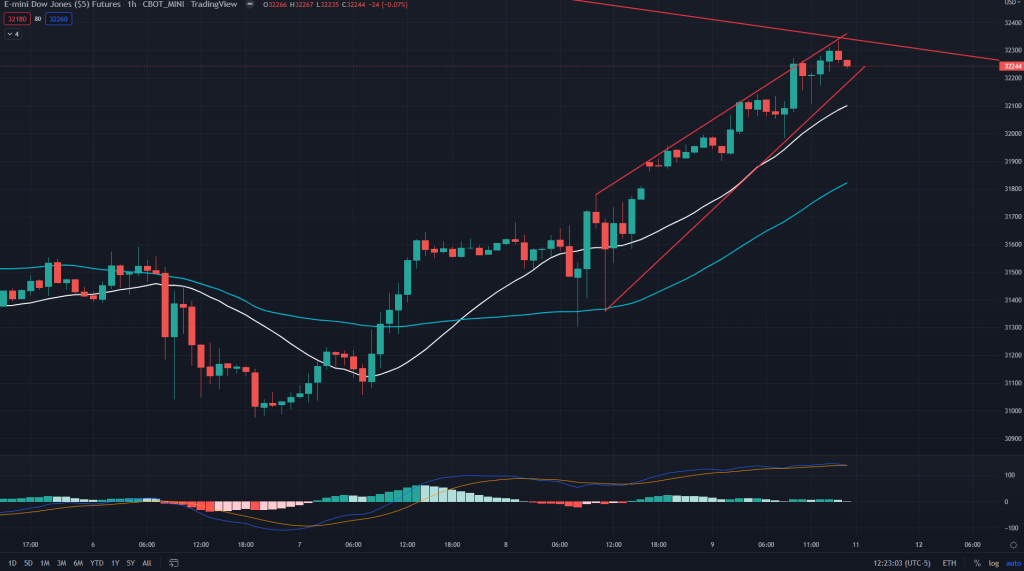
YM (1H): Same story..
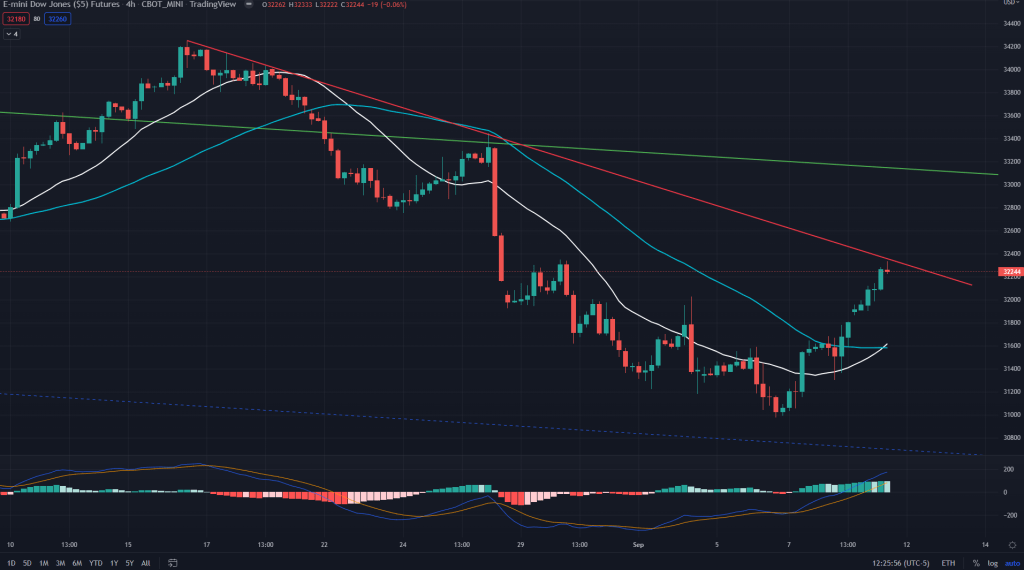
YM (4H): on 4H too, not much different..
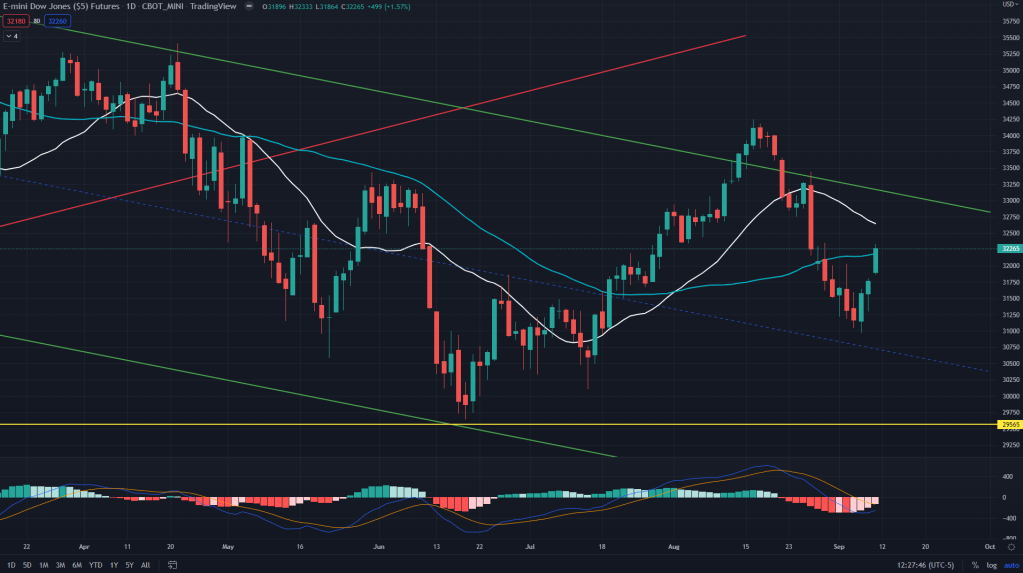
YM (Daily): Here as well..
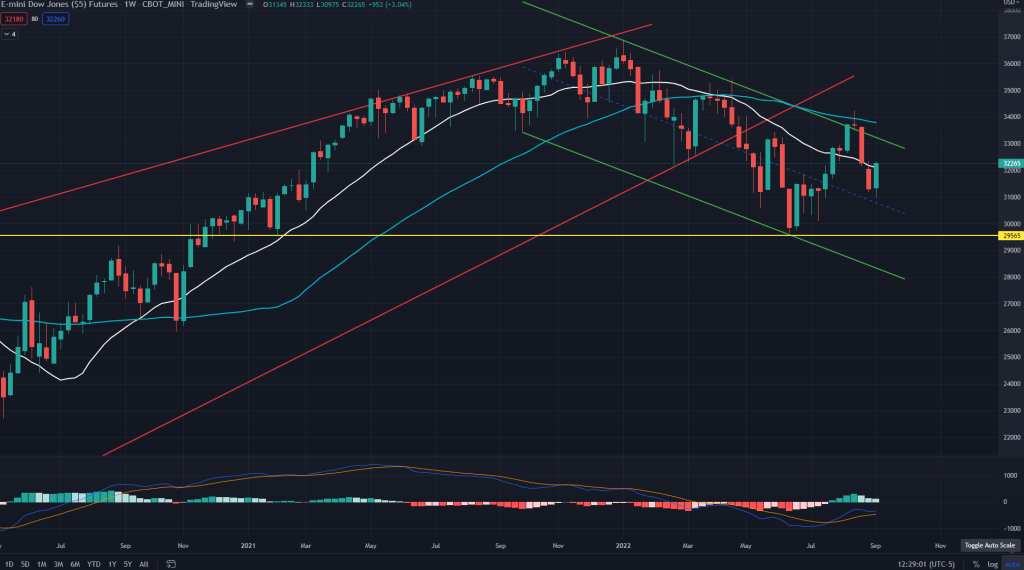
YM (Weekly): Slightly different with the weekly not far off the 20 weeks MA and could provide good enough supply for the bears to prowl.
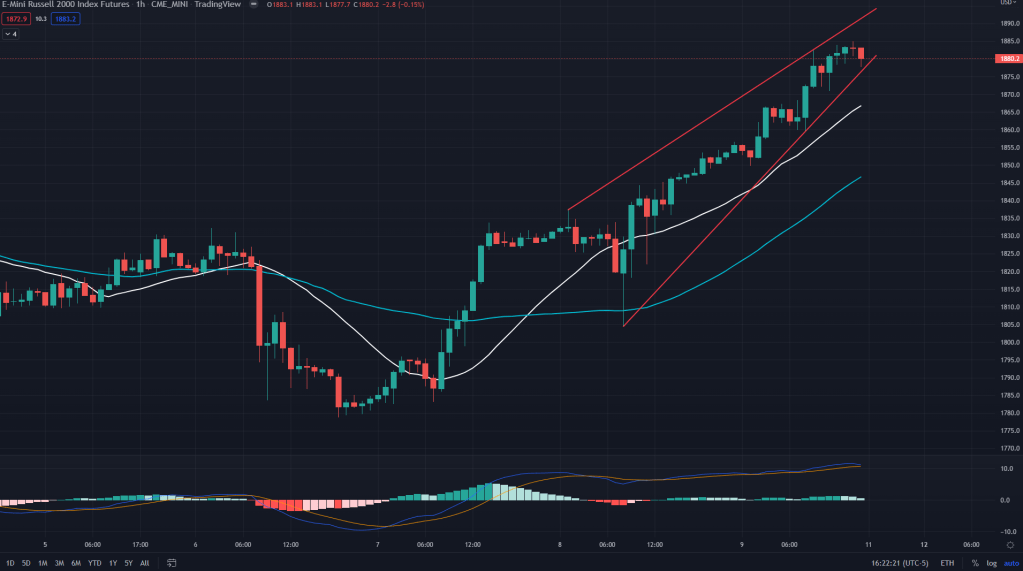
RTY (1H): Rinse, repeat..
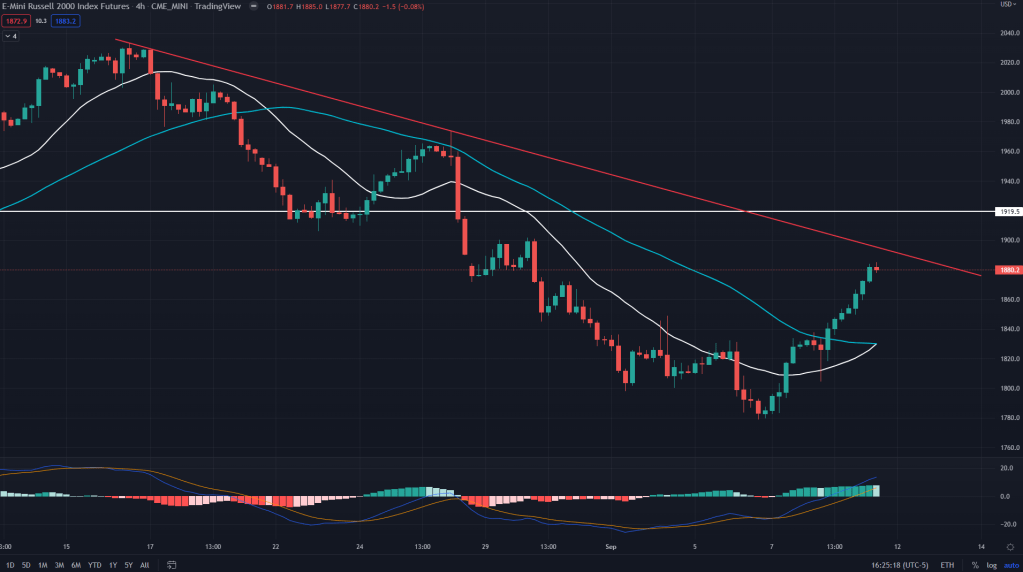
RTY (4H): Some more momentum left perhaps for the bulls to play on before they hit overhead resistance of the falling trendline.
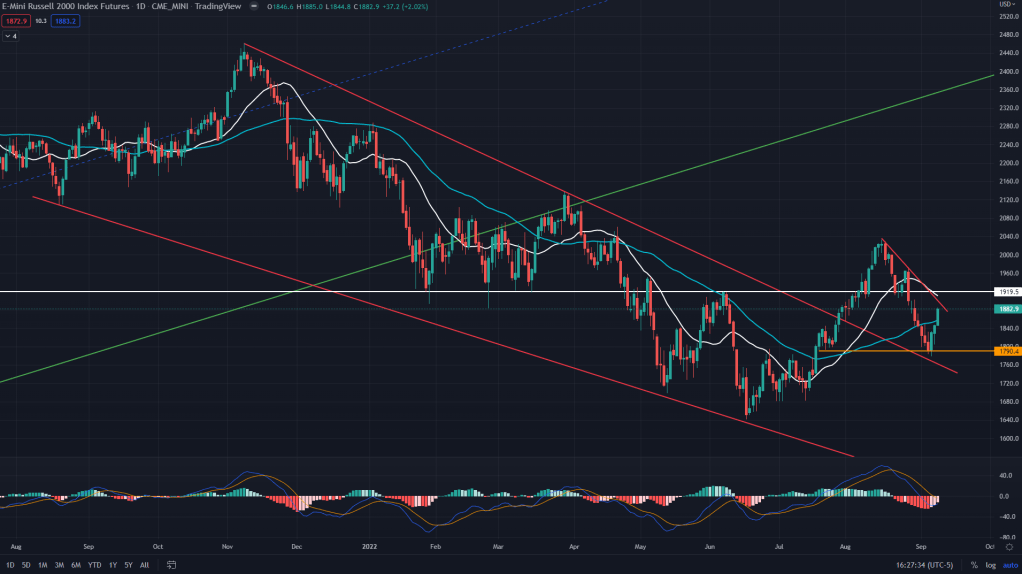
RTY (Daily): Although on the daily, there is this backtest bounce that has me thinking if this bounce may sustain? We will know in the coming week when we have plenty of data points to react to.
RTY (Weekly): On the weekly too, while the backest line bounce is visible, 200 weeks MA too played a crucial role in the bounce and yes it makes me think that this bounce may have some more steam left.
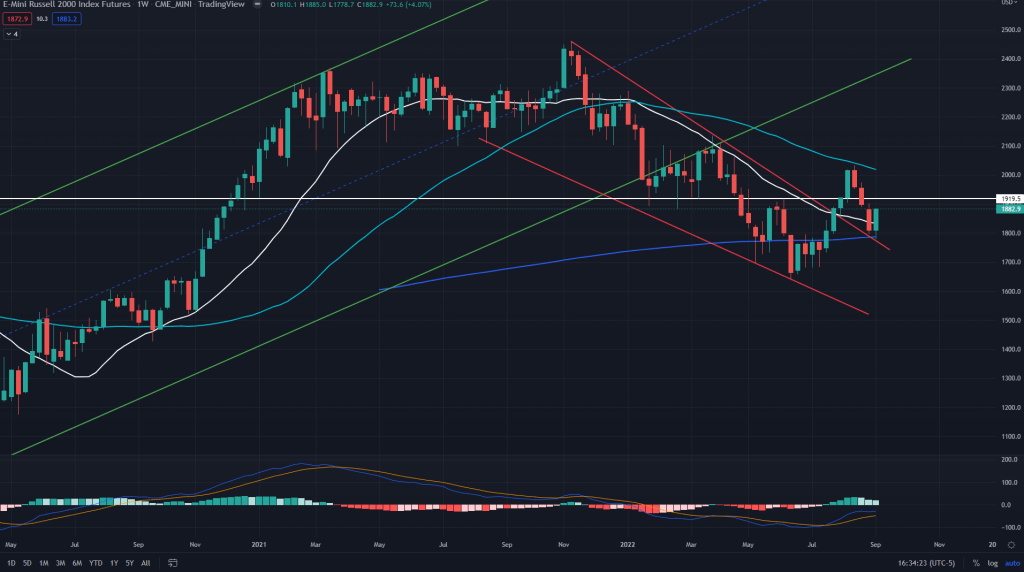
RTY conclusion: While 1H rising wedge and 4H trendline resistances are a sign for us to go short on the RTY too, critical is to note the backest bounce ad 200 weeks MA that proved good enough support for the bulls. We would have to wait and see how it all unfolds.
Important note: RTY represents small cap stocks of the market and thats the key! If small cap stocks do not show much weakness from here while others are falling, that would be a BIG sign for the bulls to solidify their grips on the market. We will have to watch this space very closely.

Leave a comment