Huh! What a week it was. We got into the longs and shorts, gained a few points on both the sides but in the end missed some shorting opportunity on purpose. What lies next is all the more difficult as it won’t be easy to capture longs and shorts again. Here’s why:
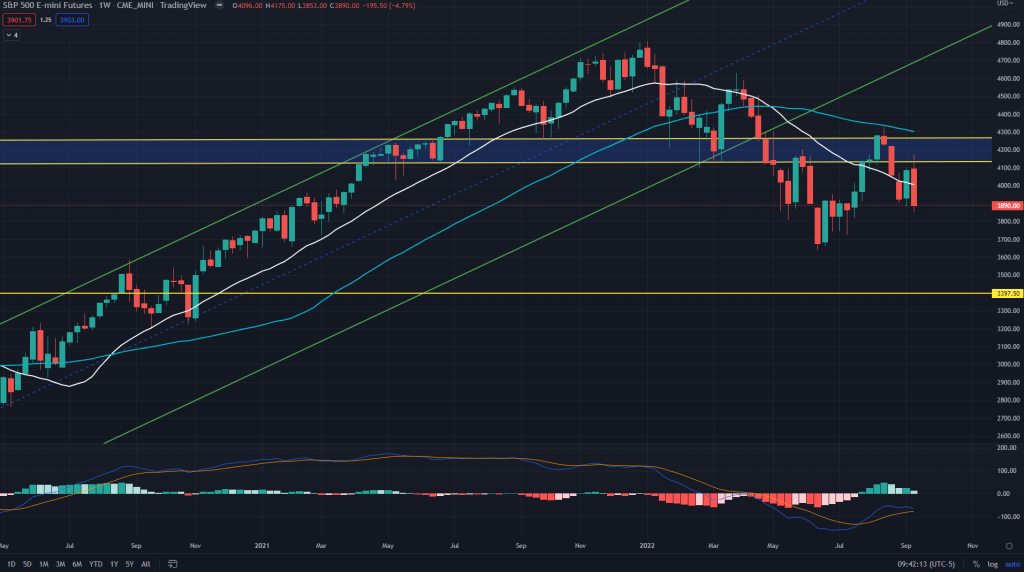
ES (Weekly): What we see her is a weekly bearish engulfing candle, which clearly means the better trade is to short and given that we are now way below the 20 and 50 weeks MA, its all the more rewarding to stay short with potential targets of recent lows and below (3400). But should we?
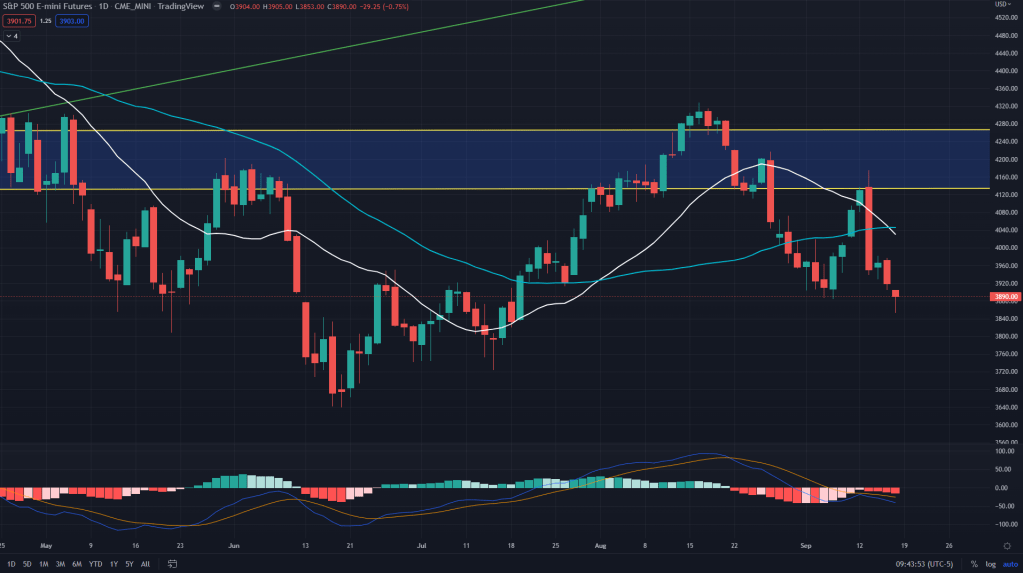
ES (Daily): The daily close of the Friday says otherwise – bullish hammer on the daily is not where one would go short.
ES (4H): And when we take a look at the 4H, it probably is headed for a backtest of the breakdown of low base trade that we didn’t capitalise on. The chart below clearly shows why we didn’t short on Friday when markets bled while we sat on our hands – 4H demand line of 3915 and support in the form of recent lows’ trendline. Not an ideal place to go short. The low base worked, but it could have gone otherwise too.
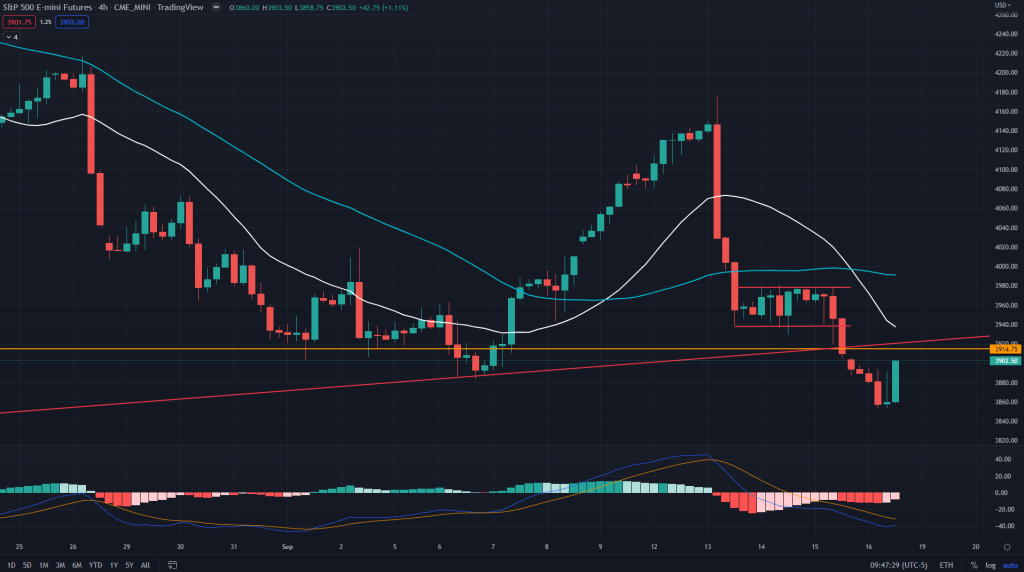
ES conclusion: Instead of shorting here, I would wait for the bounce to materialise and pause. The bounce is expected due to the daily hammer close and backtest of the low base on 4H. Most likely the shorting area would be between 3915-3940. I’ll keep you posted via Twitter.
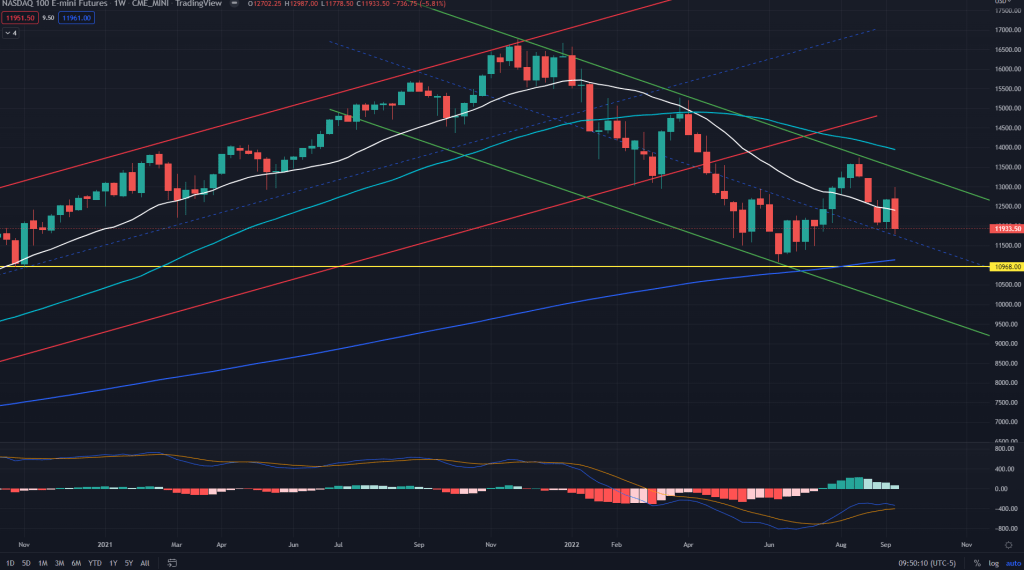
NQ (Weekly): Same story goes with NQ and YM and RTY too. No need to give any further explanation in terms of what happened.
NQ (Daily):
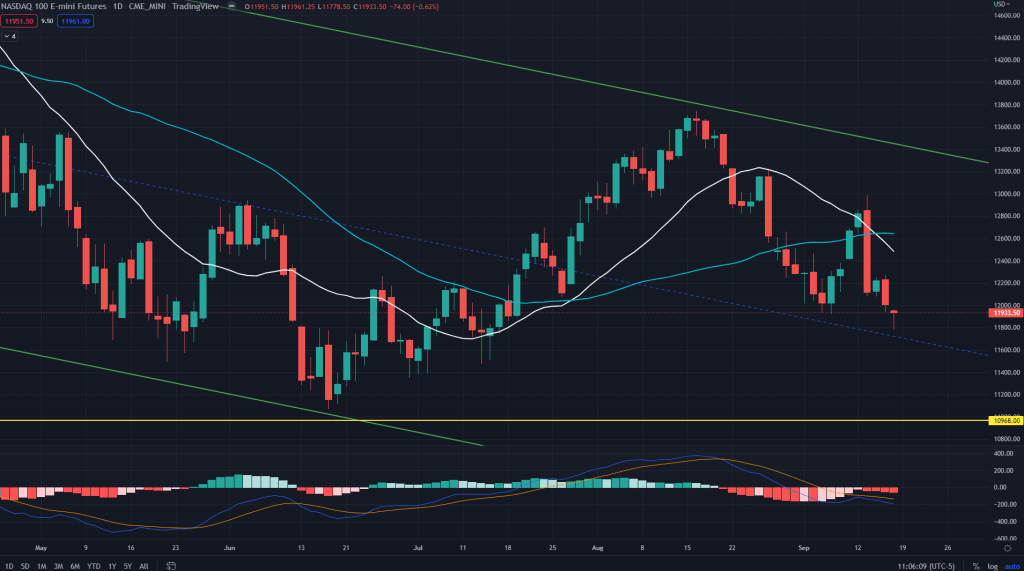
NQ (4H):
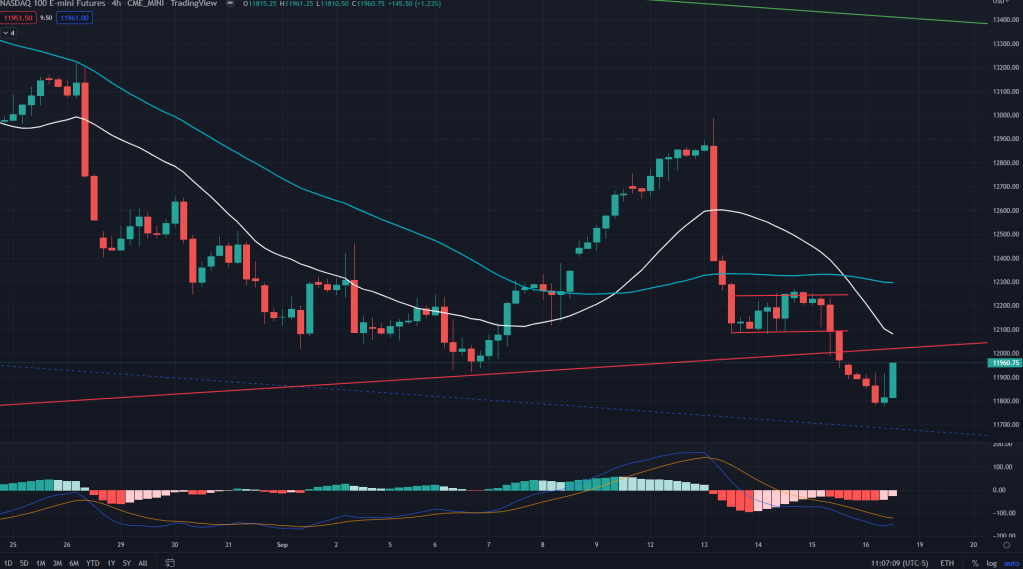
NQ conclusion: Right shorting opportunity lies btween 12015 – 12100. Till then, we wait.
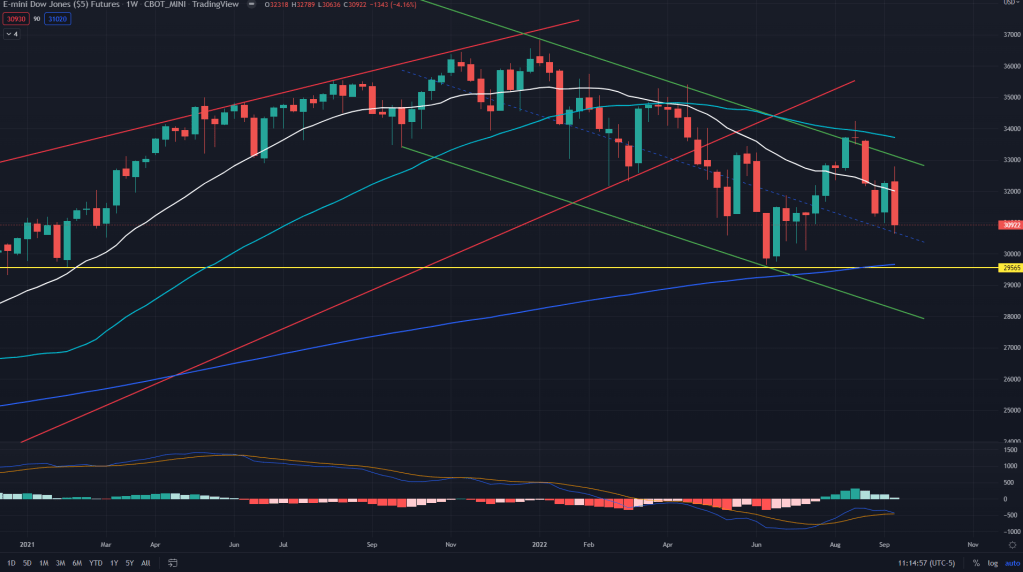
YM (Weekly):
YM (Daily):
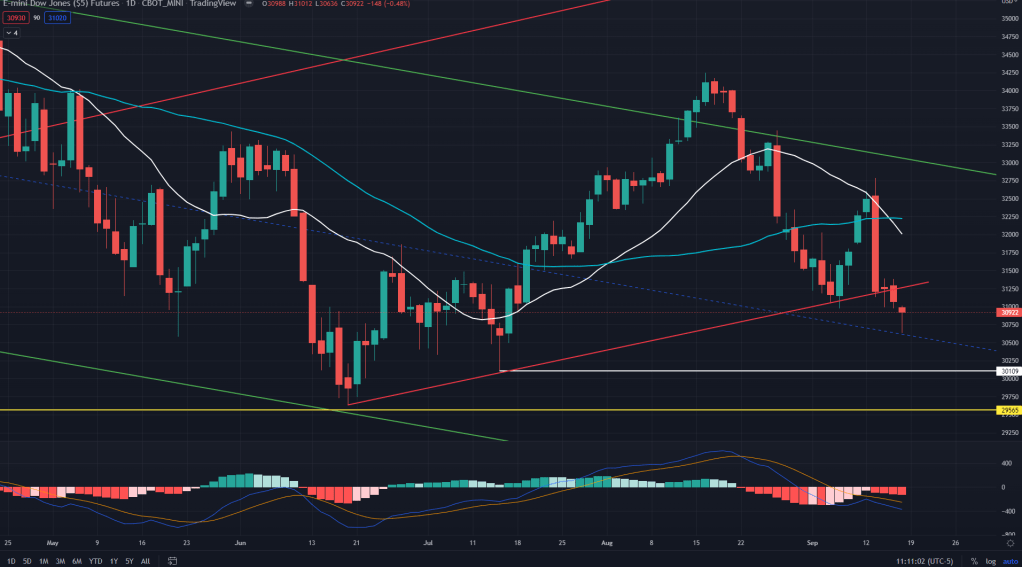
YM (4H):
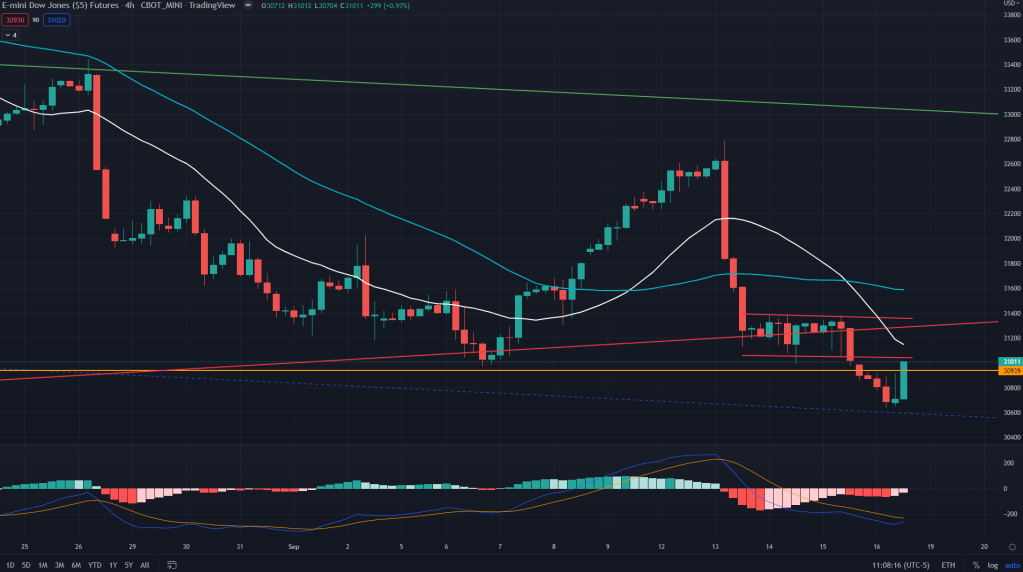
YM conclusion: Perhaps the weakest of the lot and has already backtested the breakdown and may even go all the way towards upper end of the low base, which is at 31350, coinciding with the backtest of trendline support breakdown.
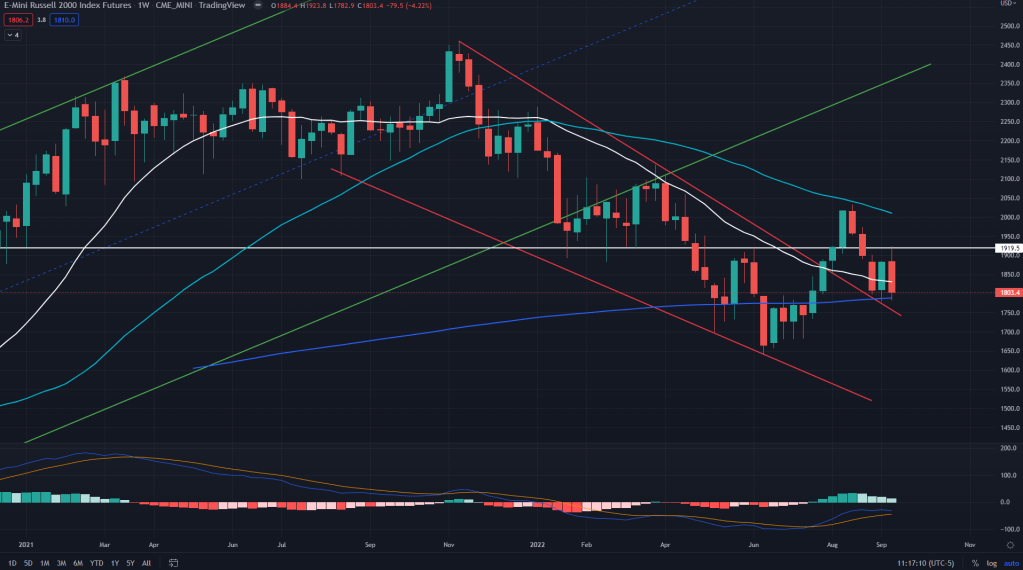
RTY (Weekly): Slightly different story on the RTY – It has now fallen all the way towards its 200 weeks MA and has been flirting with it for the past 3 weeks now. I would expect some bounce here for 3 reasons: weekly 200MA, backtest of falling wedge and..
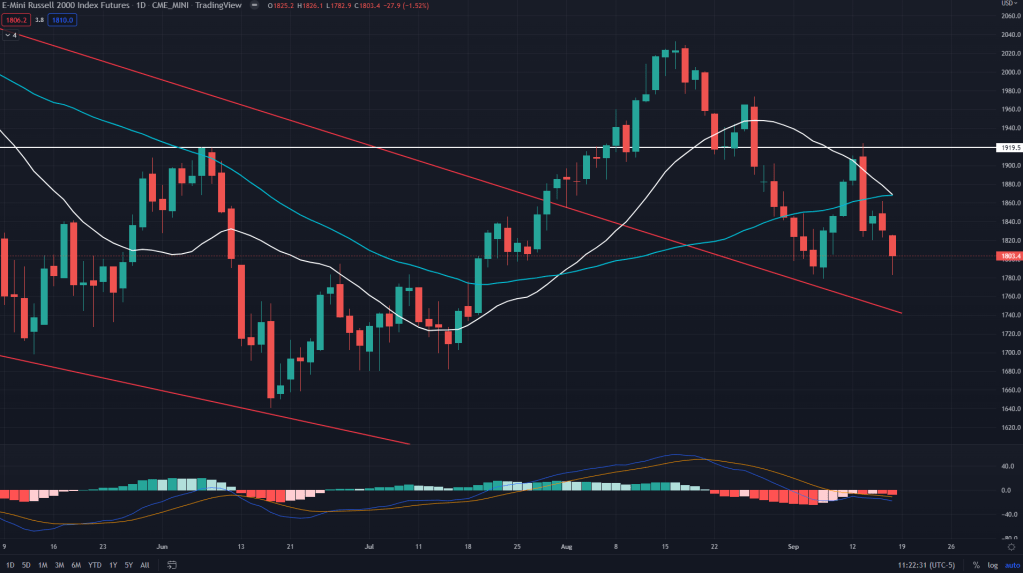
RTY (Daily): Double bottom on the daily..
RTY (4H): Here’s an explanation of why we went long and how we went wrong: The low base formation was a diamond bottom earlier which it broke out of and failed instantly before we could move out. End result: false diamond breakout resulting into low base breakdown, all the way towards the 4H demand line of 1790. Could we have gone short after the low base breakdown, yes but it was coin flip trade and could have gone otherwise just as ES and NQ were and it made more sense to stay out instead.
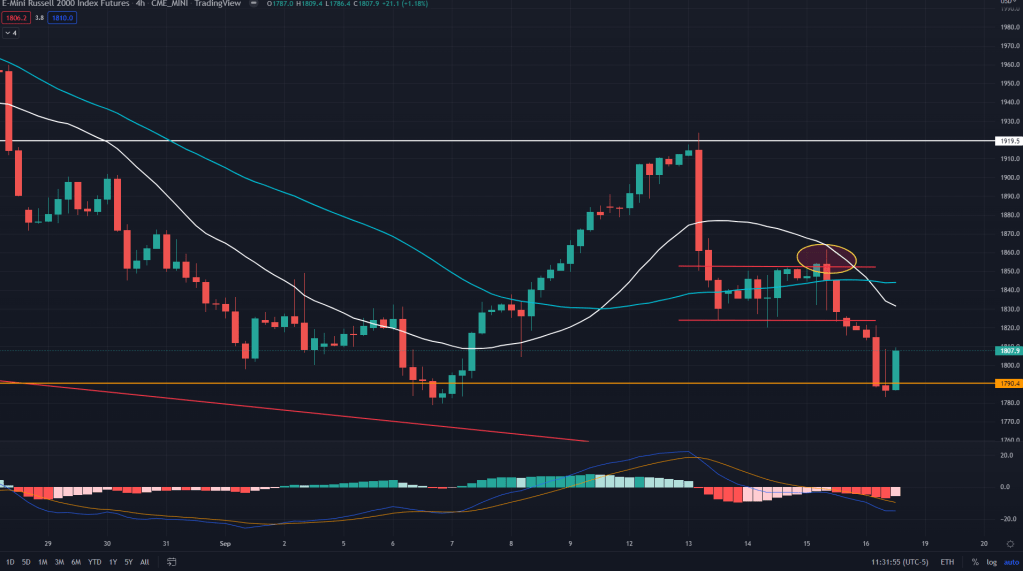
RTY conclusion: There is an opportunity to go long here but I would give it a pass and would instead wait for my shorting trade which would be far more lucrative as against going long. Most likely next short trade would be in the range of 1820-1855.
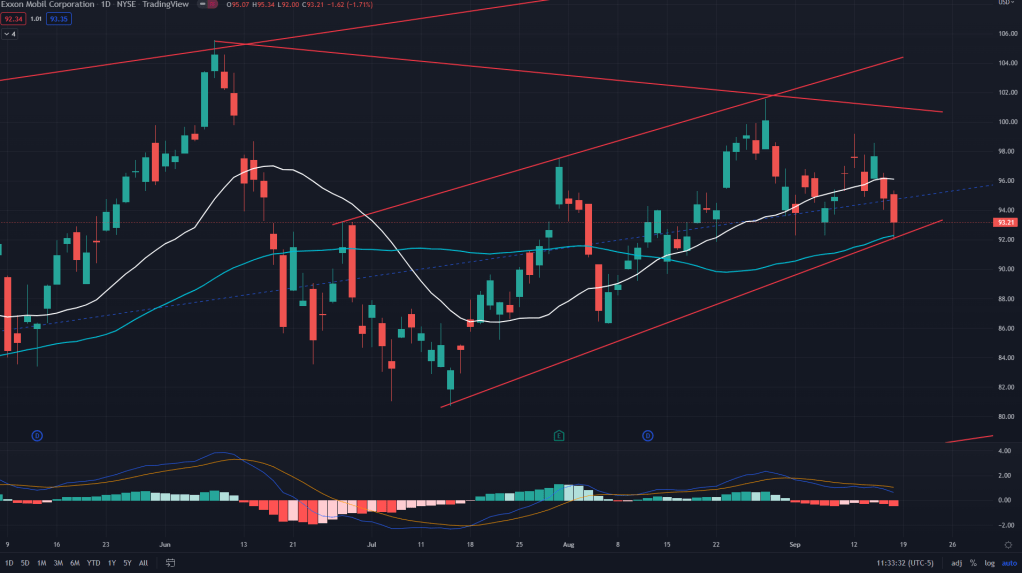
XOM (Daily): Here’s where we stand on our XOM call which is based on bullish view on the stock as well as on crude: The support in the form of rising trendline and 50 days SMA, along with 20 weeks MA, gives me conviction enough to stay long XOM.
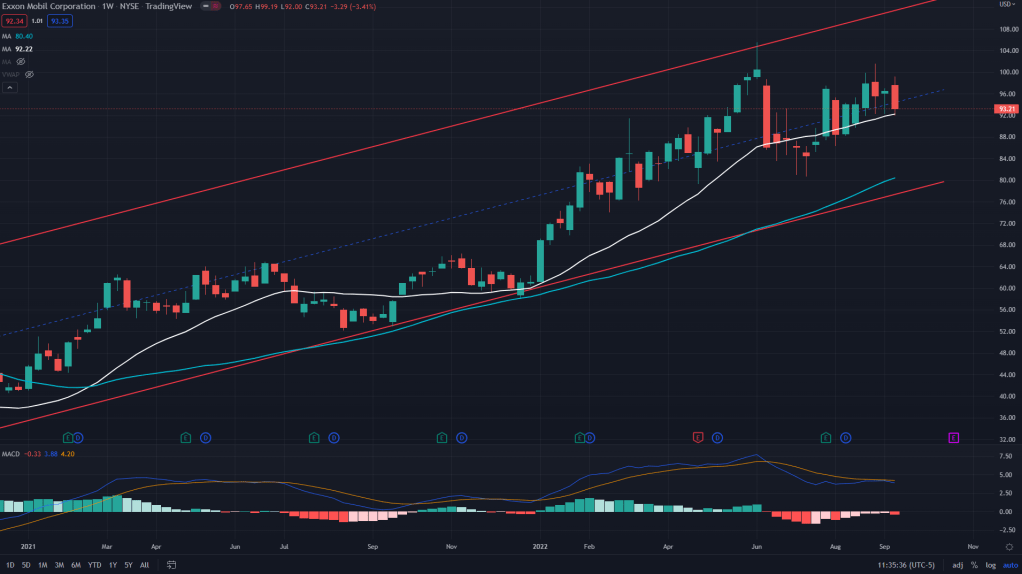
XOM (Weekly): 20 weeks MA and no signs of negative MACD divergence are good enough for me to believe that there is one attempt towards new high is left before the stock peters out.
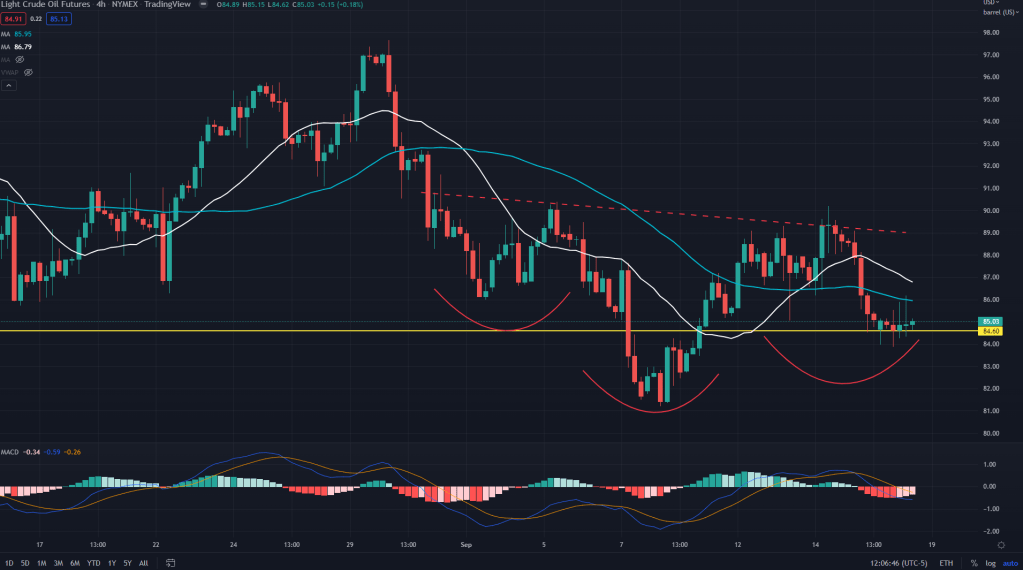
Nymex crude (4H): And here is all the more reason for me to stay bullish the crude: 4H inverse Head and Shoulders – which is a bullish signal and fireworks could begin when it crosses past 90-91 zone.
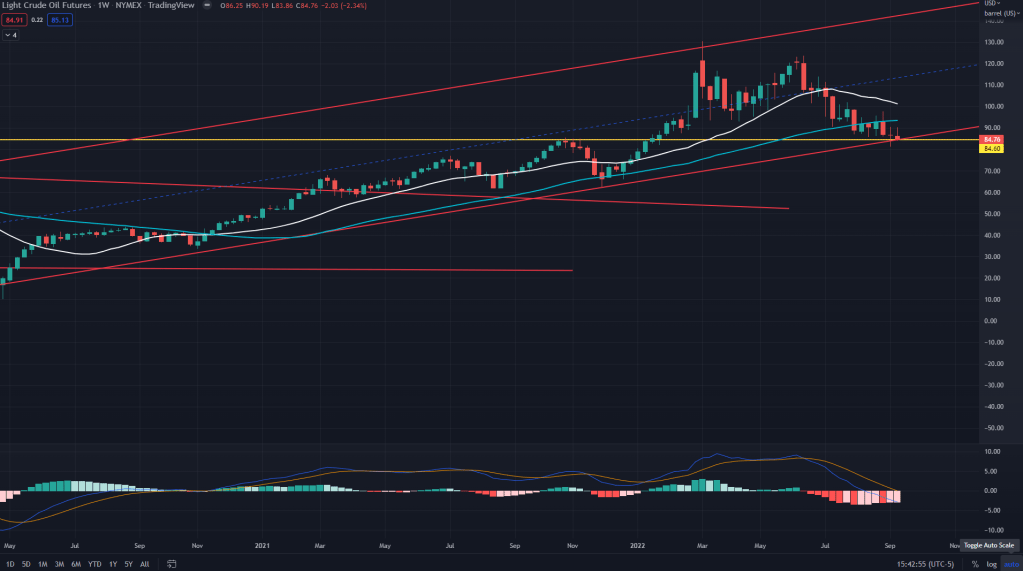
Nymex crude weekly: 4H and weekly both pointing towards likely upside in the crude and probably three digits is where we should crude in the times to come.

Leave a comment