What a week it was, while this fall was expected, but the more it falls, the brutal it gets. The thesis for this continuation of bearish market has been macro and technical combined. While I have been explaining my technical view as often as I can, macro view still remains as shared in the first post and as recent as the deflation stagflation point I had mentioned few weeks ago. I would write about my views on the interest rates and growth aspects sometime next week again. Lets dive in now on the technicals again and see what lies ahead of us.
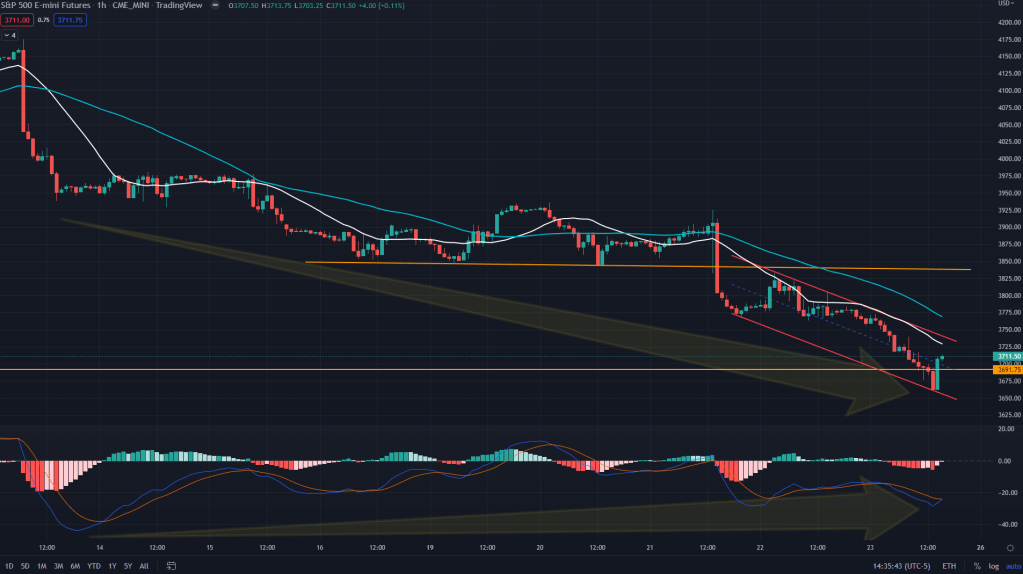
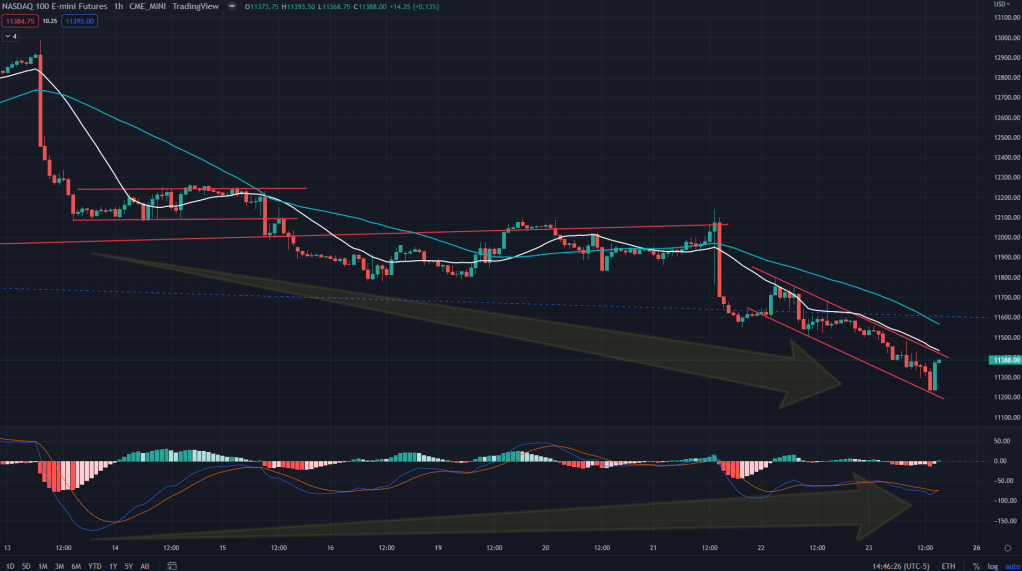
ES (1H): While ES has been making new lows on the hourly chart, momentum, as depicted by the MACD has not been as negative and has been diverging on the positive, hinting us towards a probable bounce on the hourly chart before the bears resume the downtrend. 3740-3765 is where lies opportunity to enter shorts again.
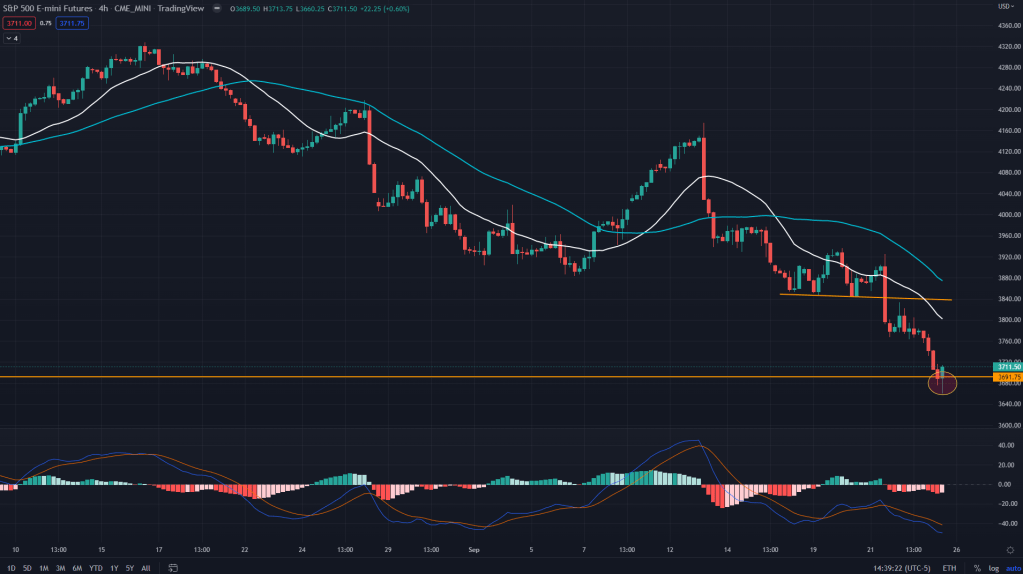
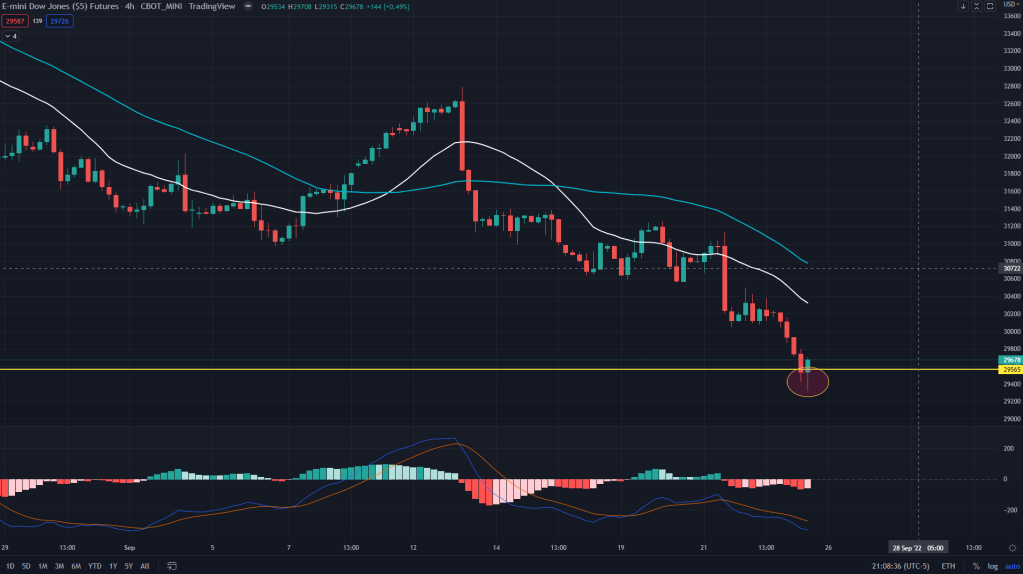
ES (4H): Even on 4H, there was a false breakdown off the demand line as shown as there is a possible bounce in the offing. Although the immediate supply line on the 4H lies around 3840 area, I wouldn’t be holding my breath for the bounce above 3800.
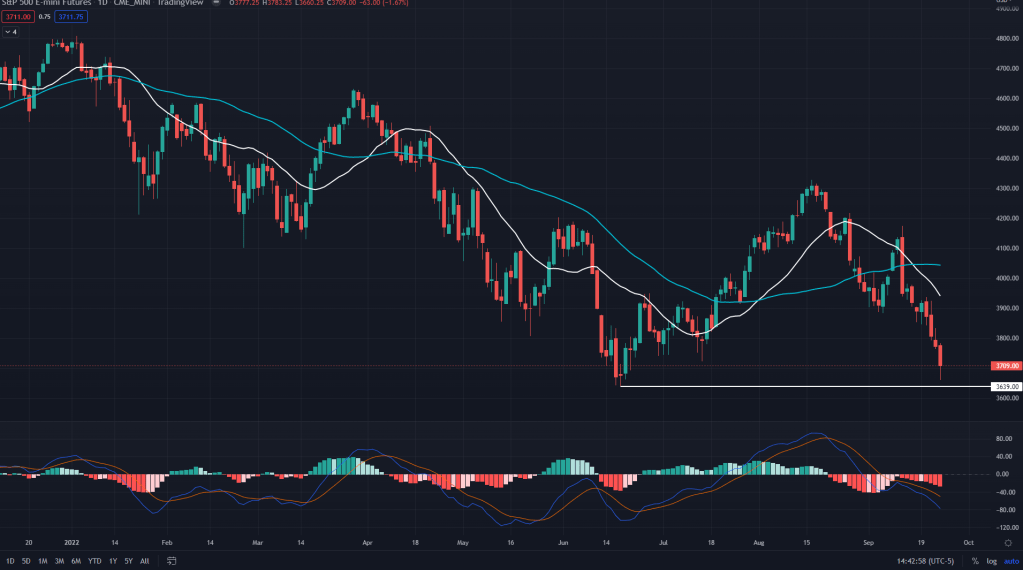
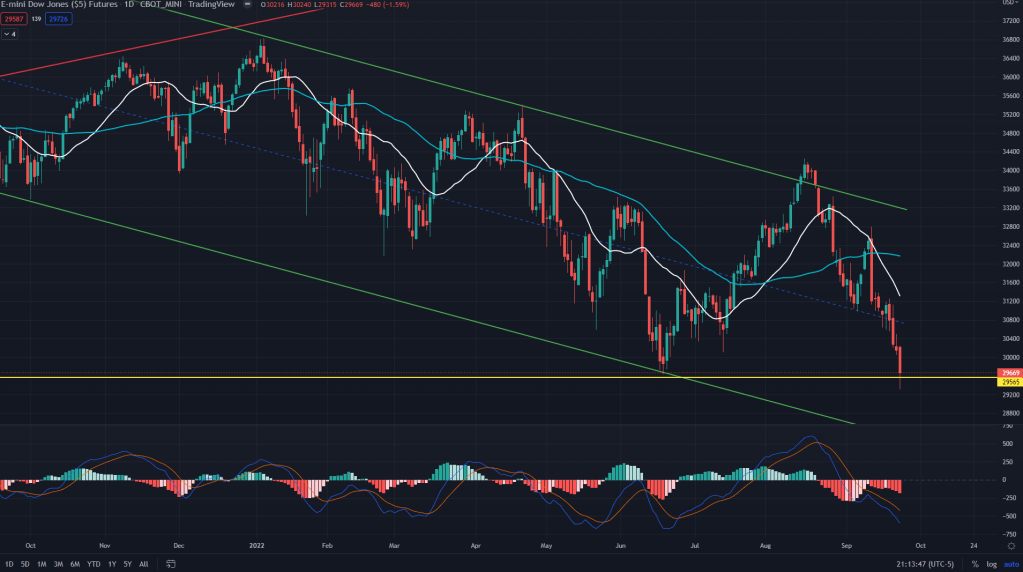
ES (Daily): On the daily, it looks like probably a double bottom forming and hence the bounce that we saw in the last hour and some more to come. But..
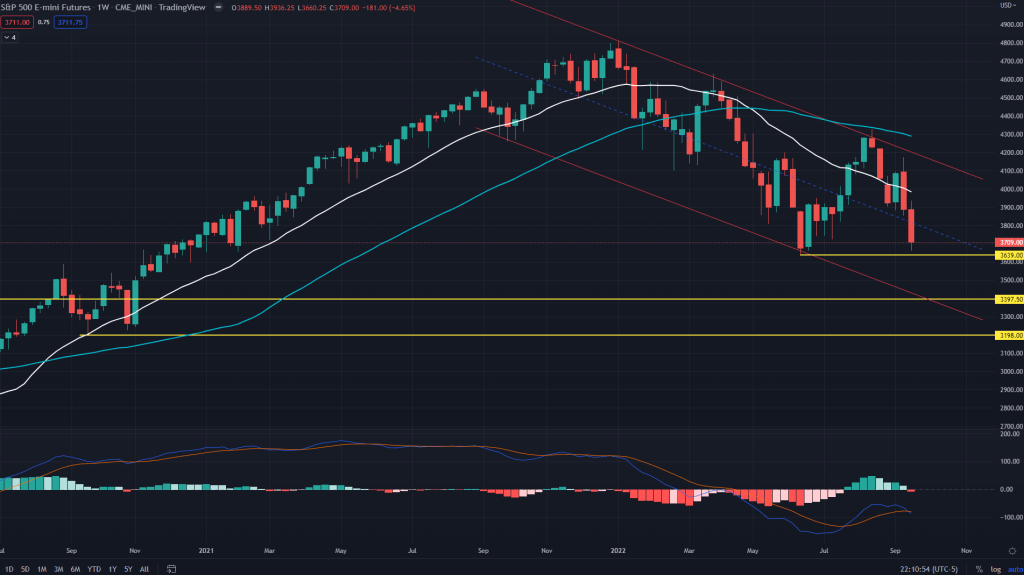
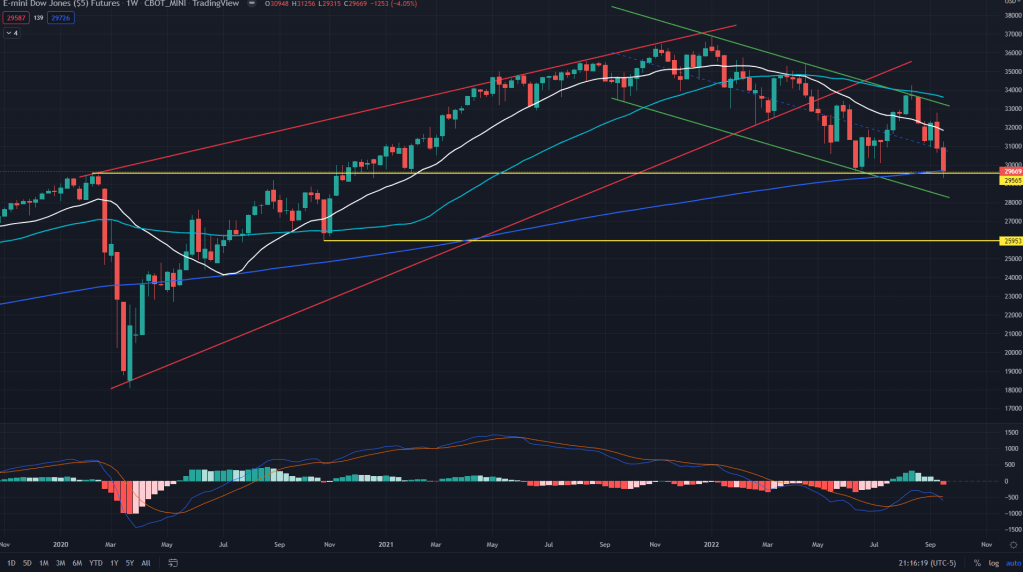
ES (Weekly): On the weekly, while it co-incides with the weekly and daily demand line of 3639, this bounce that we’re likely to see as per lower time frame charts, won’t be sustainable and would get sold into. I’m expecting newer lows in the range of 3350-3400 before a sharper bounce ensues.
ES conclusion: Stay short if you are with raised stops and be ready to short around 3740-65 if you are not short already.
NQ (1H): Similar story. Nothing different. Expect the bounce towards 11500-560 to short.
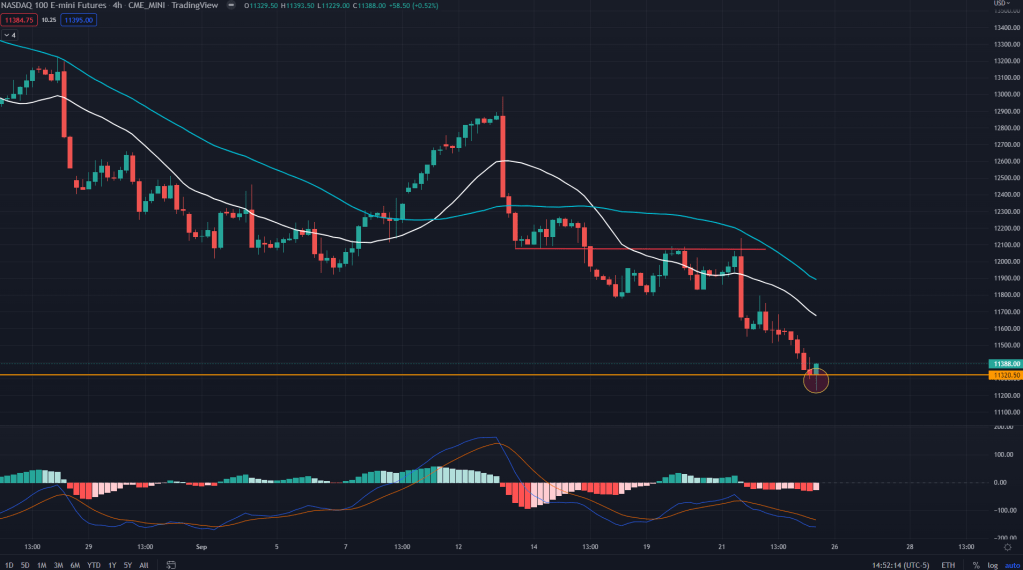
NQ (4H): False breakdown of weekly demand.
NQ (Weekly): And when we look at the weekly chart, the pain is far from over. The bounces that we may see based on smaller time frames, would get sold into.
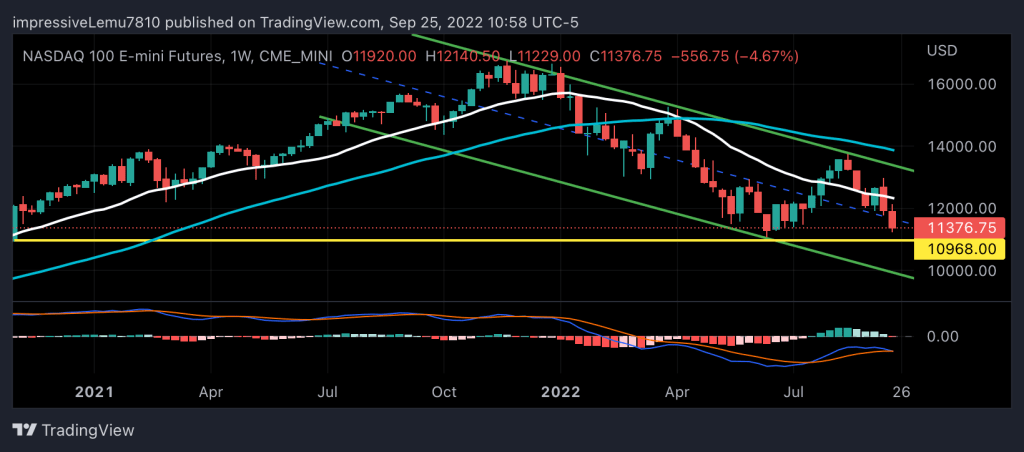
NQ conclusion: Even as the bounce would come due to what lower time frames show, we know that it’s the weekly chart that has been driving prices lower all the year. Short the bounce as and when we get. Anything above 11500 would be a good entry for the short.
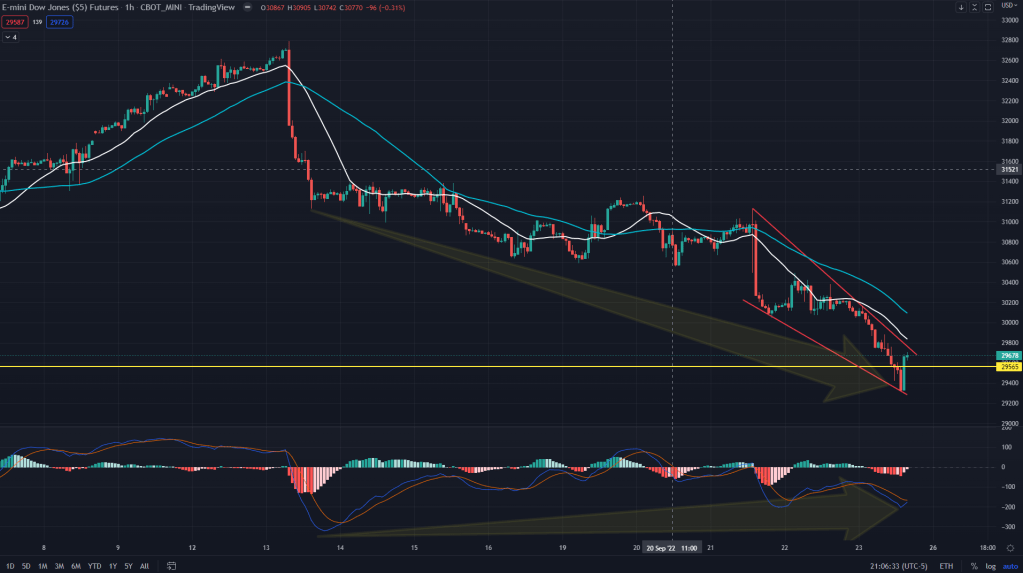
YM (1H): No different except for the fact that YM is the only index that has already hit a new low. Positive MACD divergence along with falling wedge on 1H would ensue bounce towards 30,000-30,100. Which is where one can enter new shorts.
YM (4H): False breakdown of weekly demand
YM (Daily): New low, breaks below the weekly demand and bounces in last hour. No sustainable bounce though and soon would break past the weekly demand too.
YM (Weekly): Along with weekly demand, what came to the rescue is 200 weeks MA. Deserves respect and a bounce is here to come.
YM conclusion: Anything north of 30,000 would be a good entry for the bears to short.
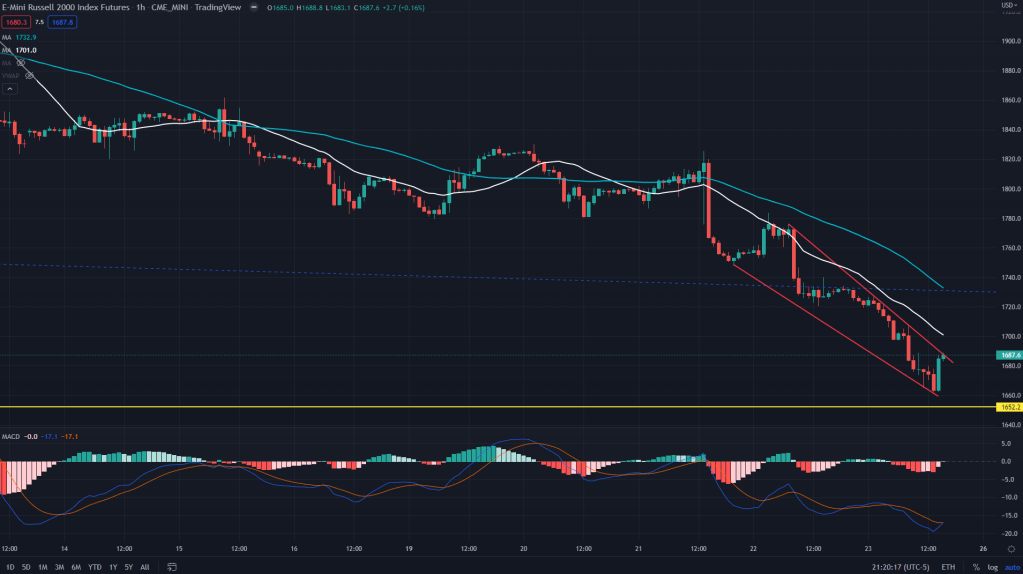
RTY (1H): Only index where 1H is still not on the positive divergence in terms of momentum, but the price is sitting right above the upper end of the falling wedge. Expect it to cross and bounce towards 1720.
RTY (Weekly): And again the only index that has given up on the 200 weeks MA. Also not far from the weekly demand line of 1650. Once broken, next line of defence would be 1530.
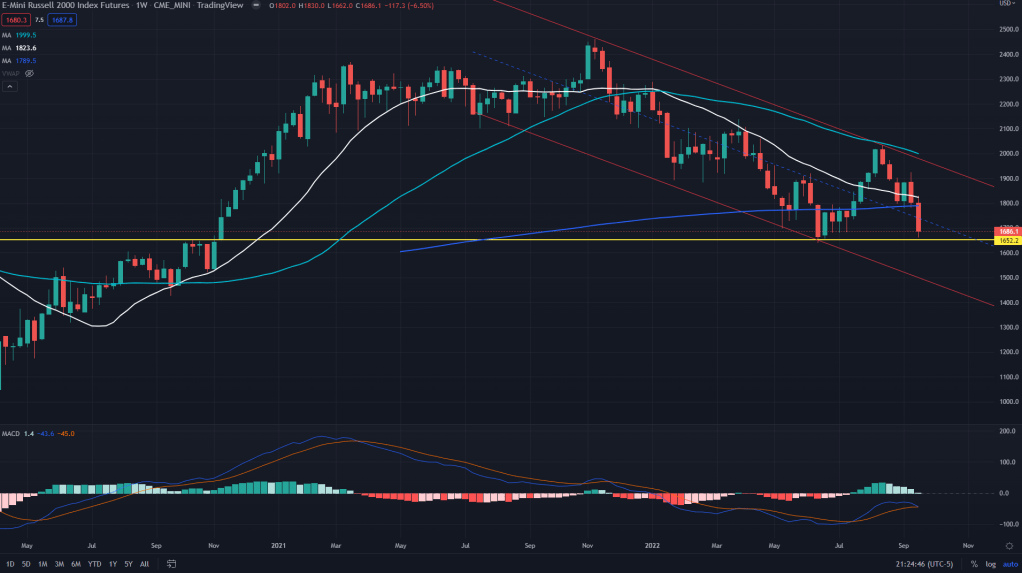
RTY conclusion: The set up on RTY has farther bounce and hence we’re carrying IWM calls of 170. I would expect 1710-20 area where one can enter new shorts along with booking out of IWM calls.
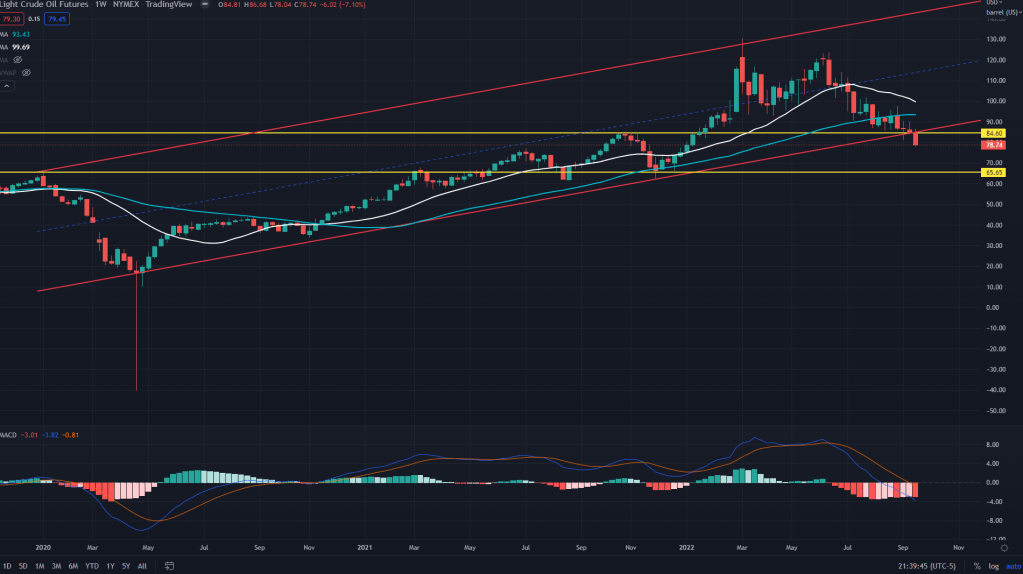
Crude (weekly) – Where I went wrong: I was way too wrong here and market humbled me yet again. Crude broke off the long term channel support along with weekly demand of 84.50. What lies ahead is further pain for the crude bulls (and good news for the consumers and the Fed). Next big support is around 65.50 mark while some small stops in between. I won’t be trading it anymore until I see a better trade.

Leave a comment