Yes, please help me understand what just happened? Did BOE inject liquidity into an economy which has inflation running at 10%? And YET markets rallied! We’ll get into that understanding in another article which I’ll probably write for everyone to read as this one is purely for the subscribers to understand the whys from technical point of view to make a better and informed timely decision. Every Wednesday I have my son’s cricket practice so, I end up writing this on the mobile phone with limited capabilities. Yet, since today is one important day, I would try to be as detailed as I can. Let’s dive in.
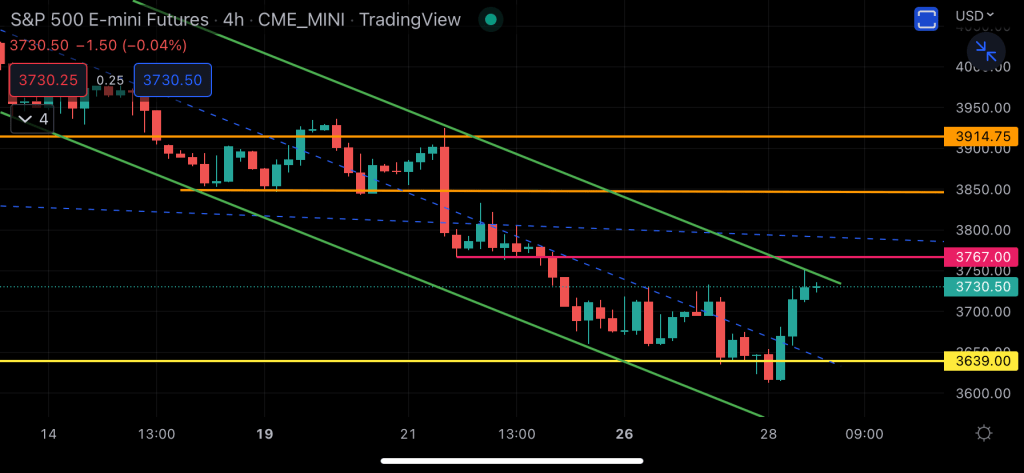
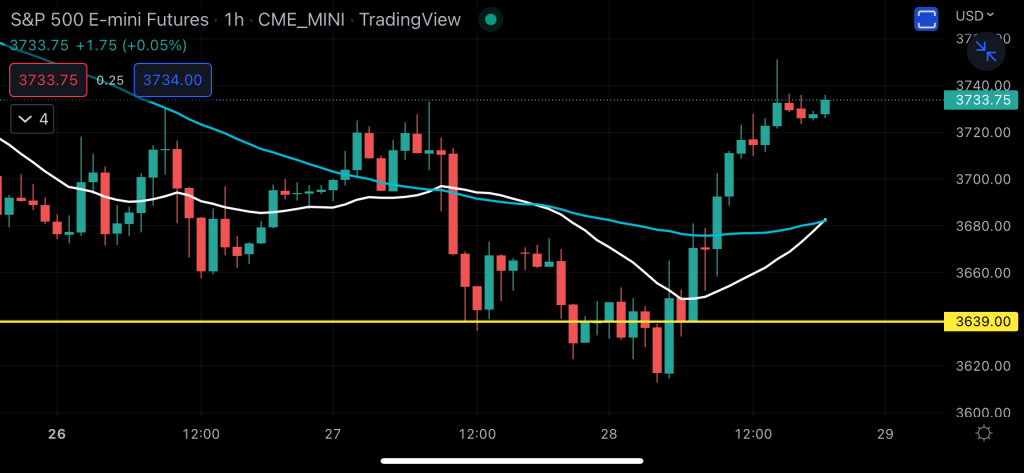
ES (1H, 4H): We went long the ES at 3679 and booked out at 3727. That’s a 48 point run in a market driven by uncertainty. But why did we buy it? We had a small short from yesterday (ES and YM both) which went well overnight and I had my stops trailed which got triggered at 29100 on YM and 3641 on ES. And the rationale for going long was technical as well as fundamental (BOE news). First sign of confirmation was markets sustaining weekly demand of 3639 after failed breakdown. Sustained on 15min, 1H and 4H. Then, I had to wait patiently for the 1H to cross and sustain 50MA while 15 mins to mean revert the 20MA. Which means we missed initial few points of the bounce but it was a confirmation which was important before making an entry. Even on 4H it was racing part 20MA after showing initial hurdles (as the first candle had given up quite a bit before the 2nd one raced past the 20MA. Charts below:
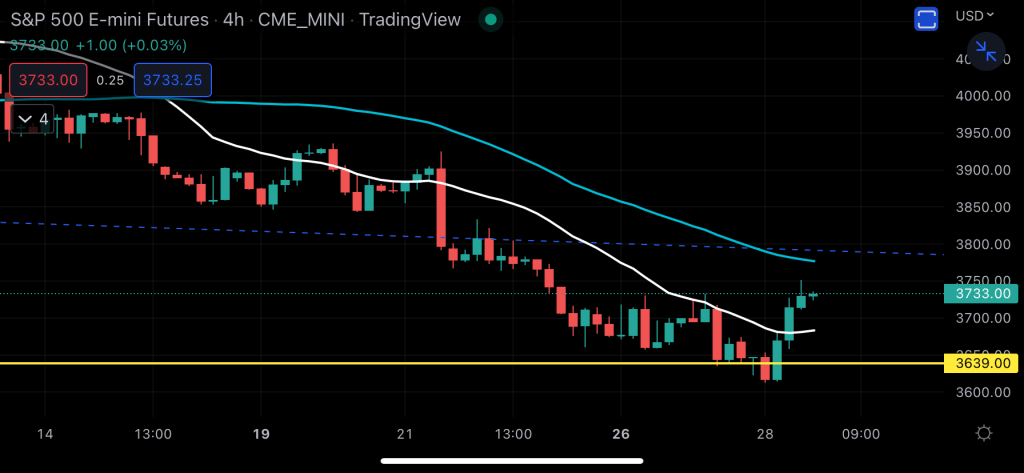
ES (4H): What next? I won’t be a buyer here, nor a seller. Reason? See the 4H chart below – we’re sitting right under the channel resistance and it’s a coin flip call to really go long or short at this moment. Chances are we may head all the way towards the next 4H supply line of 3914 before selling off (even as there are enough resistances in between – in the form of earlier lows bases which it had sold off – shown in pink lines in chart). Equally there also lies a possibility that market realises what BOE did is a far bigger risk for the markets and not something to go gung-ho about and sells off without any further rally.

ES (Daily): That’s a bullish engulfing chart right there. Which again wants us to go buy that right there! I would still wait for the 4H to cross past that upper end of the channel before I hit that button to buy.
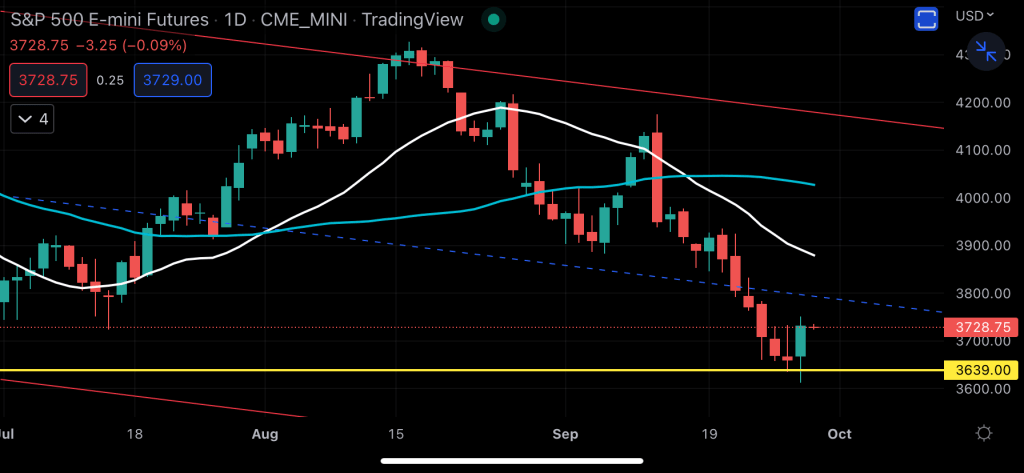
ES (weekly): Makes it all the more interesting – The bounce not just came off the weekly demand, it is also supported by the 200 MA on the weekly. Doesn’t matter how bearish you are, you just can not short into the hole without having proper stops in place there. The bounce today is one big example of why? Two more days for the week to close before we can be sure of what to do next based on this chart. Although, I am still quite sure that the bottom for the market is far from over. In fact today’s BOE event has made me all the more bearish for the long term.
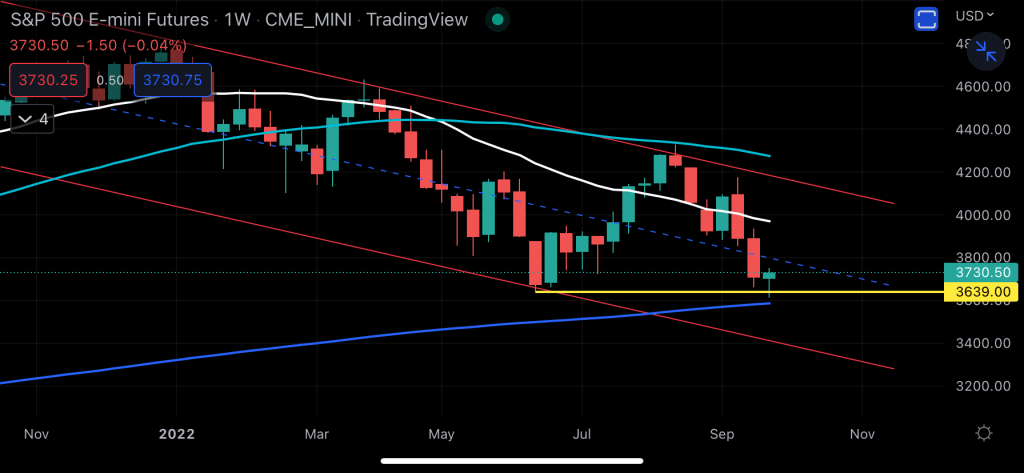
Whether we look at ES, NQ, YM or the RTY.. the patterns are quite similar except in the case of RTY, it is well below 200 weeks MA while YM is just under it. I would certainly keep you guys updated of the further developments, but as of now, we just sit on our hands.

Leave a comment