“I told you so” – There are N umber of people who want to brag about being right about their “prediction” of the way markets are expected to tread in the next moment/day/weeks etc. There was a time even I used to do that. But markets humbled me as many times I felt egoistic about being right. Why am I talking about this today? Because today I am getting the same feeling all over again. Yes my direction of the market has been going right. Yes we are on a winning streak (barring 1-2 calls that went wrong, including XOM 2 weeks ago and IWM in the week gone by). But the more you win, the worse egoistic you get and when you reach that peak of considering yourself indispensable, you get a whack from life (markets) and that whack brings you down terribly. So, by writing this, all I am doing is reminding myself and my readers that lets not get our emotions better of us. Let’s not allow the wins to rule over our heads and the losses drown us into the darkness. Let’s remind ourselves that wins and losses are not THE life. It is part and parcel of what life has to offer us. It is only part of the journey and not the final destination (even the movie final destination has had many more sequels to it!). Because whether you are alive or not, the world won’t stop. The show always goes on and it must. As Elbert Hubbard very famously once said,
“The graveyard is full of people the world couldn’t do without.”
Elbert Hubbard
With that humbling quote, lets dive in and see what our charts are showing us:
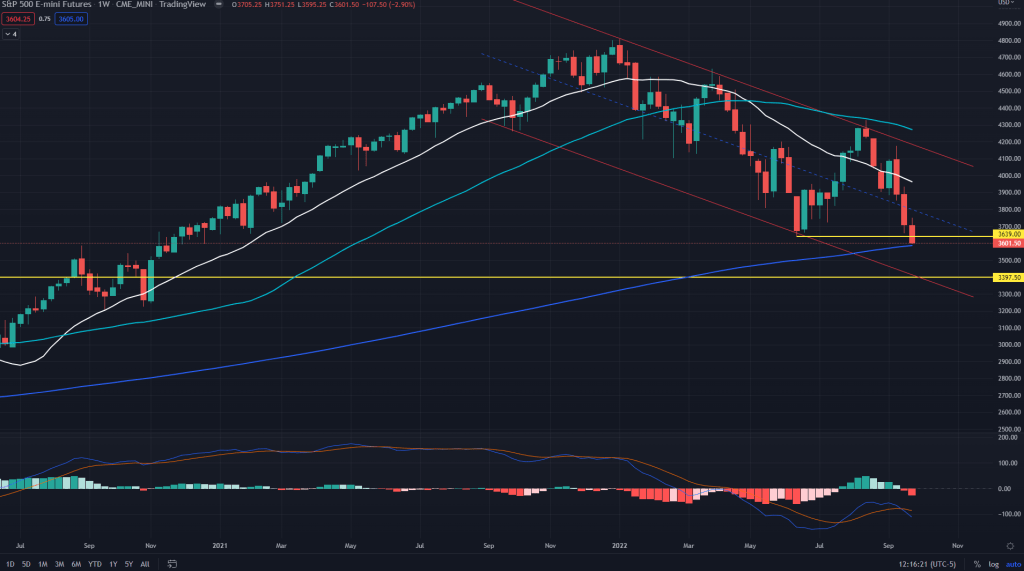
ES (weekly): So far it’s going as expected and what looks likely is some more pain but not far enough. As many a times is the case, 200 days/weeks MAs usually result into a breakdown before bouncing back sharply. Expect similar outcome this time as well. Now whether that would mean we directly heard towards 3395 (THE big weekly demand zone) or shy of that, remains to be seen. I need to reveal one very important aspect today – The real reason why I have been bearish all this while was because of the fact that this bear market has been driven weekly charts (so far) and for the reversal (intermediate) we should at least have some positive divergence on the MACD, for which the sell-off shouldn’t be sharper and the bounces not farther, to make MACD a little shallow and diverge in a positive way. What would that mean for us as traders to react to? That would mean the trades have to be shorter and quicker on both the sides. The short that we have carried on Friday will have to be booked faster from technical perspective (unless all this Credit Suisse and UK pensions related fear/contagion drives us farther lower). And the ensuing bounce we expect would also have to be booked quickly if we ride. Trading the weekly candles isn’t easy because even if the candle just looks one, it has 5 days, 30 Four hourlies, 115 one hourly candles which move in any direction beyond our control before the weekly candle closes.
So what do we see here on the weekly? Broken off the weekly demand and just above the 200 weeks MA and yet to reach our final target of 3395 (~3400) before we analyse again on what lies ahead. Even the final target of 3400 won’t be in a straight line and expect next week itself to be volatile enough without giving us much to do in one single direction. I would expect Monday (or rather the start of futures on Sunday) to be on the subdued mode with negative bias before we start recovering again. For now, lets keep eyes on 3587 as the first level where we would cover our shorts and then see how it goes from there.
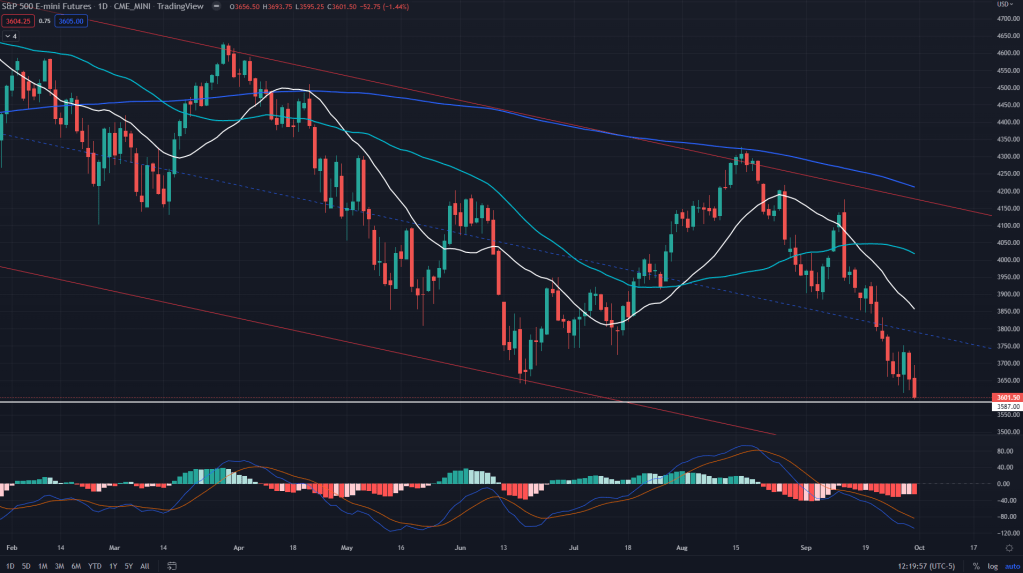
ES (Daily): As posted above, the daily is just above the daily demand line o 3587 and I would expect bears to try and break it once before bulls come back. Expect a fakedown towards 3560-70 odd and swift recovery.
ES (4H): Continues to be driven by this downward sloping channel, but noteworthy is MACD positive divergence and almost always 4H divergences result in sharper bounces and hence expect this time as well.
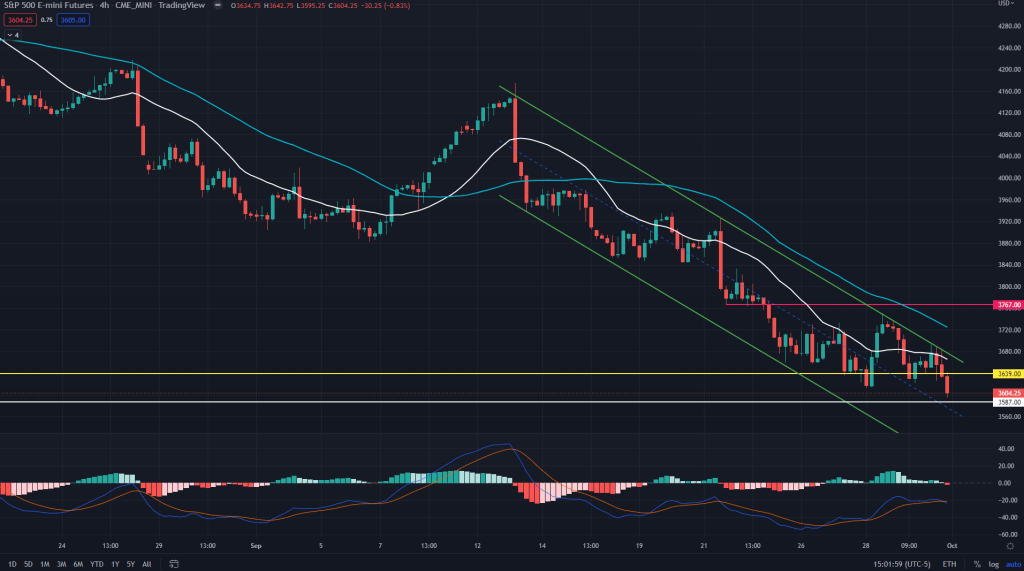
ES conclusion: I am still carrying my short by keeping my weekly charts in mind, but I would cover it up sooner (probably before RTH) as 4H positive divergence and daily demand of 3587 would play key role in a bounce for the bulls.
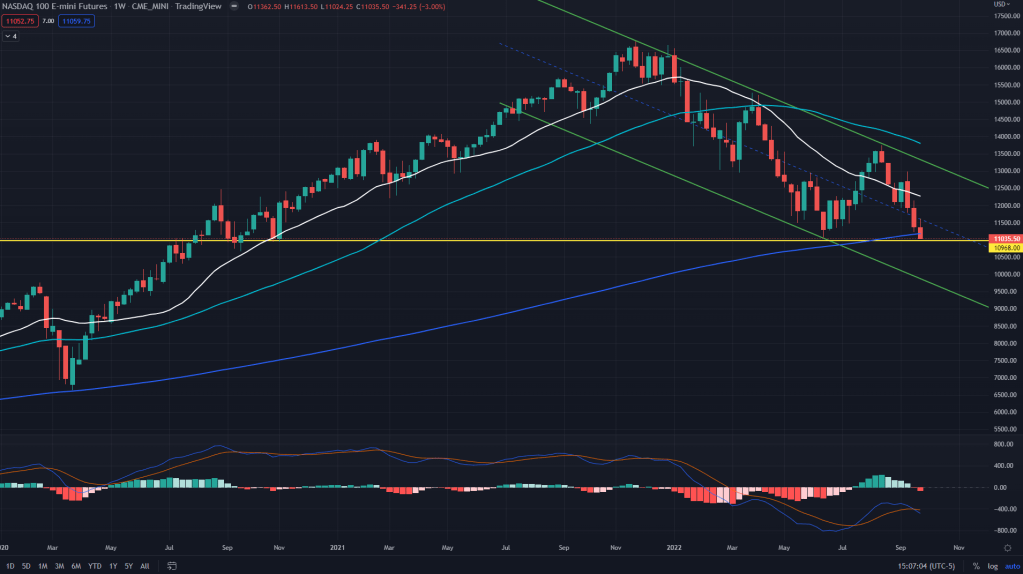
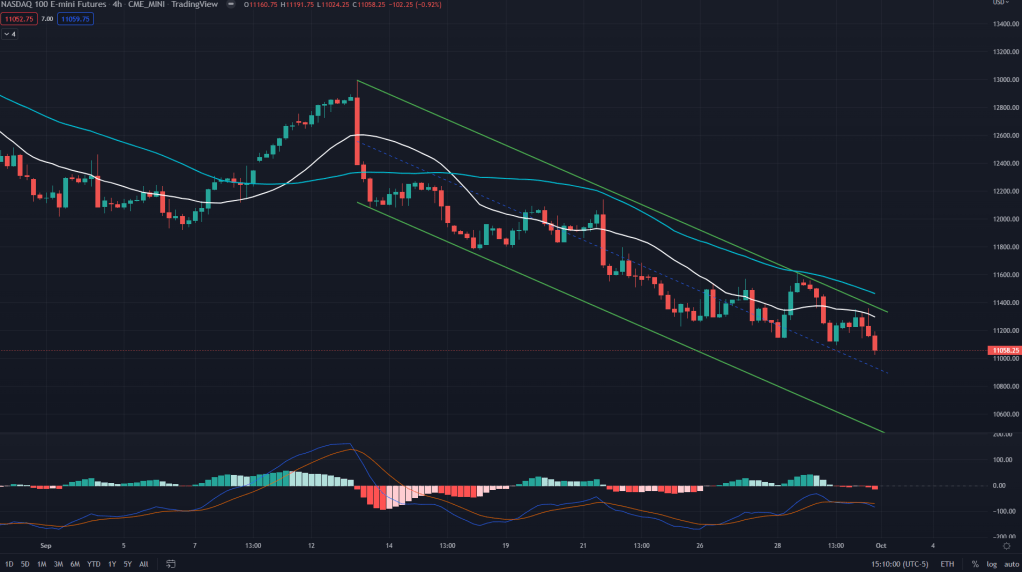
NQ (Weekly): Nothing much different here, except that NQ has already broken past its 200 weeks MA and sitting just above its weekly demand line of 10968, breakdown and bounce would be the theme to watch on tech stocks too. New convincing lower low is yet to be made here as well.
NQ 4H: Positive MACD divergence and driven by downward sloping channel. Some bounce in the offing here too.
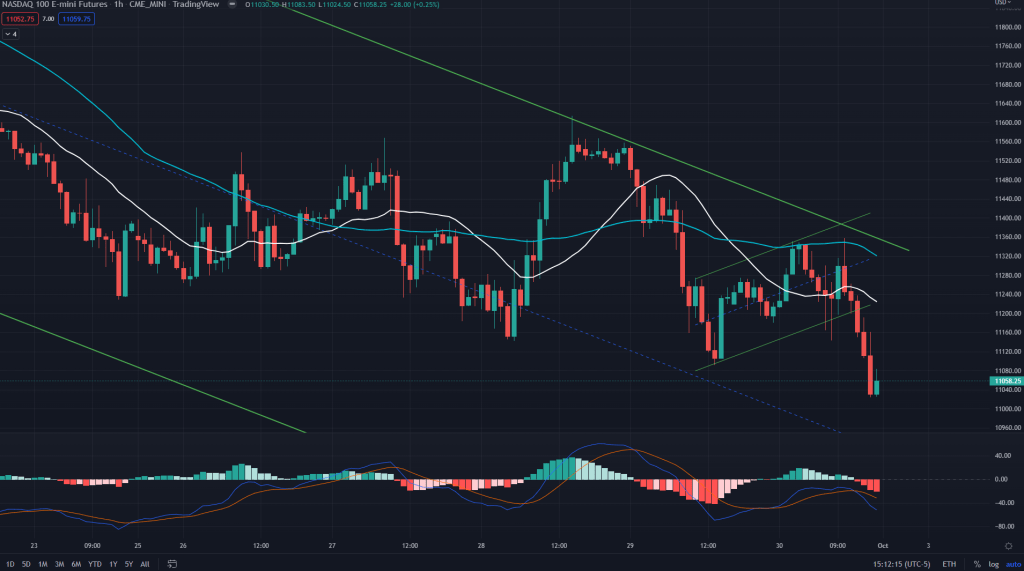
NQ 1H – why we shorted on Friday: Here’s an explanation of why we shorted NQ on Friday during RTH and why we covered. I had shorted it much before I posted on Twitter, based on the bear flag and the resistances in the form of upper end of downward channel and 1H 50SMA all giving enough confidence to short. But for the better trade, it was only wise on my part to give a call to short when it breaks down off the bear flag. We covered when it hit the earlier low and did not want to wait for new lows to come in.
NQ conclusion: I’m expecting NQ to break its weekly demand line too and make a convincing new low before any bounce. We do not have any positions here and I would probably enter a long trade here some time next week.
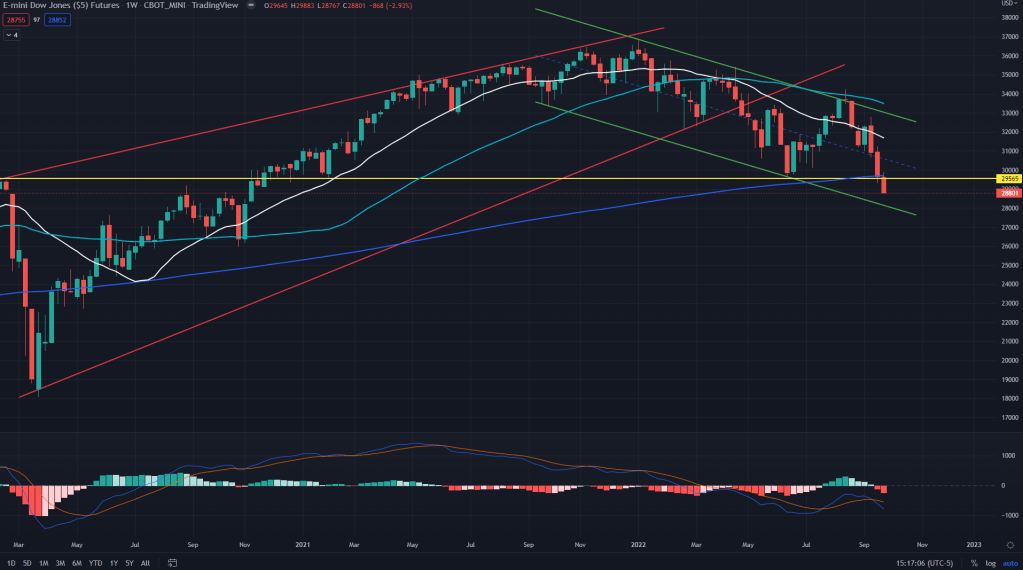
YM (Weekly): In one of my earlier posts I had written about YM driving the next leg down and this is what is visible this time. While ES, NQ and RTY are still around their previous lows, YM is well past its June lows and not far from the channel support line on the weekly.
YM (4H): Positive MACD divergence but still far from calling it a reversal here. We’ll wait before entering a new trade here.
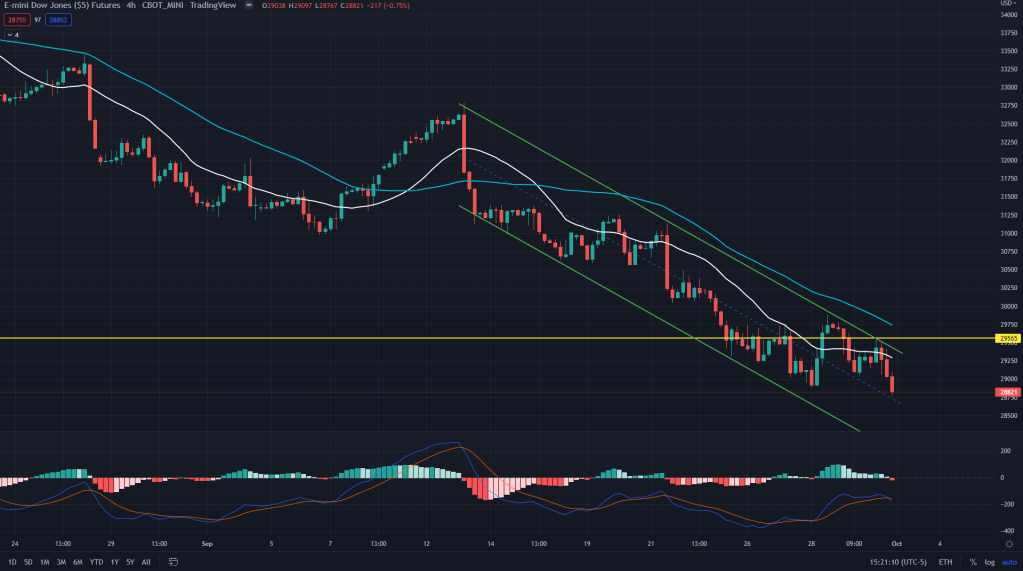
YM conclusion: YM would be the first place where we should expect signs of reversal. I would give a shout out as always so that we are prepared.
RTY (weekly): Not as sharper sell-off last week as others, although way below its 200 weeks MA and not far off the weekly demand. Expect it to break past the weekly demand before recovering sometime next week.
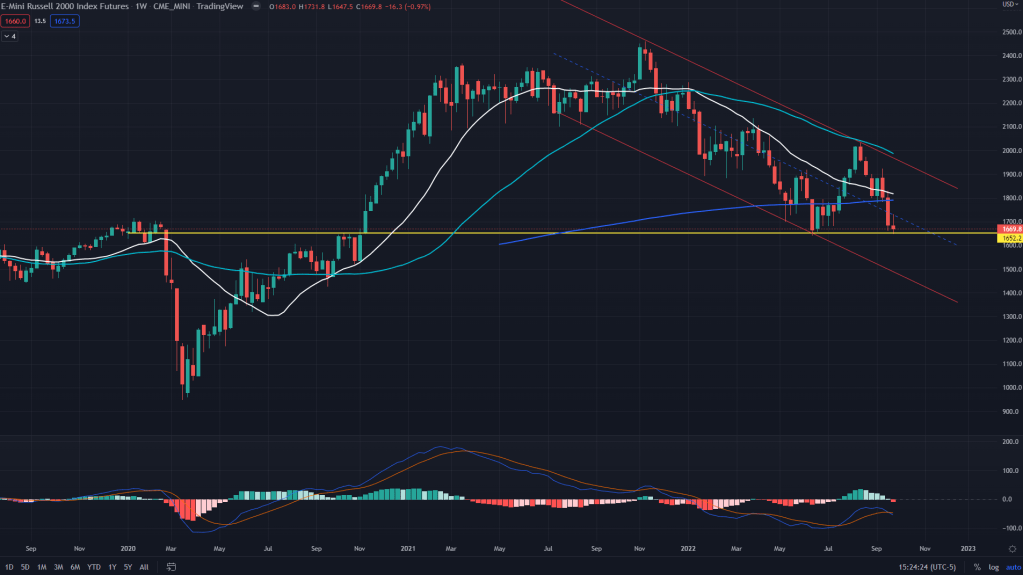
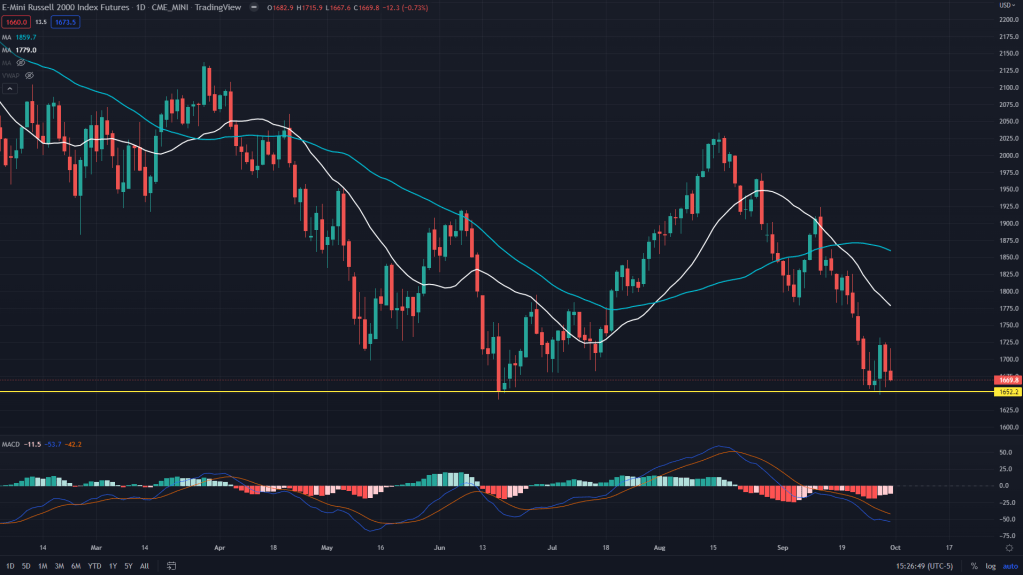
RTY (Daily): While RTY wasn’t hit as hard as others last week, next week would be key if it can hold on? My guess that the next week would be driven by RTY’s sell-off before any recovery.
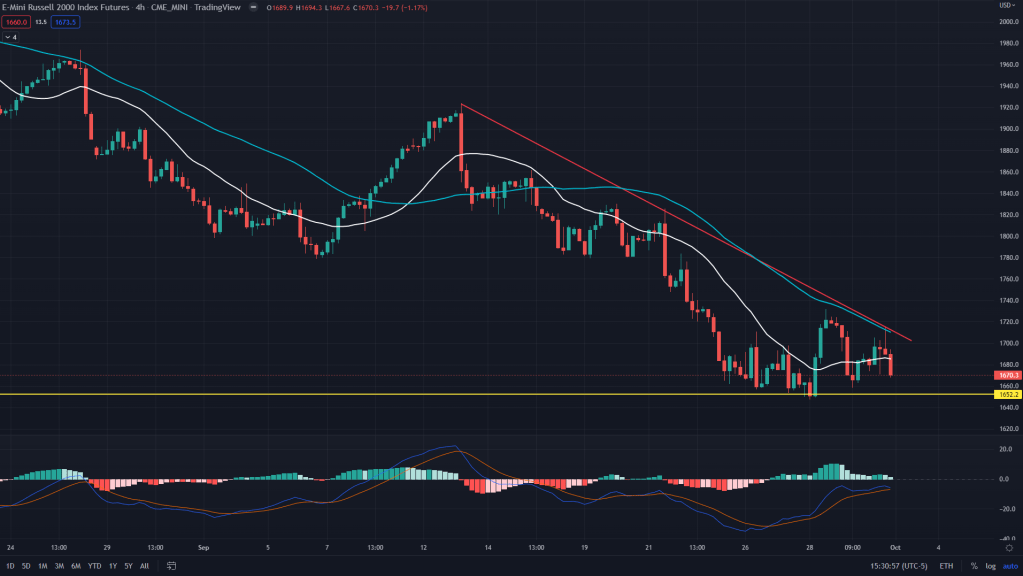
RTY (4H): The charts speak for themselves here.. while MACD is diverging positively, noteworthy (next chart) is the formation of bullish diamond bottom on 4H chart.
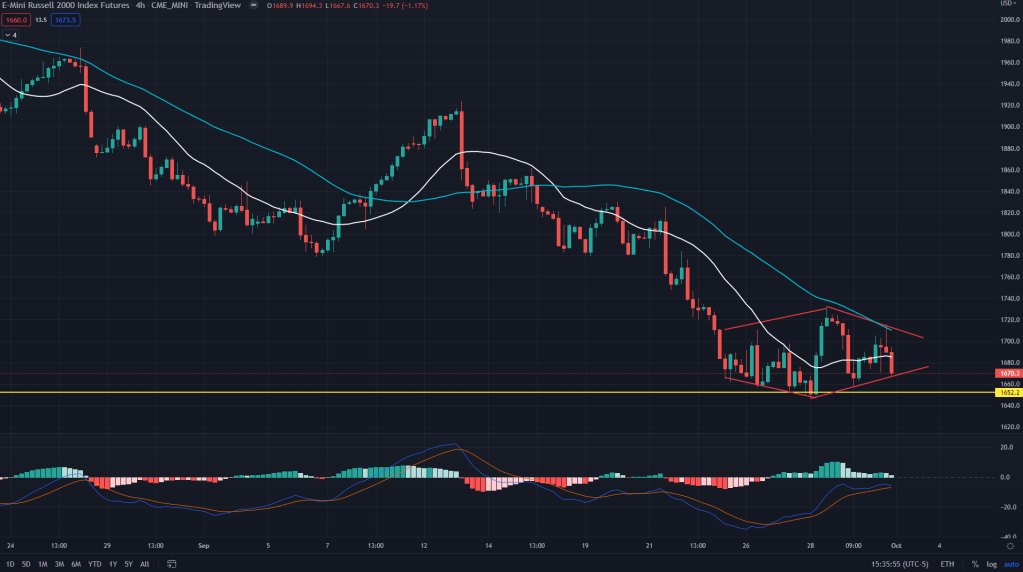
RTY conclusion: In the past RTY has formed quite a few fake diamond bottoms and I would not rely on it unless broken to the upside convincingly. I would rather let my weekly candles to decide which way the wind is blowing.

Leave a comment