In this post, I won’t be delving into the analysis of what happened on Friday with that WSJ article on the Fed’s pause/pivot on rates. That I would most likely cover in the next article. But before I point towards the technicals further just one view – I don’t think this bear market is over. Lets dive in now on what lies ahead:
ES (4H): On Friday we went long at 3728 and here’s a reason why: It was a bull flag breakout after last week’s wedge breakout we saw post CPI. It can’t be a co-incidence. Bad CPI and yet we rallied sharply and then we retrace some of the gains, that bull flags almost all of last week and then we get a breakout taking us exactly where we were early last week.
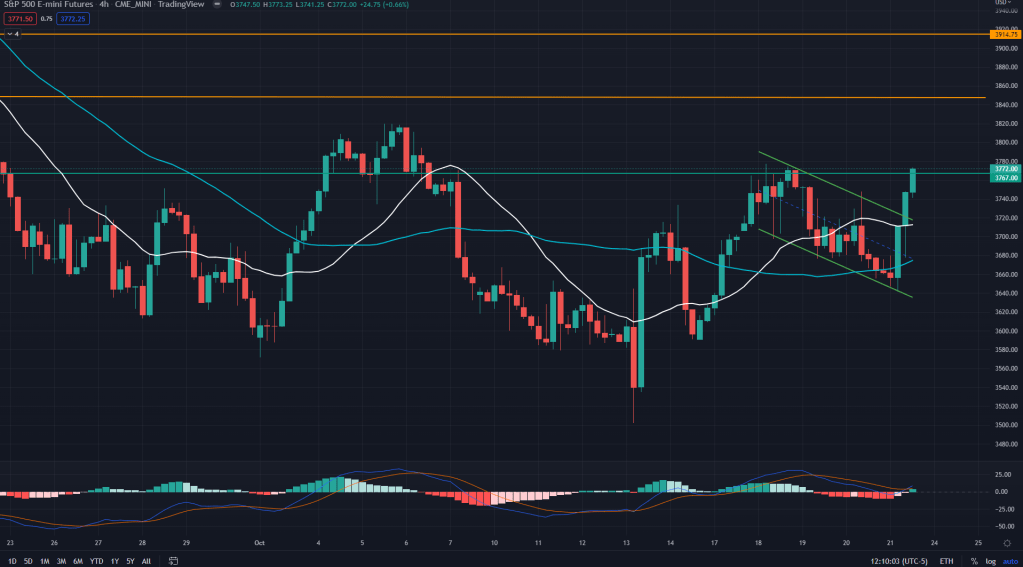
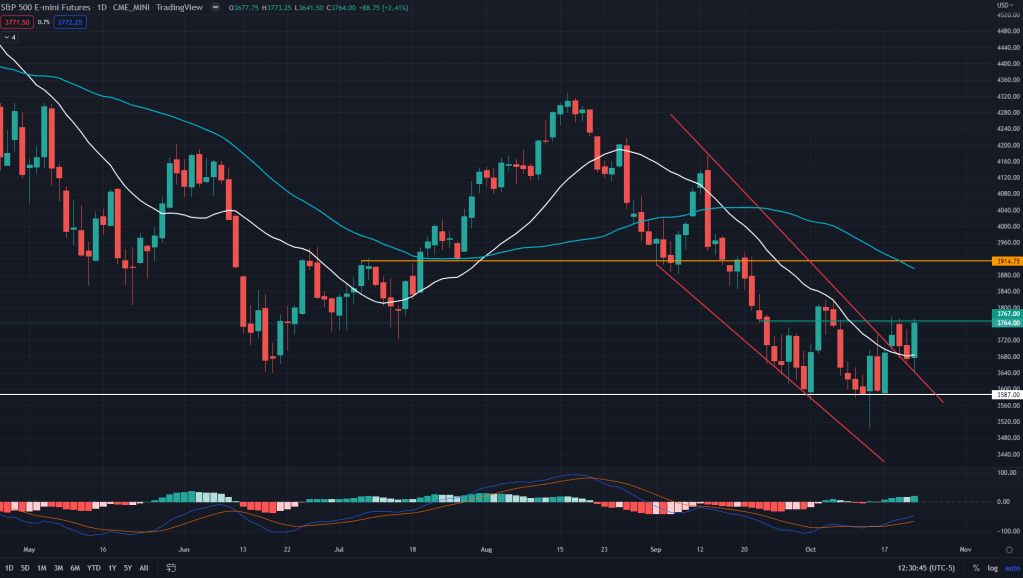
ES (Daily): Zoom out further, the sell-off on Tuesday took us to the backtest of the falling wedge and 20 SMA on the daily and within a day we regained all of those losses of the week, back to where we were early on. Adding fire to the bulls’ arsenal was MACD positive divergence.
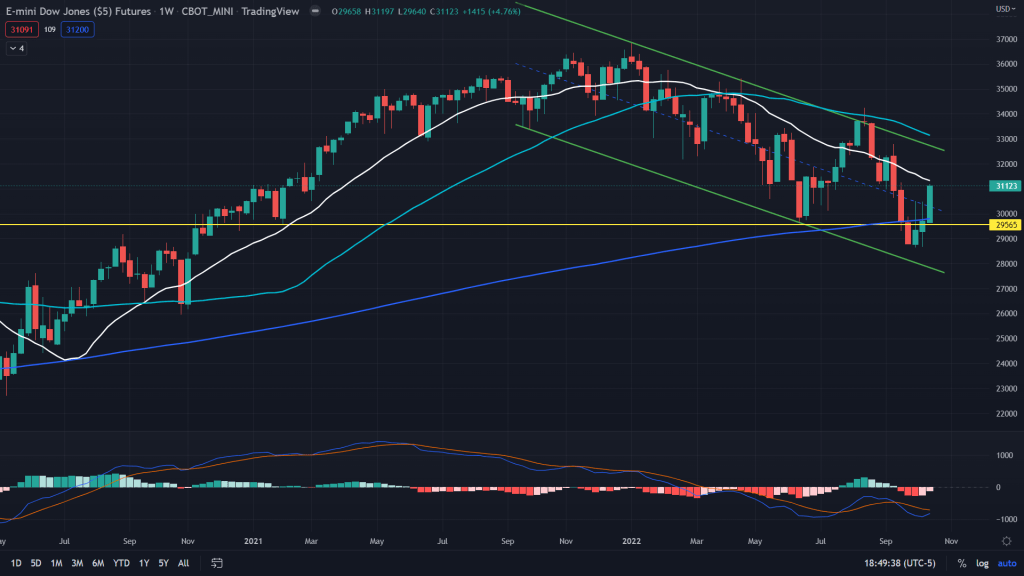
ES (Weekly): Zoom out further, here it shows why we rallied from 3600 – weekly demand, daily demand and 200 weeks MA – When you get so many confluences at one point, there is no way you would get bearish unless there is a strong catalyst.
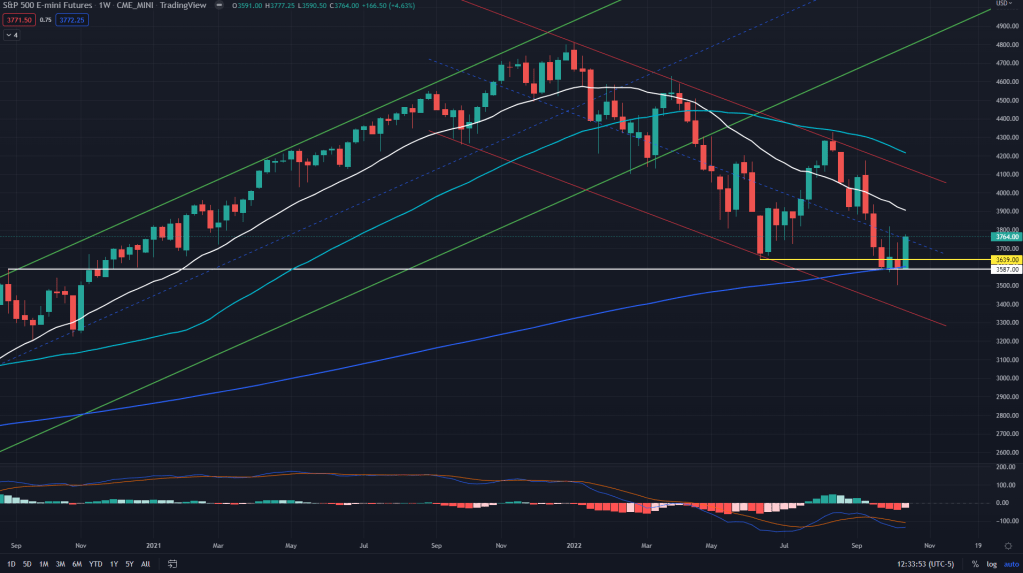
ES conclusion: Don’t stay short anymore until the weekly supply zone comes into play. Rather play the longs into next month. I’ll be hand-holding of course, but in case you don’t find me around for Indian festivity reasons, don’t jump into the shorts yet.
NQ (4H): Another backtest and reversal o the falling wedge, taking us past the 4H supply zone that acted as a strong resistance for the bulls.
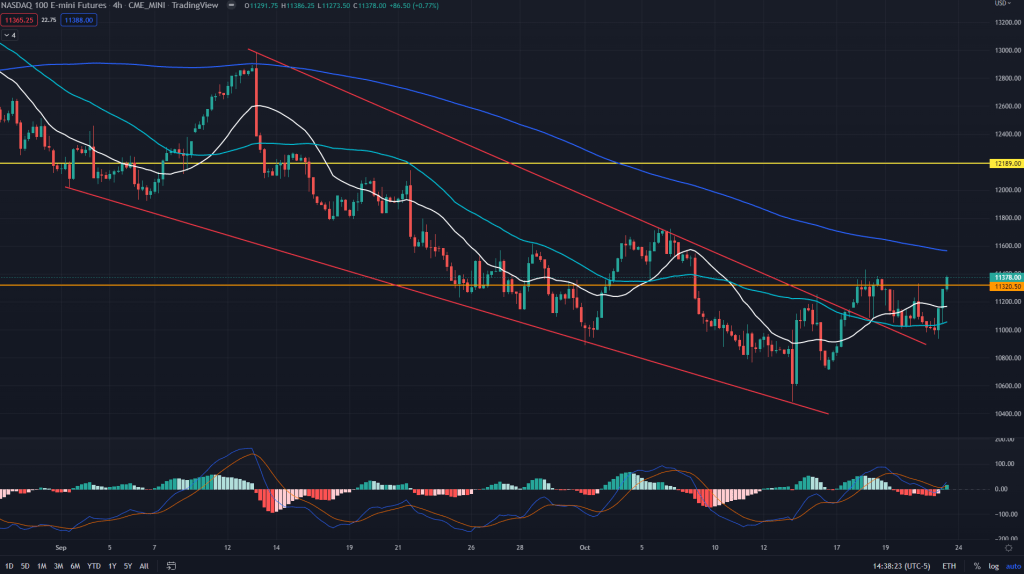
NQ (Daily): Adding to the bulls’ favor was 20 MA (11200) on the daily and weekly demand (10968). Enough for the bulls to take it into their stride.
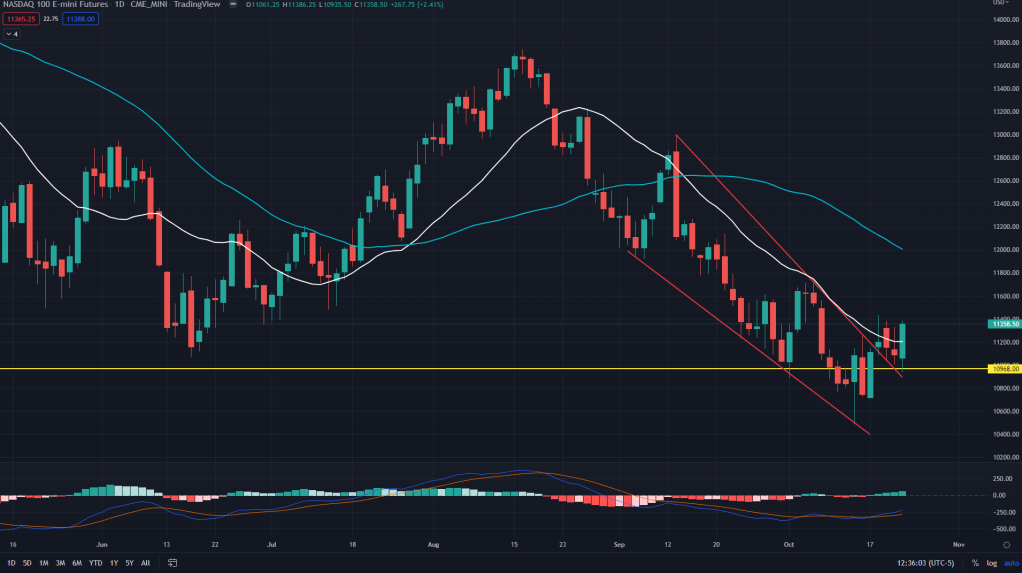
NQ (Weekly): Zoom out further and it was a 200 MA’s weekly false breakdown that worked for the bulls.
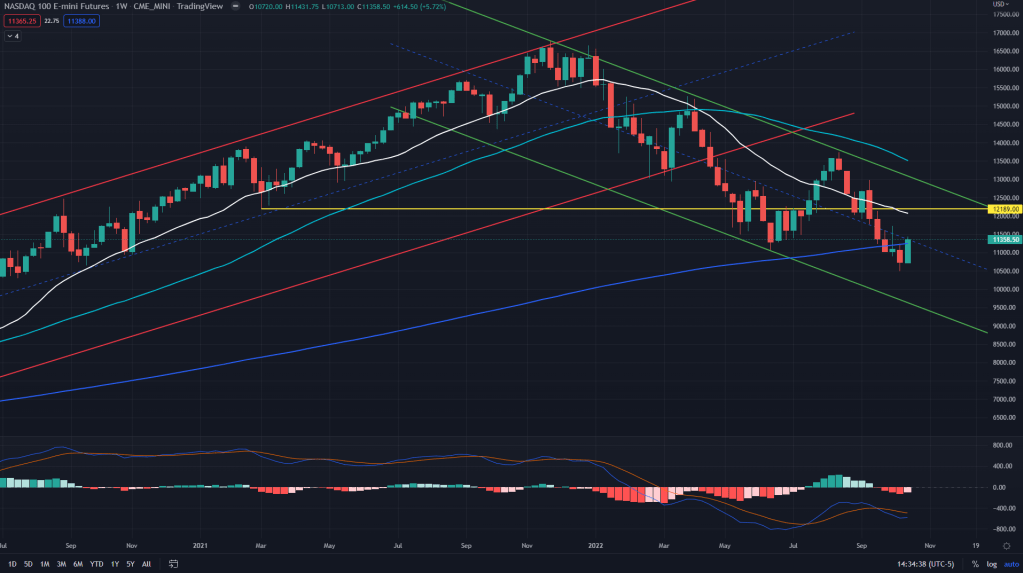
NQ conclusion: One step at a time, we can stay long with 11600 as the first target (4H 200 SMA) and then take it from there. It is likely that we would rally till we see 50 SMA on the daily and/or 20 SMA on the weekly.
YM (4H): That double bottom, diamond bottom of last week and crossover of 4H supply line are clear signs that bulls won’t stop here. They may pause though, we know why in the next chart.
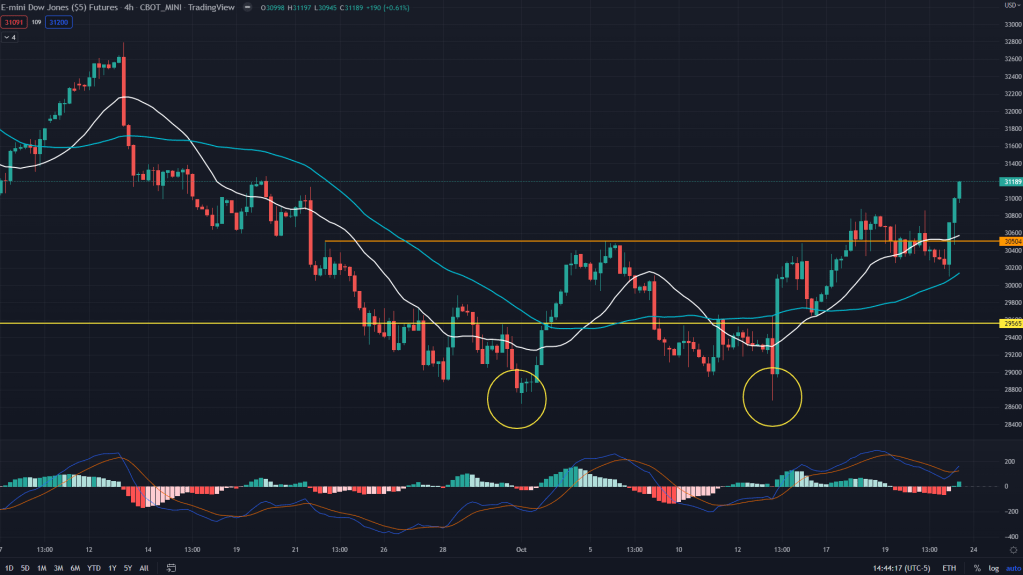
YM (Daily): Daily 20SMA helped after the diamond bottom but we are at 50 days SMA here. Won’t be an easy walk in the park for the YM bulls here.
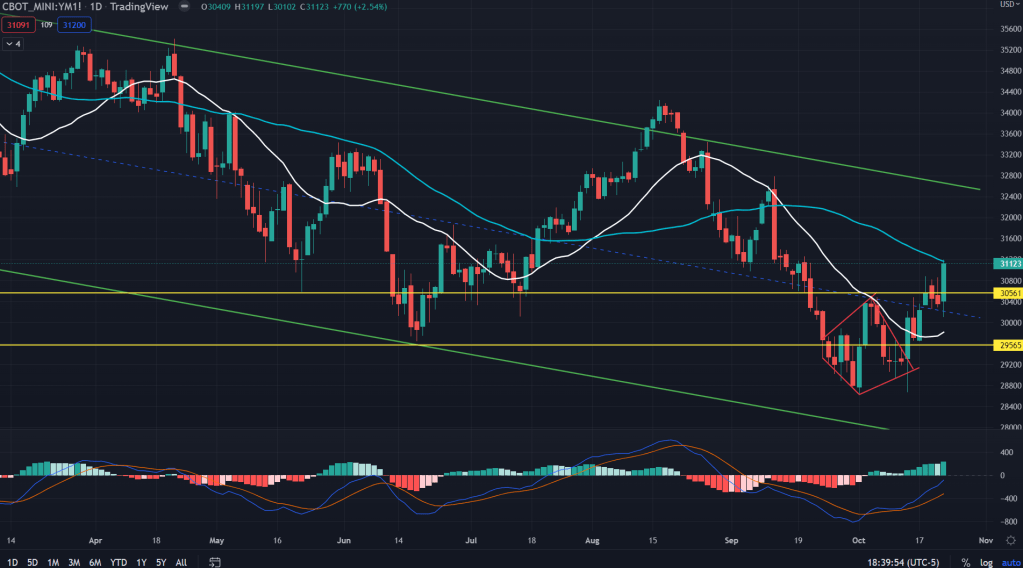
YM (Weekly): When you zoom further, the daily 50 MA co-incides with weekly 20SMA. Phew – Nope, I won’t be bullish on YM unless there is a sustained crossover.
YM conclusion: Not a good place to be long on the industrial index. In fact one can enter into a pair trade – ES long YM short for those who want to make money at the same time stay hedged on the premise – YM underperformance and ES outperformance going ahead.
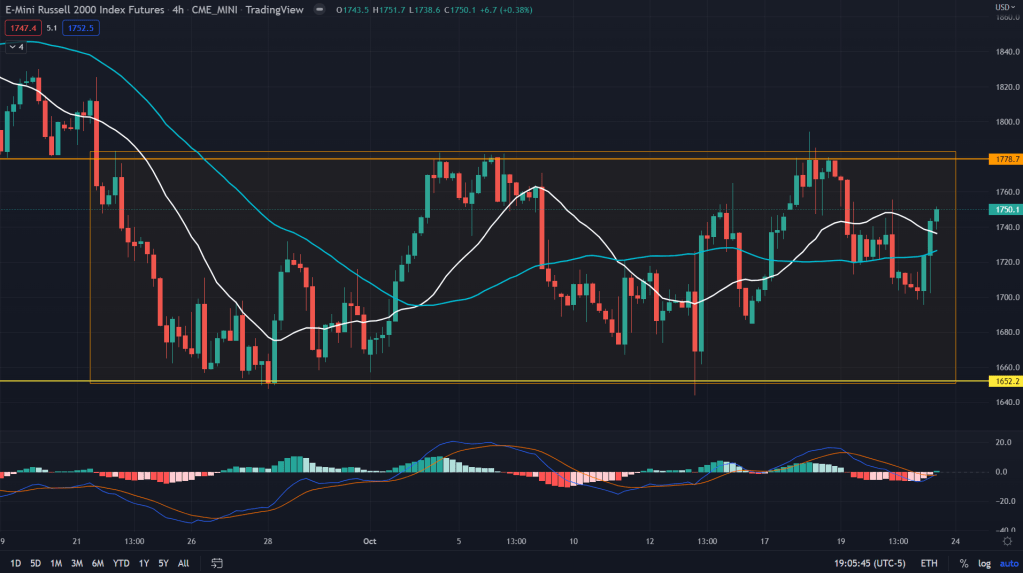
RTY (4H): While we saw astounding rally on Friday, RTY has been chopping within that range – 4H supply overhead and weekly demand underneath.
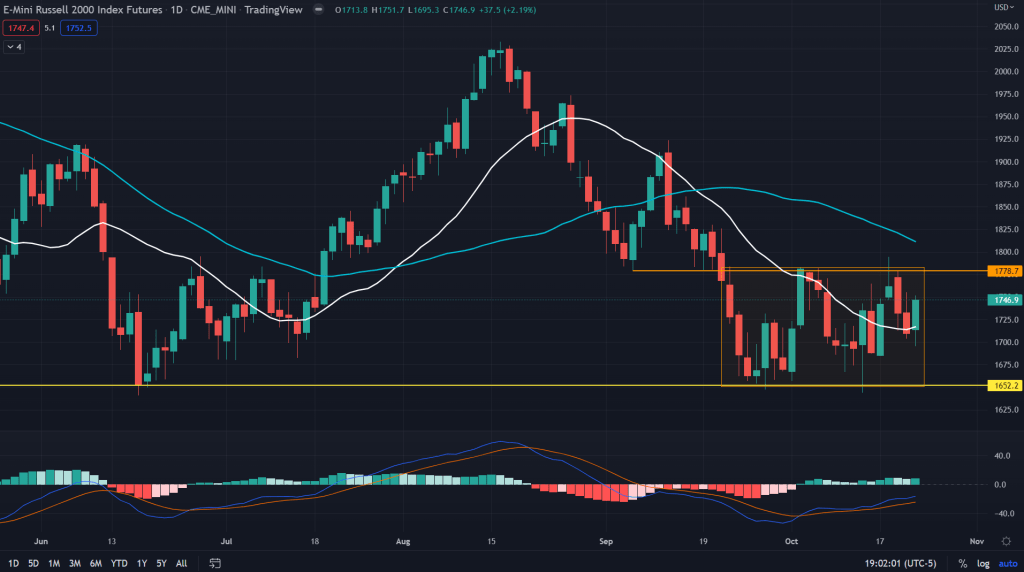
RTY (Daily): End result has been boxed bulls and bears.
RTY (Weekly): Rationale of that boxed range was this weekly demand that is also June low and pre-covid high.
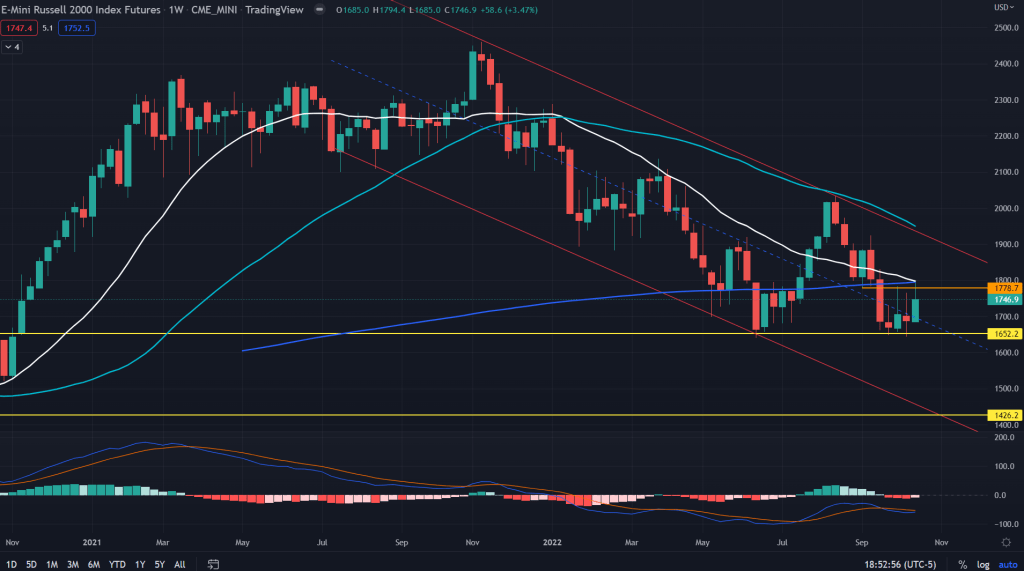
RTY conclusion: Not a right place to be long or short the RTY yet. I would wait for either of these conditions to be met before entering long/short:
For long: 20 weeks MA to be crossed and sustained for a week
For shorts: Upper end of the channel (red and co-inciding with 50 weeks MA) or breakdown of the weekly demand underneath.

Leave a comment