Yes we expected this bull run to go for a while, but there was no way anyone could predict the pace of it. This is getting surreal and leading upto the FOMC, it really gets all the more nerve-wrecking. Let’s take a quick drive through the technical lane:
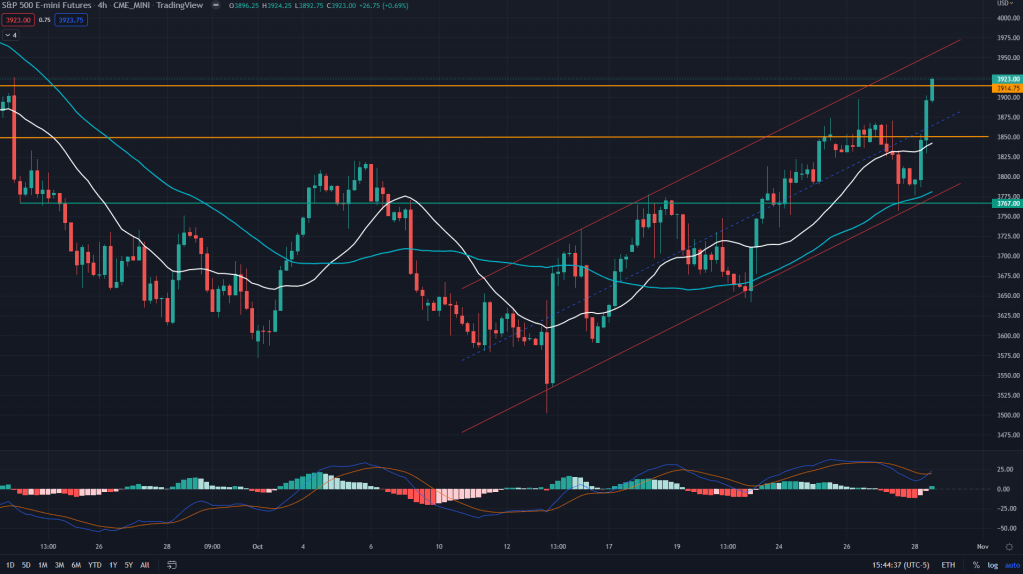
ES (4H): Ever since the CPI low of 3510, ES is running up in a rising channel on 4H, one can even call it a bear flag. But given the pace and nature of this leg, I won’t be surprised to see ES piercing past the channel on the way up. Does that mean the bear market is over already? Too early to call from macro and technical point of view.
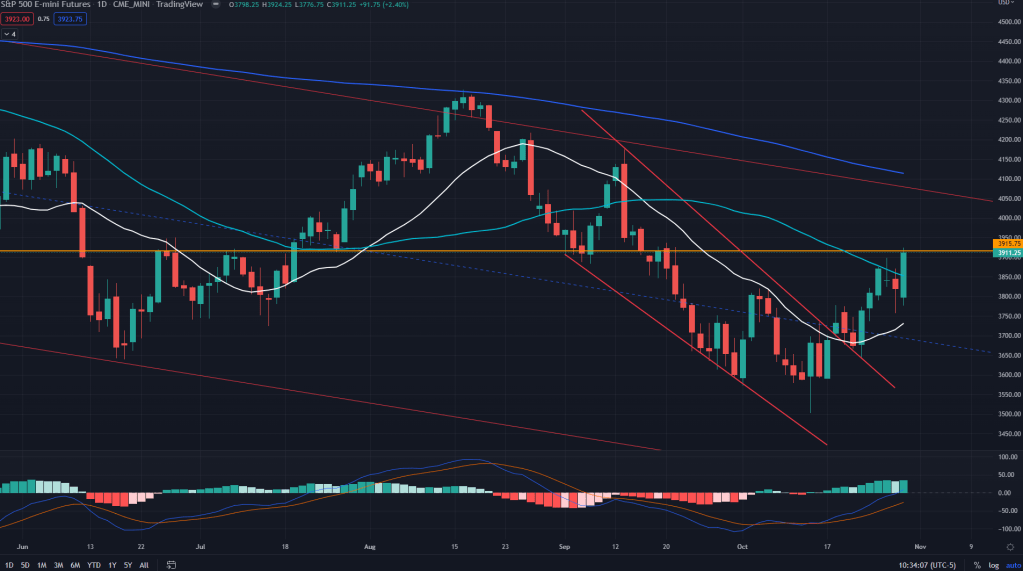
ES (Daily): Ever since ES broke out of this falling wedge, it has been consistently rising up, crossing past key 20 and 50 SMAs on the daily but stalling right at the 4H and daily supply line of 3915.
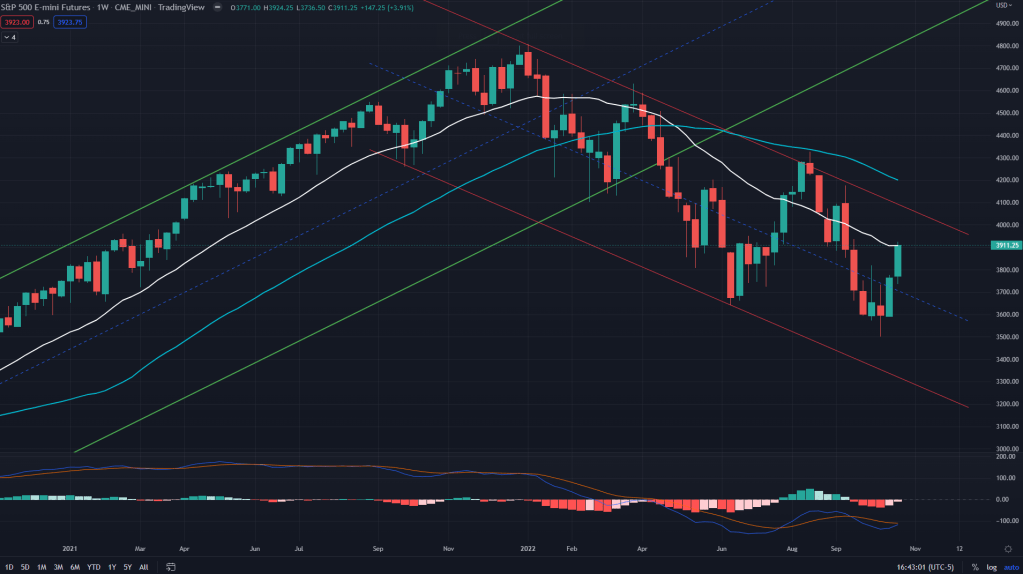
ES (Weekly): On the weekly charts too, the price is right under the weekly 20 SMA. But here’s one key point which I have been pointing to in the previous notes too – MACD’s positive divergence. While that alone can’t be a reason to be bullish. It certainly isn’t reason to stay bearish for long.
ES conclusion: I won’t be initiating any position in ES as of now, there can be intra day positions based on the how price reacts in a particular day, but certainly not a time to be positional long or short at this point.
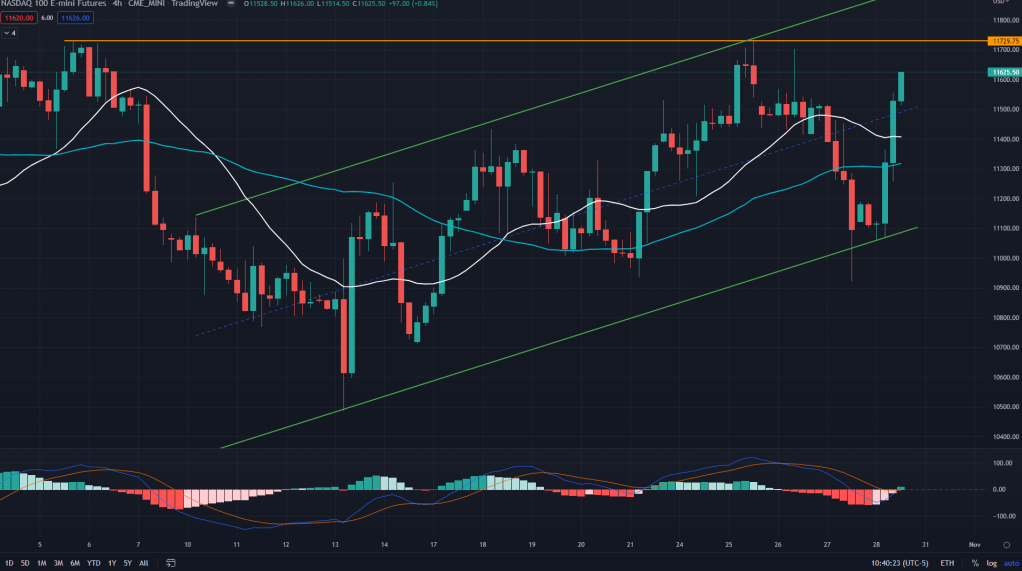
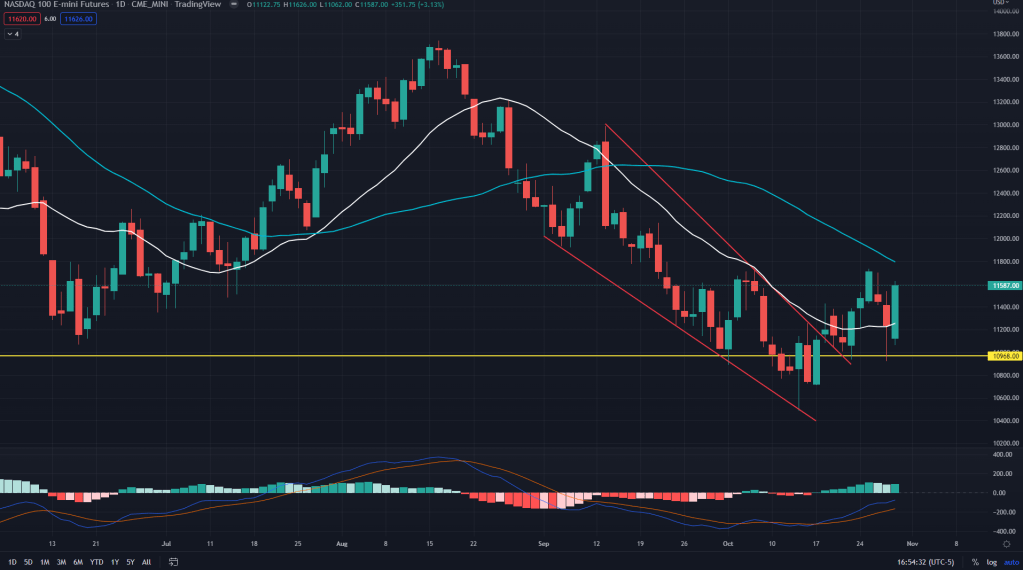
NQ (4H): NQ too has a similar story going for it: rising in this parallel channel on 4H and just under the 4H supply line of 11730.
NQ (Daily): On the daily, while bulls have been able to capture the 20 MA, it is still well under the 50 and there would be price pressure on the downside unless bulls can decisively cross past the 50 MA.
NQ (Weekly): On the weekly it is still well under the 20 weeks MA and the weekly supply line of 12189. Bears will keep coming up with their onslaughts unless decisive cross past the 20 weeks MA and the supply line. Bulls though have a solace from positively diverged MACD and 200 weeks MA.
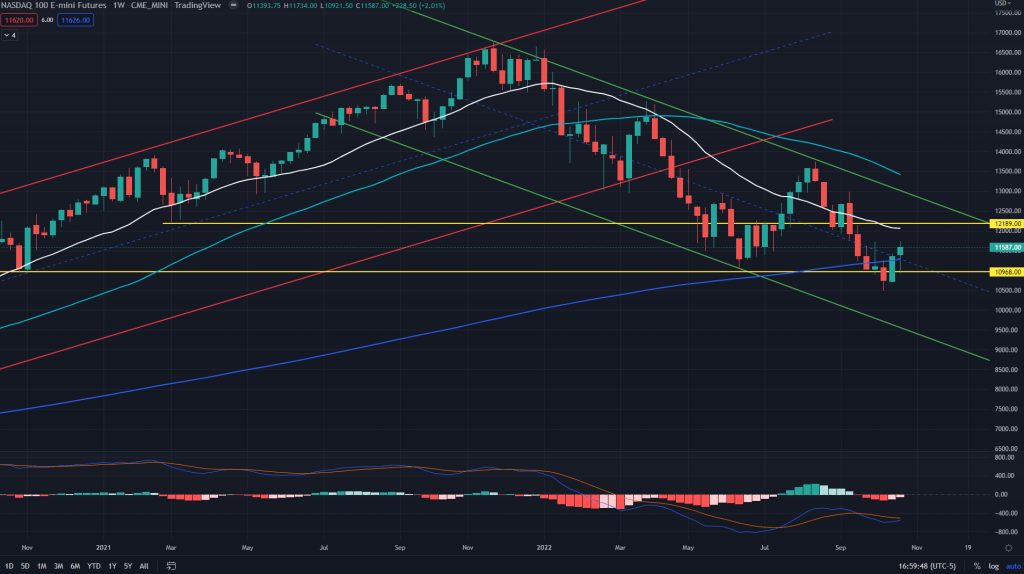
NQ conclusion: Probably the only place where one can stay long at the start of the week is NQ. It has been underperforming the other key futures, but the momentum has diverged positively and there is still some space for the bulls to run before they hit supply zones.
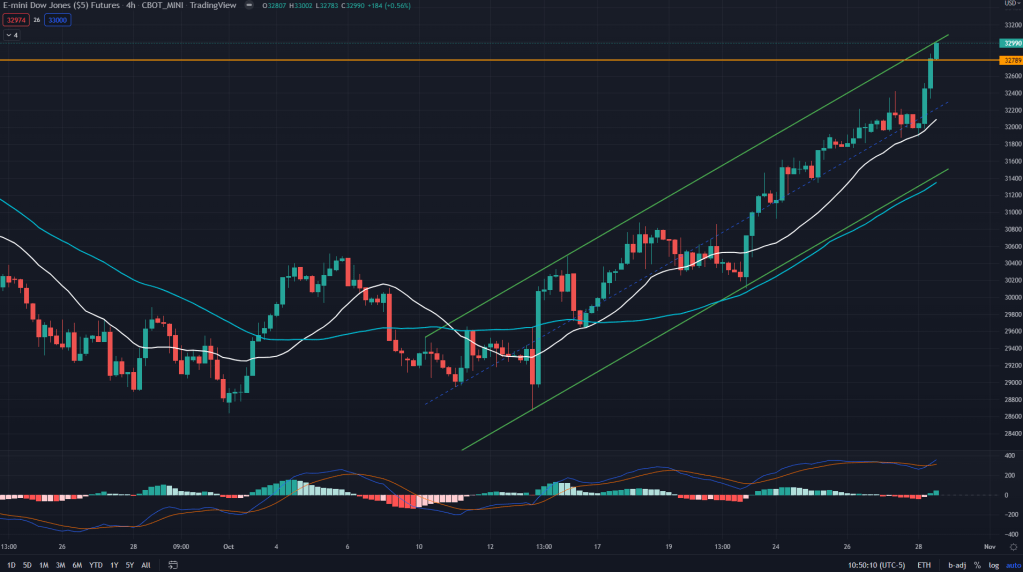
YM (4H): Clear outperformer in this leg of the rally has been the Dow Industrial Index – which means industrial and commodity stocks are having their best time in this leg of the run. Remember XOM where I went wrong earlier? It has been positively surprising everyone with price reaching 110 currently. Coming back to YM, not a right time to stay long in the short term – just under the upper end of this rising channel.
YM (Daily): On the daily, however, it has been relentless rise of the YM bulls and look where we are – just above the falling channel that has been the key driver for the bears all through this year and the only index that has closed past its 200 days MA after a long time.
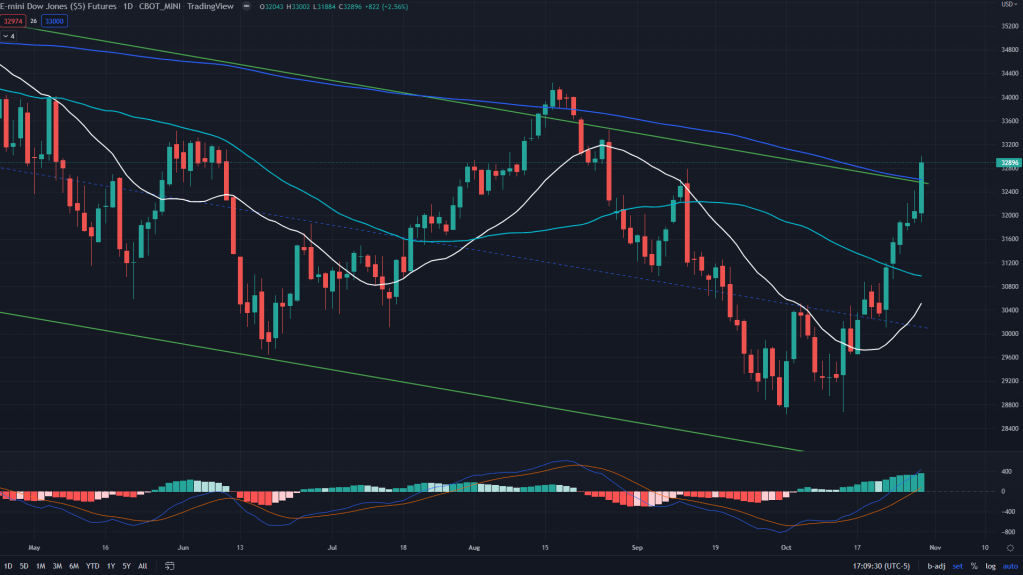
YM (Weekly): Zoom out – And no, its certainly not a time to be uber bullish on YM at current prices. Right under the 50 weeks MA and closed just within this weekly supply zone of 32800-33300.
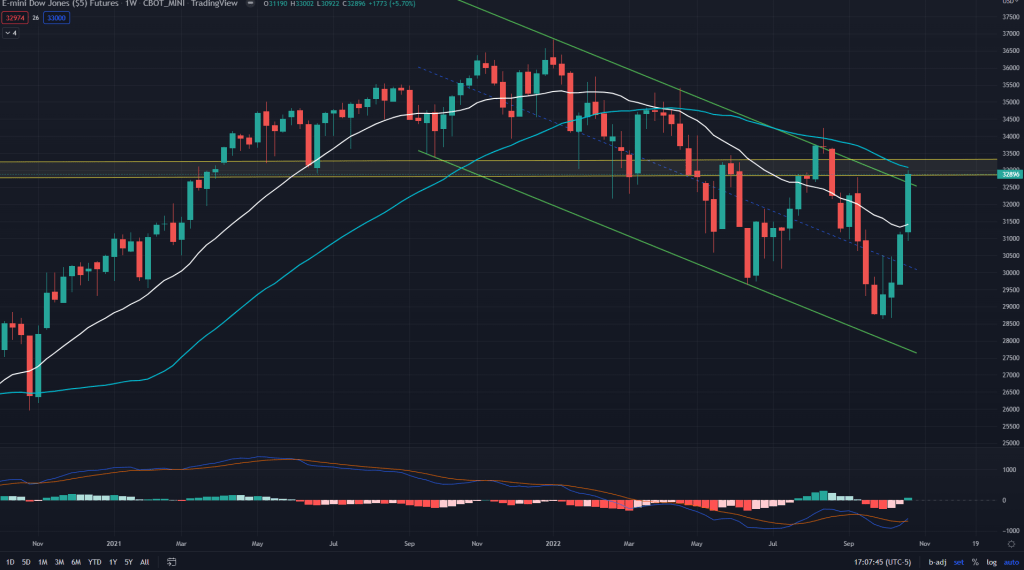
YM conclusion: Certainly not a time to continue to stay bullish on the industrial stocks when you have all the key variables pointing to supplies overhead – 200 days MA, weekly supply zone, 50 weeks MA and 4H channel resistance. I may even nibble into a short on Monday.
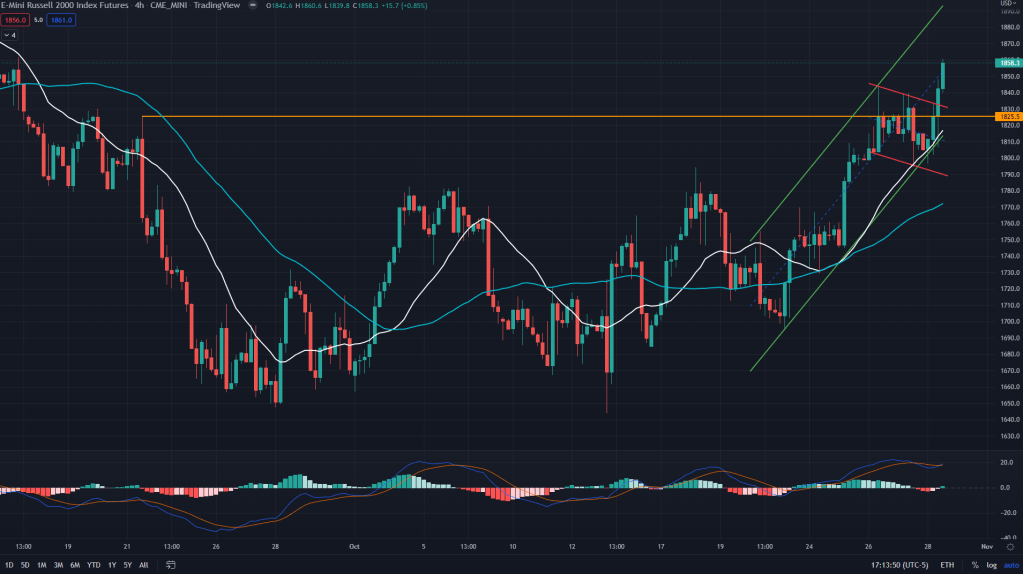
RTY (4H): We entered short on IWM based on this 4H supply line 1825, last week. While the price is well past this, but there are other reasons why I am still holding on to those IWM puts (and have added more).
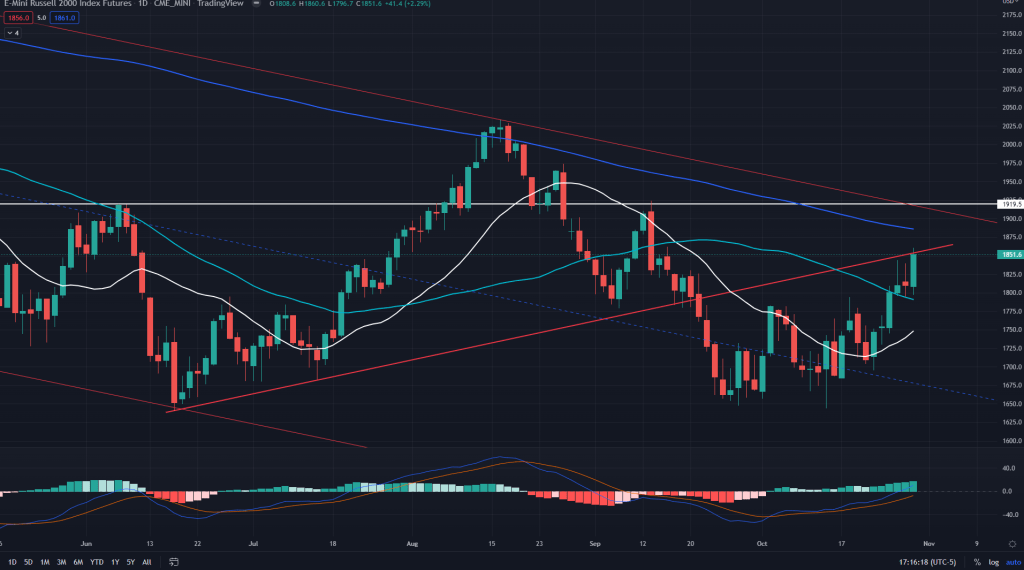
RTY (Daily): RTY crossed just under this key trendline resistance and there are spate of other key levels where it won’t be easy to cross past – 200 days MA right above this trendline and then there is daily supply line and resistance in the form of the falling channel.
RTY (Weekly): On the weekly though, comfortably above the 20 weeks MA and 200 weeks MA too, while momentum diverges positively.
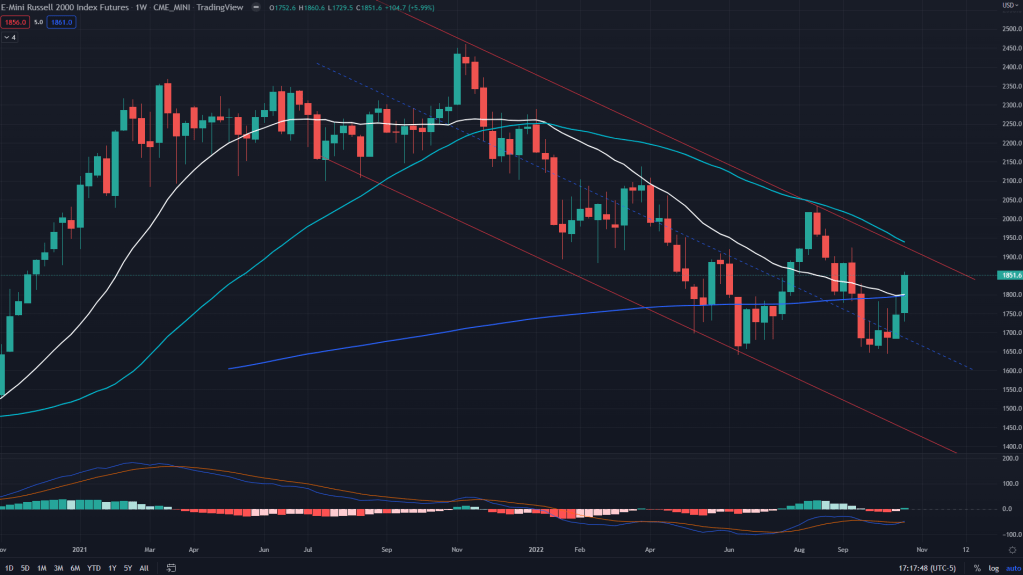
RTY conclusion: Again, not a time to stay long the IWM and RTY here with 4H and daily having enough resistances overhead.

Leave a comment