Pivot? Pause? Nope, just not yet. While markets rallied all of last 2 weeks on hopes that the Fed would oblige by getting rid of hawkish stance on the rates and inflation and may even slow down the pace of rate hikes, but what it got was a negative shock that resulted into bulls tripping down and bears were on the prowl all over again. What happens next from technical perspective? Let’s dive in.
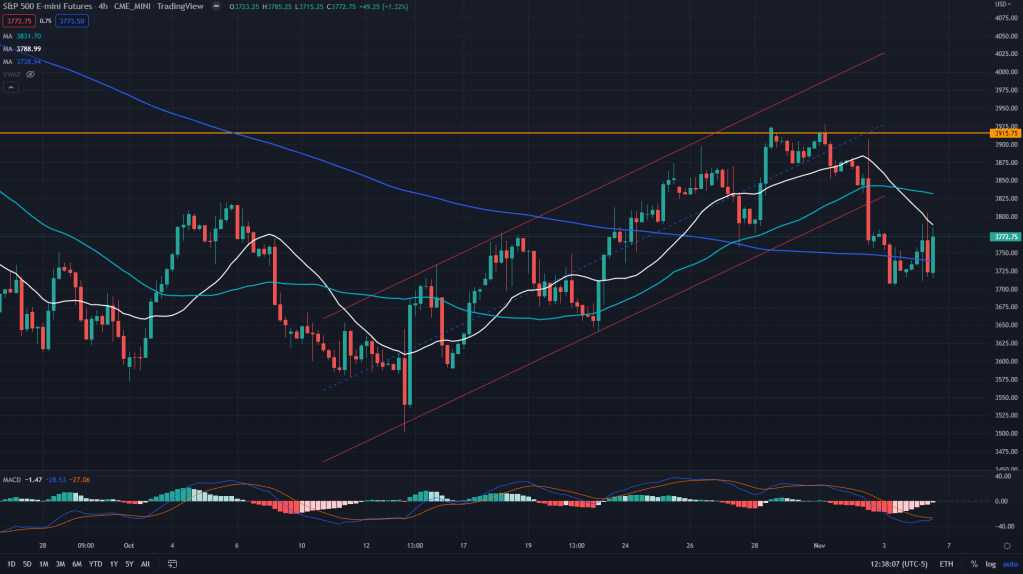
ES (4H): That channel breakdown on 4H candle resulted into swift and sharp move lower until 200 4H MA came at the rescue of the bulls, but the bounce couldn’t take bulls past 20 and 50 MAs on 4H just yet.
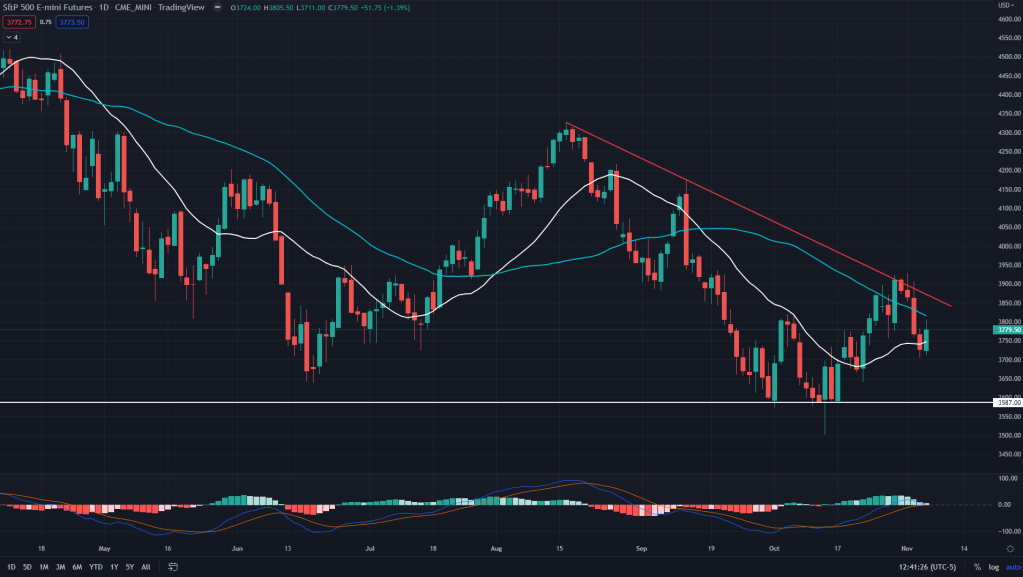
ES (Daily): Zoom out, its yet another task for the bulls to cross past – trendline resistance, 50 MA. Although, for now they have been able to take solace from 20 MA. But how long?
ES (Weekly): Zoom further out – Nope, bulls aren’t safe yet. While the bounce of the previous two weeks was off 200 weeks MA, inability to cross past the 20 weeks MA itself is a tell-tale.
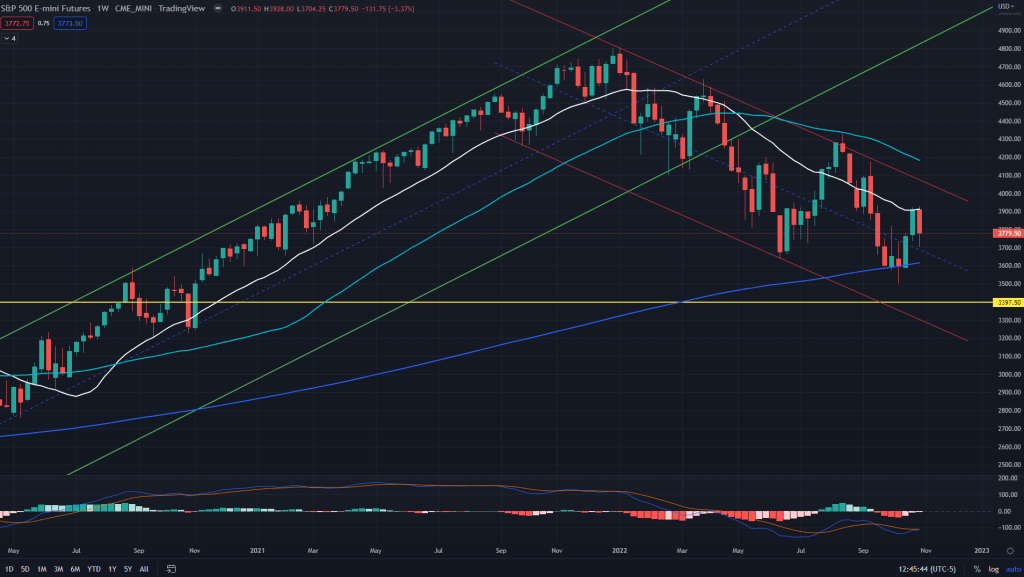
ES conclusion: 4H, daily and weekly – all the MAs are in support of the bears to continue their onslaught of the bulls. The only thing that’s in bulls’ favor – positively diverged MACD. I would continue to hold shorts as long as we’re below 20 weeks MA for now.
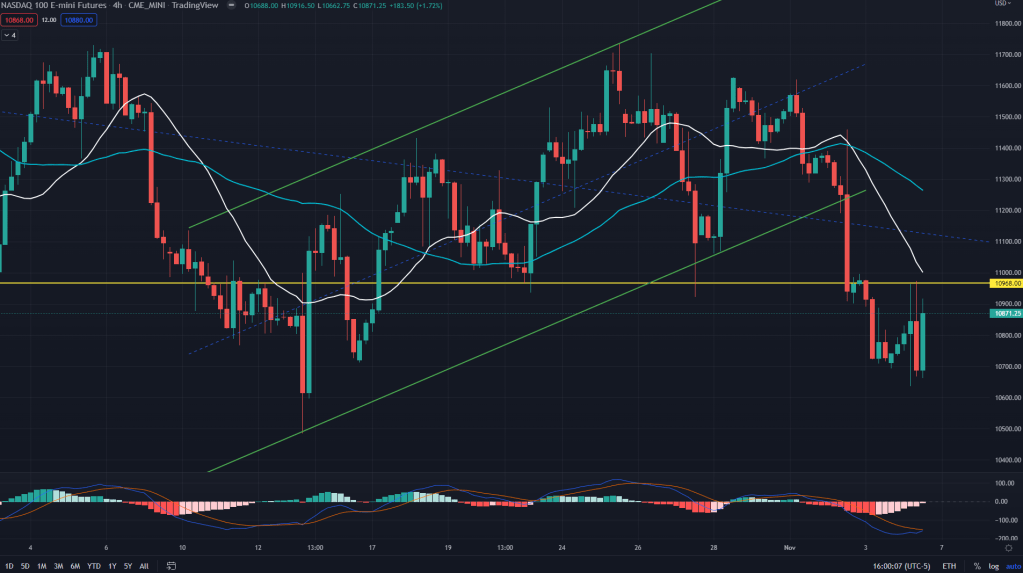
NQ (4H): Similar story with NQ as well, broke down off the rising channel, sold off hard, rallied a bit and retracted again from 20SMA on 4H and weekly demand/supply line.
NQ (Daily): The rally of the previous week resulted into the price rallying towards 50SMA on the daily and right upto this resistance line and retracing almost to the new lows and below weekly supply.
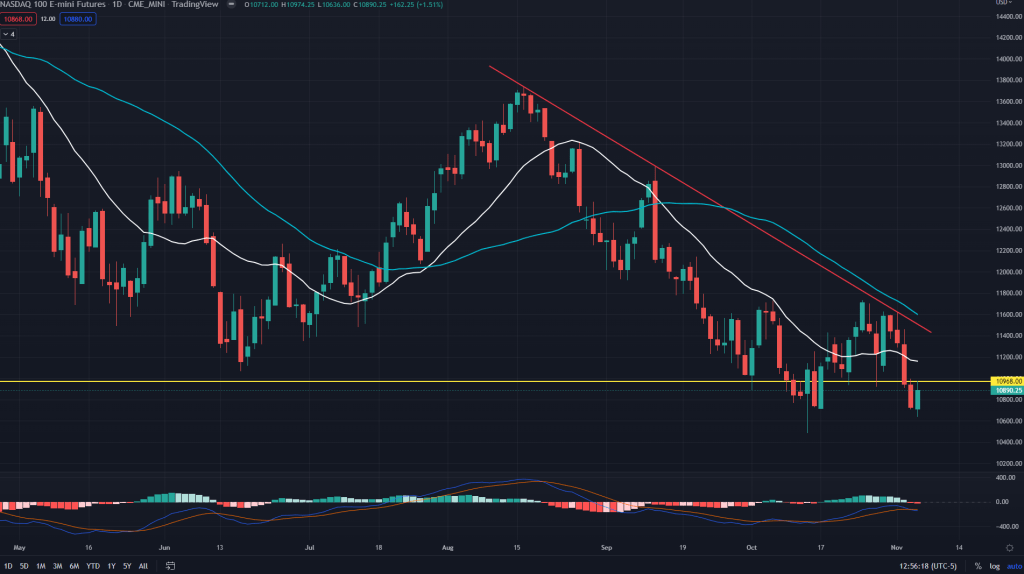
NQ (Weekly): On the weekly, it has been all about the 200 weeks MA for the last 6 weeks. If it had to bounce and sustain this, it would have by now. Which means in the coming weeks we should see NQ selling off harder.
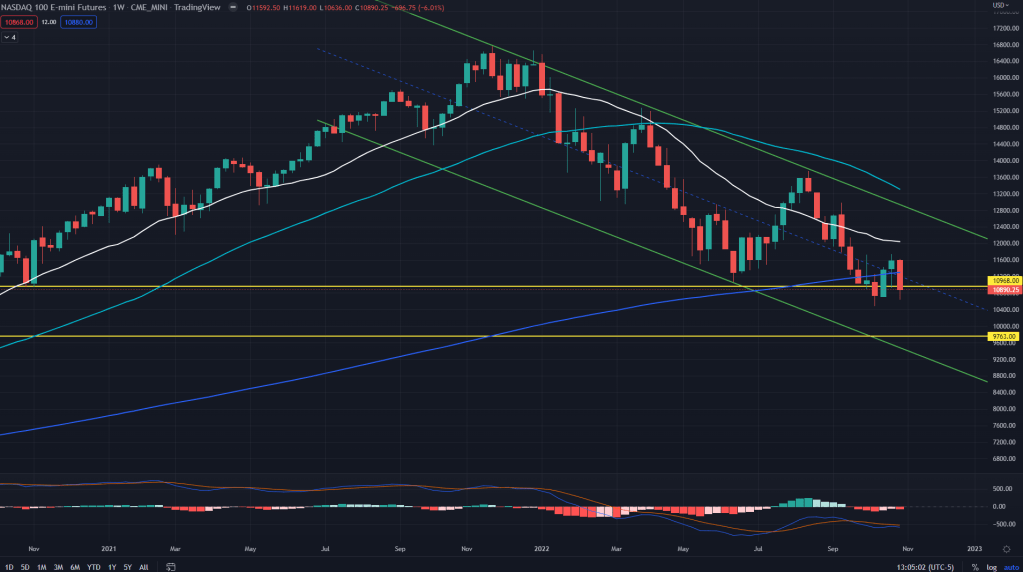
NQ conclusion: It would be far more wiser to initiate new short positions in NQ via NQ futures or even December QQQ puts. The price action is not healthy for tech bulls.
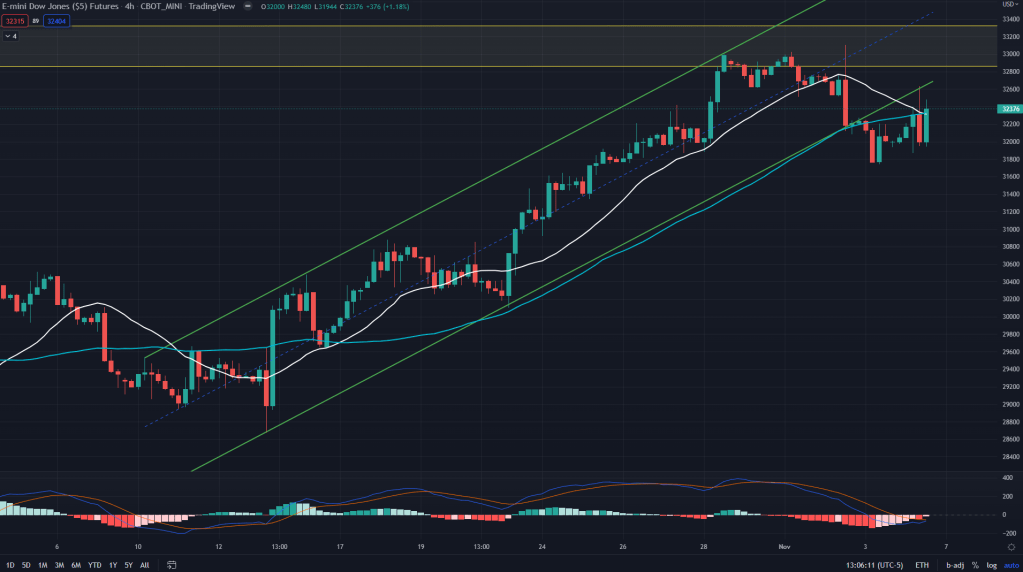
YM (4H): YM has been strongest of the lot in this recovery and late to crack past this channel too. Now that it has fallen and backtested too, I would expect similar story here as with ES.
YM (Daily): On the daily, the only index that has been able to reach its 200 days MA in this bounce and all the way towards the falling channel that has ben the story of all the key indices all of this year.
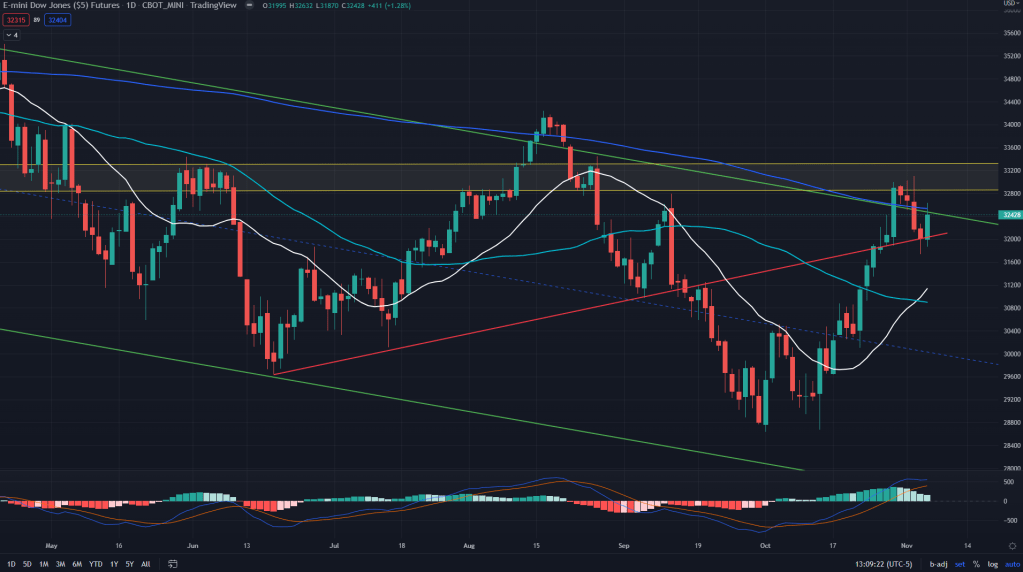
YM (Weekly): Zoom further out and its retraced from the 50 weeks MA. Not the time to stay bullish on the commodity and industrial stocks at this point.
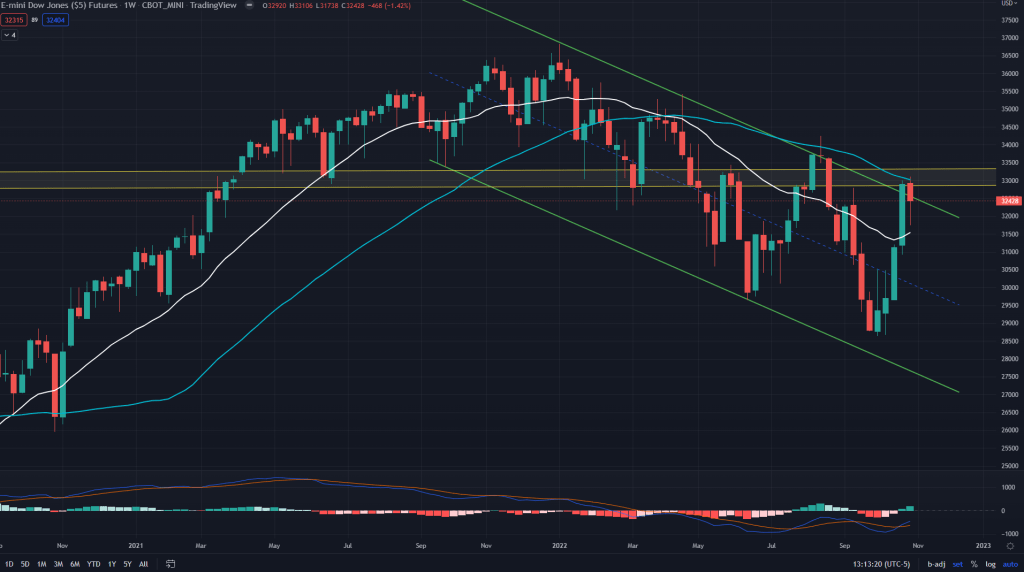
YM conclusion: I would continue to hold those YM shorts and may even add more once we break past that daily trendline support.
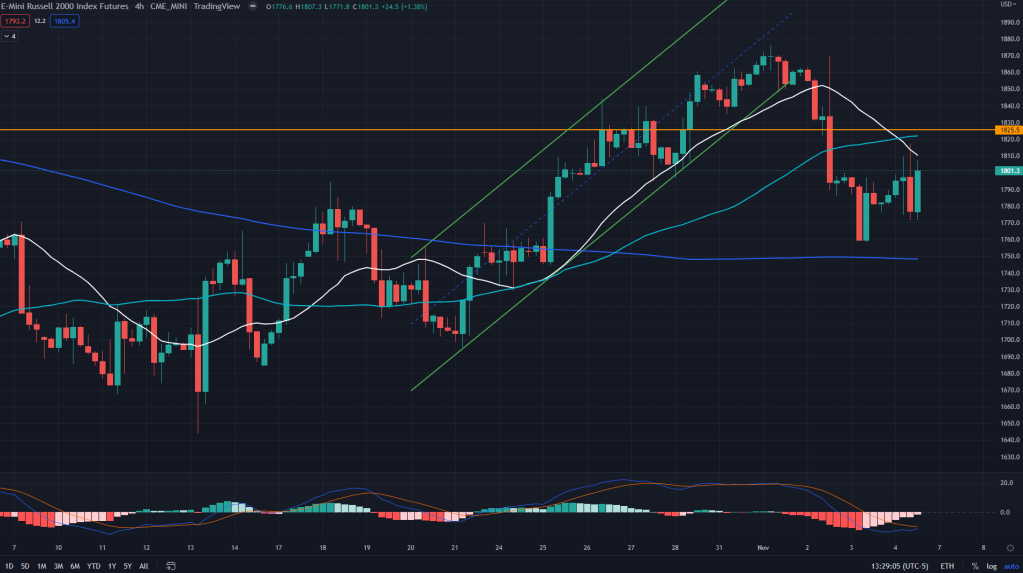
RTY (4H): 4H supply, channel breakdown are the key reasons why I still stay bearish on RTY.
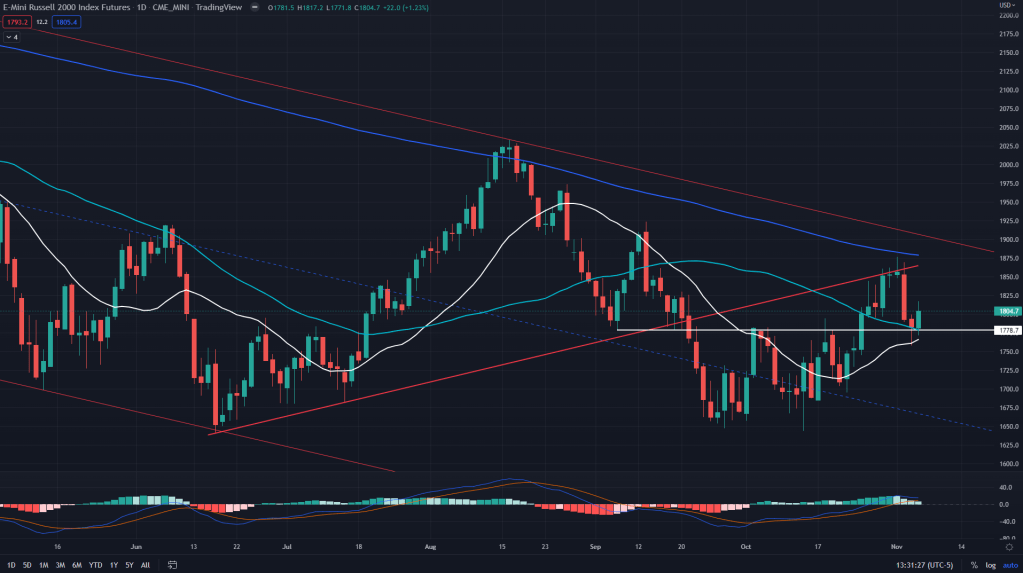
RTY (Daily): On the daily, though it is sitting just above the daily demand/supply line and 20-50 MAs.
RTY (Weekly): Zoom further and there is a sight to behold for the bears – possible for a H&S formation, wherein left shoulder is still not complete and we may have to wait for the another week to see if bears can take it lower and below 200 weeks MA again.
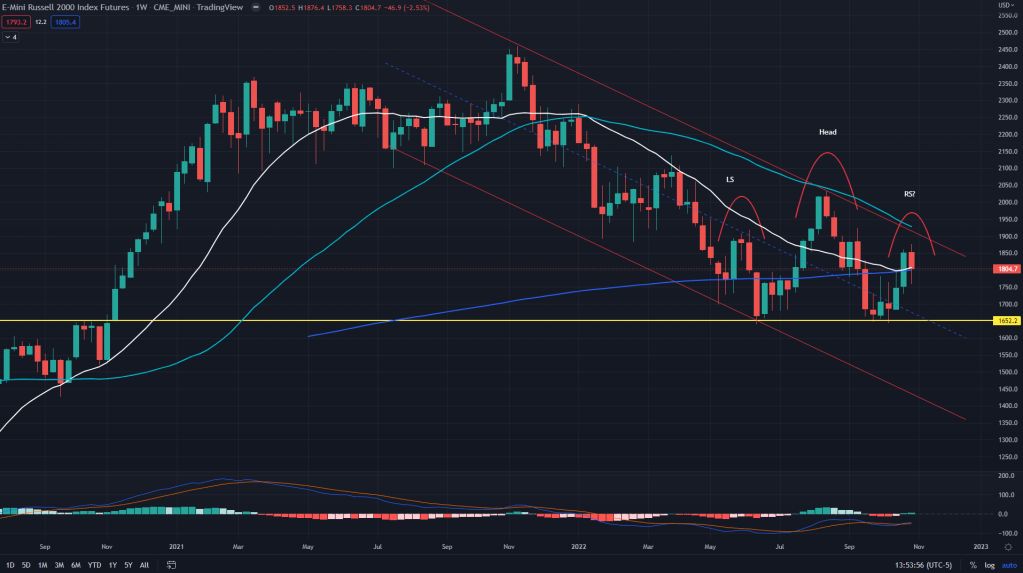
RTY conclusion: I would continue to hold my IWM puts and may even roll them over to the next month as the price action is definitely not bullish and at best even more bearish in the coming 1-2 weeks.

Leave a comment