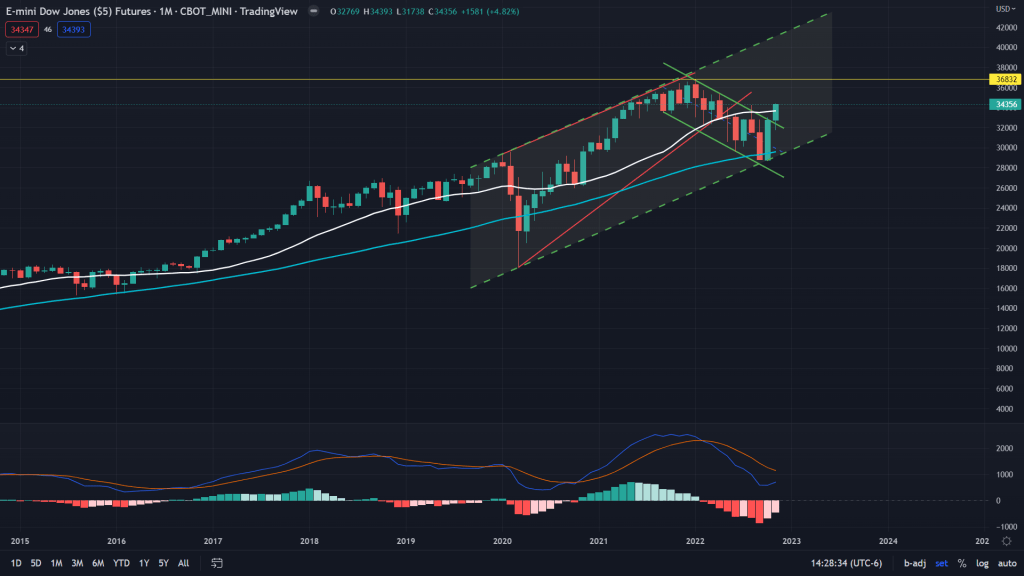
All this year, almost everyone on the street became so bearish that we saw everything from the bearish angle. And why not, that’s how markets have been throughout the year. But when the tide finally turned, nobody saw it coming. Everyone called and waited for the ‘Fed Pivot’, yet not everyone could capitalise on it. Because it was easy to be bearish for the year, rather than suddenly turning bullish. From the technical and charts point of view too, we were entirely glued to the NQ and ES, so much so that our eyes were fixated to see the bear howling each time there was an opportunity to go short, yet not seeing the writing on the wall – Industrial stocks had something else on the mind. Just take a look at this monthly chart of the YM – Dow Jones Industrial Index.
YM (Monthly): The red line on this monthly chart shows the rising wedge which was the base case all the year for me and I continued to be driven by this belief that YM too has a long way to go on the downside, inspite of the fact that I believed crude and other commodities will go a long way on the upside. This is what happens when you are biased by one view and do not reflect frequently on what may have changed. I did not see this parallel channel (green dashed lines), that resulted in sharp bounce in the YM (and it single handedly kept others floating). What happens now is something for the history books – I can see new highs and beyond for the YM even as the ES and NQ play as laggards. All driven by this monthly chart which shows bull flag breakout (Nov monthly candle is yet to close in 3 trading days though), as long as we stay above this green bull flag (32,300) and monthly 20 SMA (33,667 currently). Another thing that’s running on my mind is – Possibility of MACD giving us a negative divergence on the monthly before all hell breaks loose on the YM too. For that to happen it should coincide with a new high on and probably all the way towards the upper end of this green dashed channel. But once bitten, always shy. I would not be blindsided by this view anymore and would rather zoom in a bit and see what the weekly and daily show us.
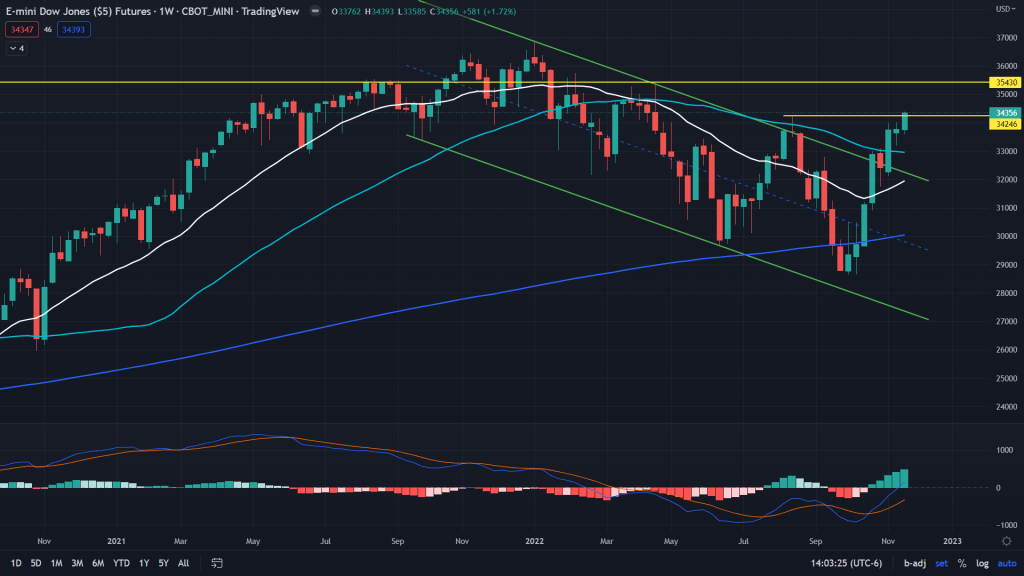
YM (Weekly): The weekly is sitting right above the supply line of 34,246, also there lies a possibility of double top.
YM (Daily): When we look at the daily chart, its a clear V-shaped bounce and anything that rallies sharply, almost always results into a sharp retracement too. I won’t be surprised of few days of consolidation/retracement before it resumes the rally.
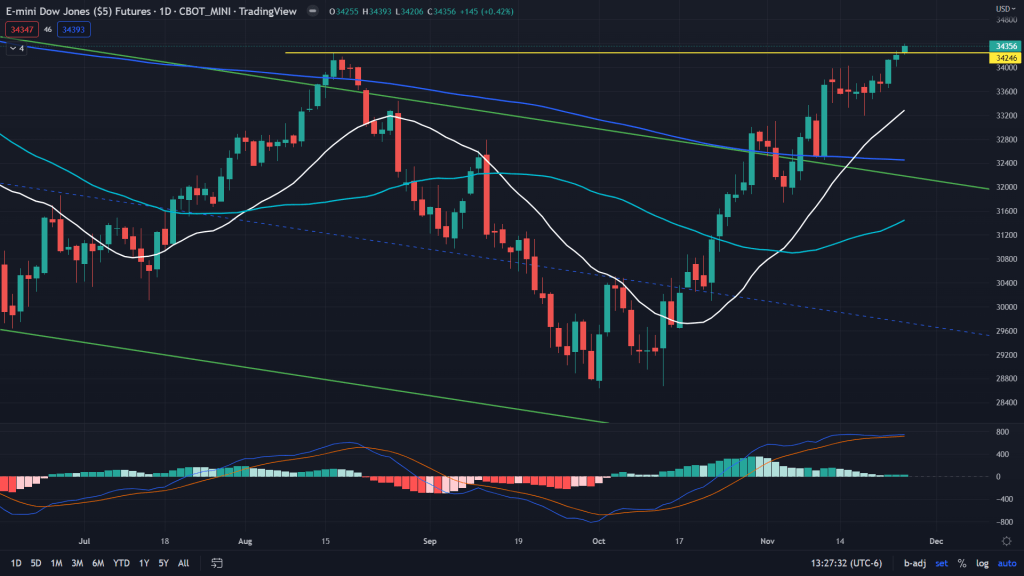
YM conclusion: While we have a new view now that tells us who the new leader is, it is always prudent to not jump to conclusion, because that clouds our belief and then we can fall flat miserably, especially when the bounce has been sharp and steep. I would wait to buy this rally in the YM.
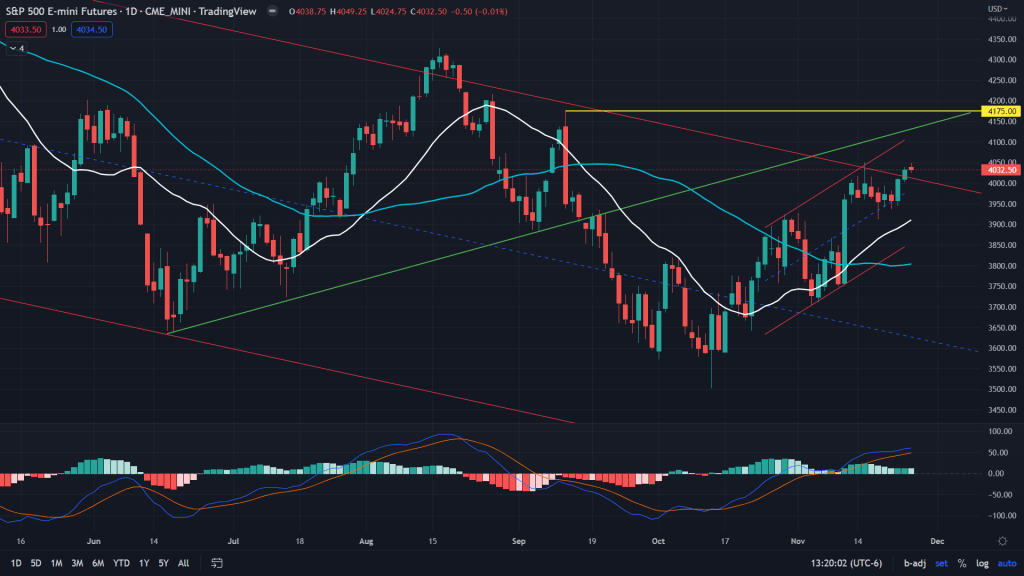
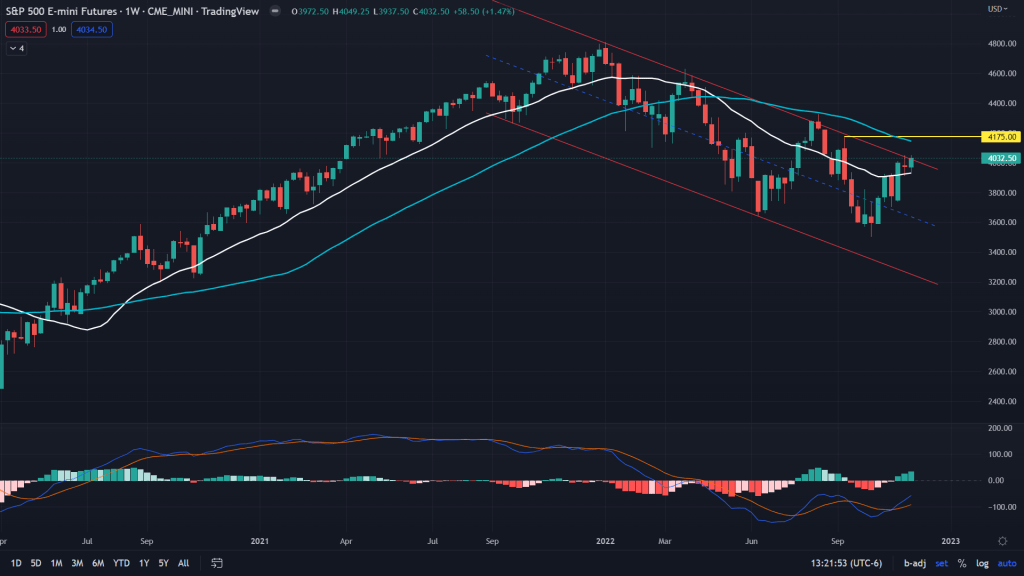
ES (Daily): For the ES, NQ and RTY, I would speak less and let the charts do all the talks.
ES (Weekly):
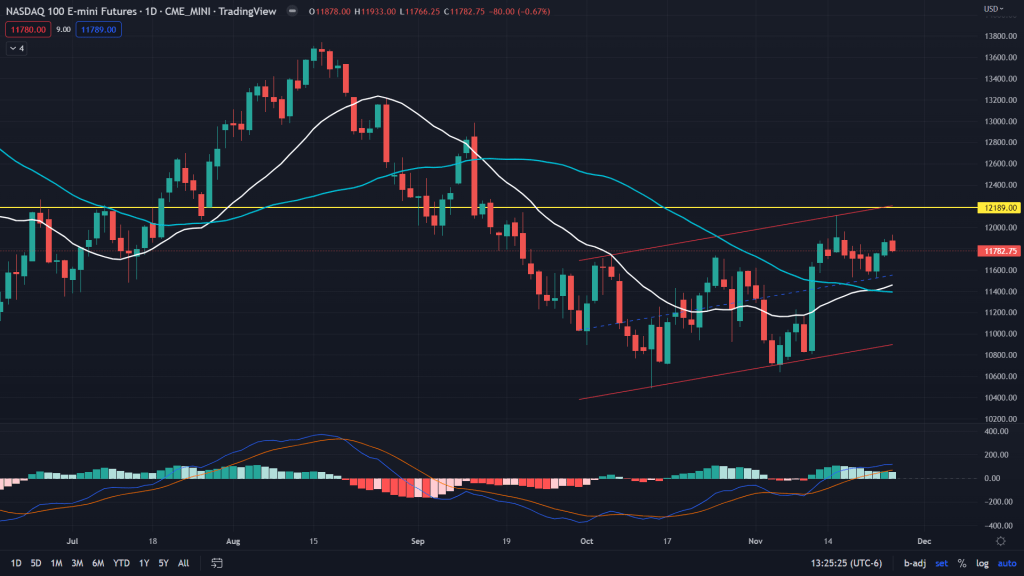
NQ (Daily):
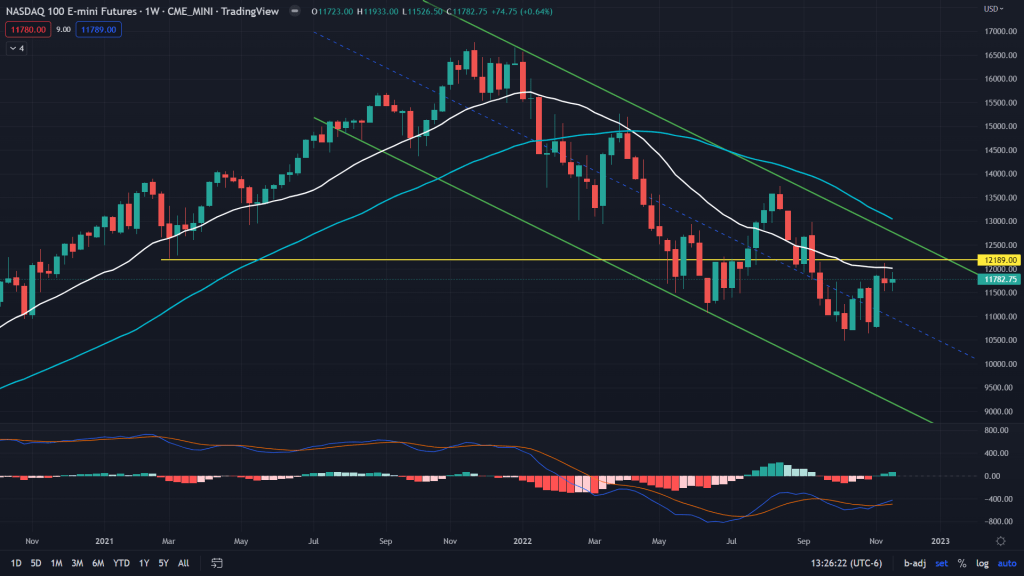
NQ (Weekly):
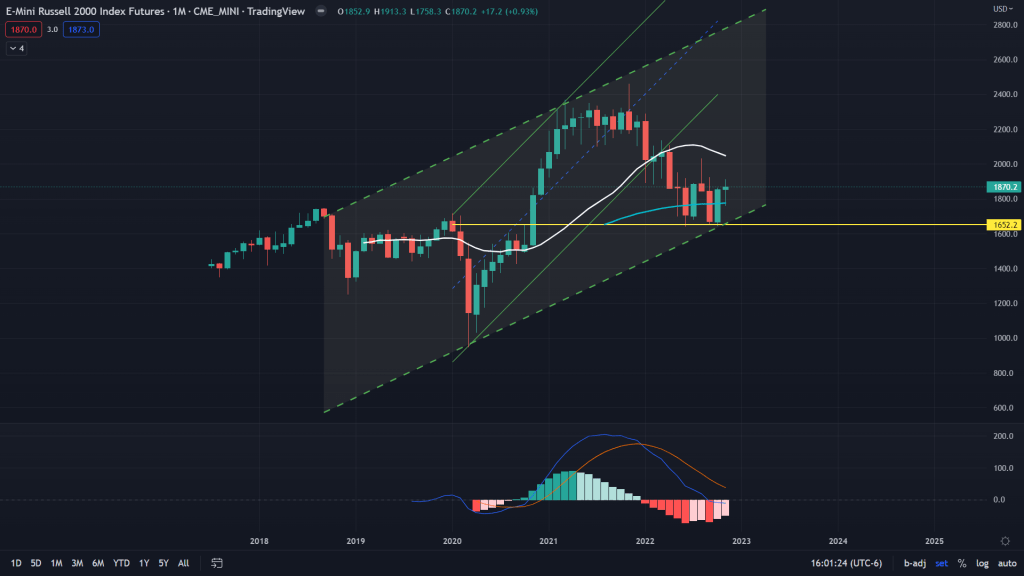
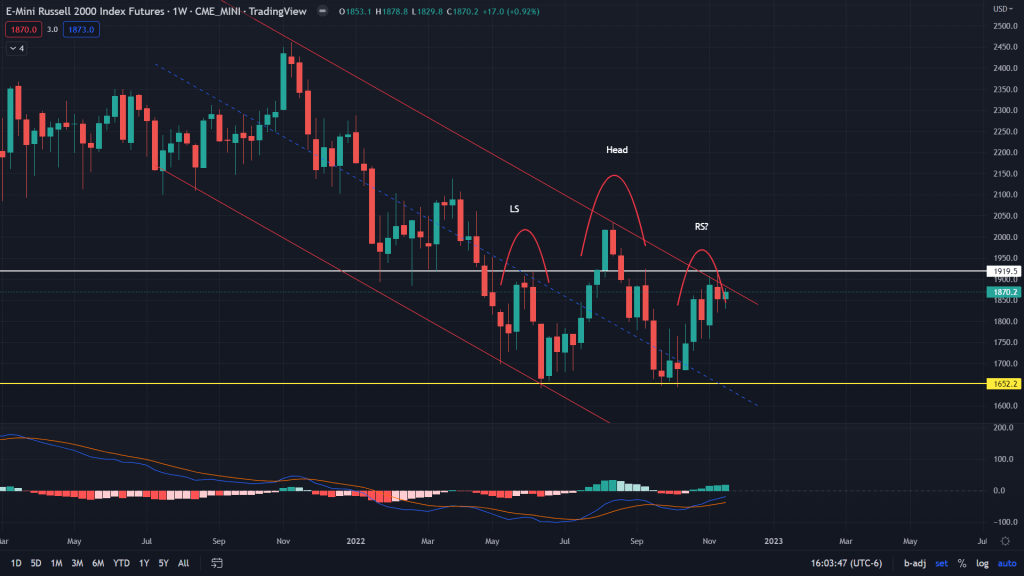
RTY (Monthly):
RTY (Weekly):
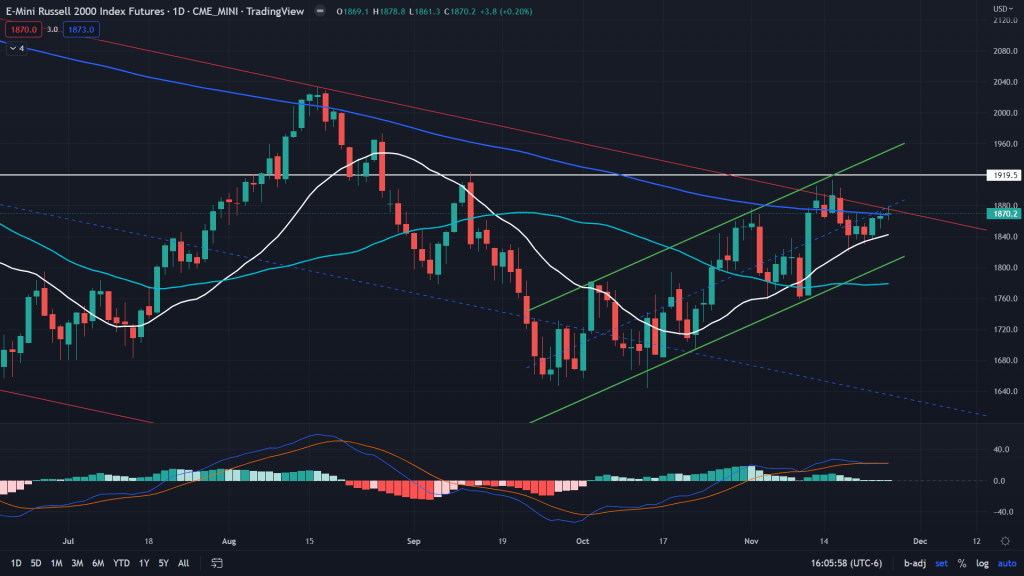
RTY Daily:

Leave a comment