As posted in the last weekly update, markets seem to be reacting more on the monthly candles and the bull flag breakout of the Dow Jones is something that can’t be ignored, now all the more as we head into December, Santa rally would be on everyone’s minds in the coming days. Let’s see what we see on the charts now:
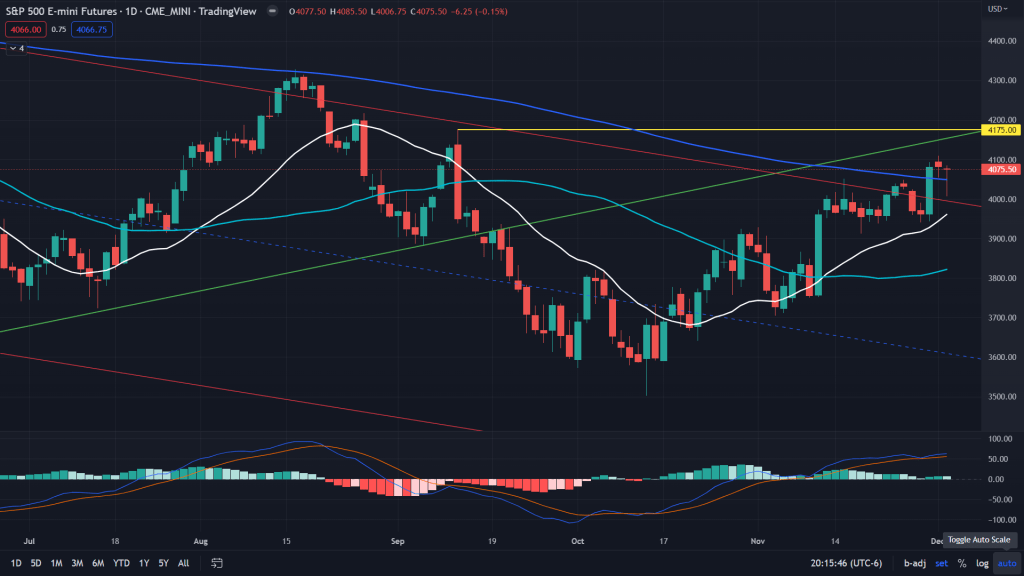
ES (Daily): Bounce off the 20 days MA and sustaining 200 MA on the closing basis – speaks a lot of which way markets want to head. There are enough resistances overhead and it won’t still be a one way rally above and it would be prudent to buy the dips on the 4H and daily charts as against chasing the price upwards. No more FOMOs, unless we’re able to cross past the 4175 daily supply.
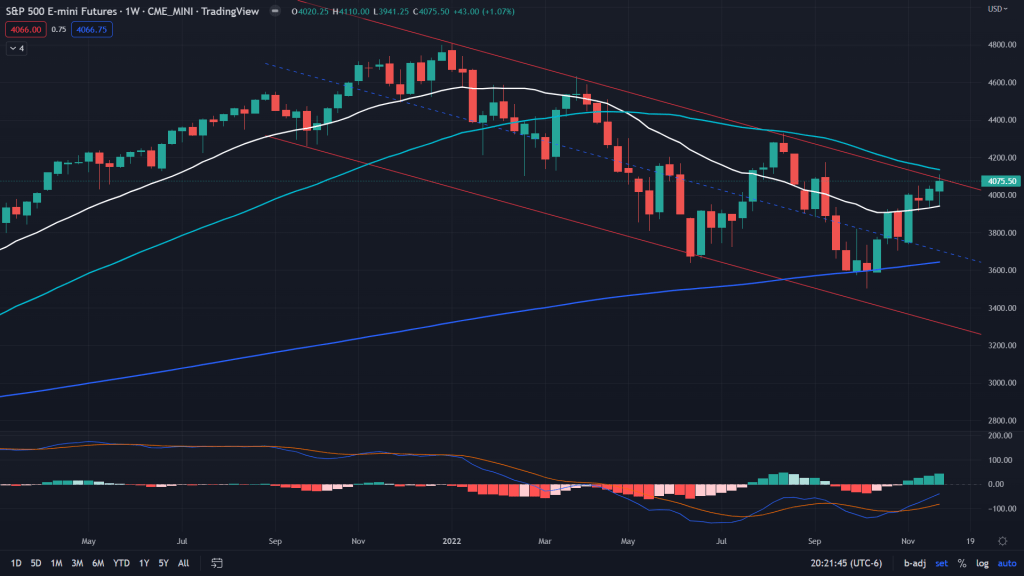
ES (Weekly): Another key worry is the 50 MA on the weekly chart and the channel resistance which could also turn out to be bull flag on the monthly, just as it was for YM, but I won’t be too bullish until the weekly candle closes above the MA convincingly.
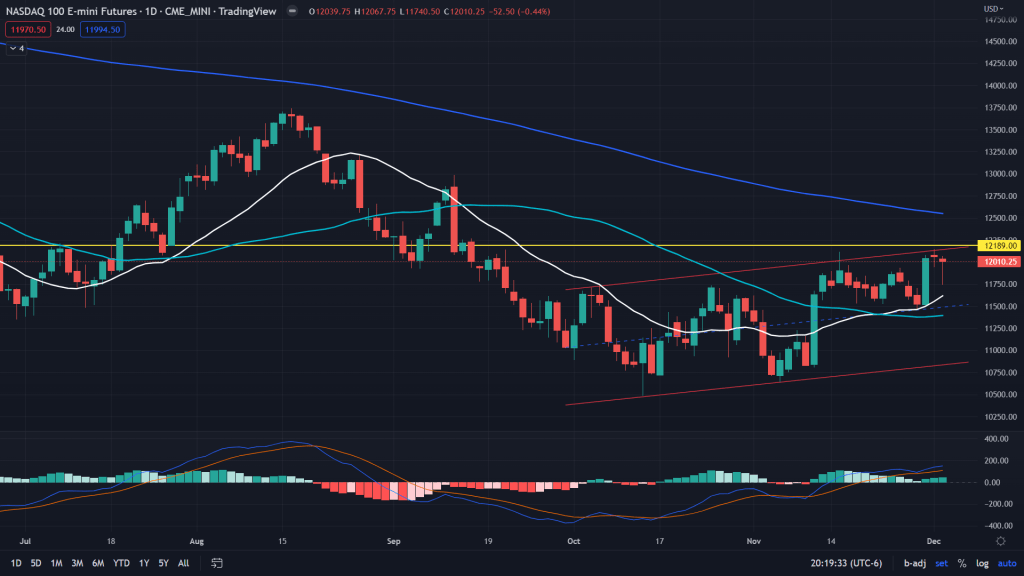
NQ (Daily): There is a saying in the market – yesteryear’s winners won’t be the winners of the future. No wonder we aren’t seeing the bounce in tech stocks akin to the industrial stocks. No wonder the Nasdaq is still at a stone throw distance from its lows while the Dow is hop skip and jump away from its all time highs!
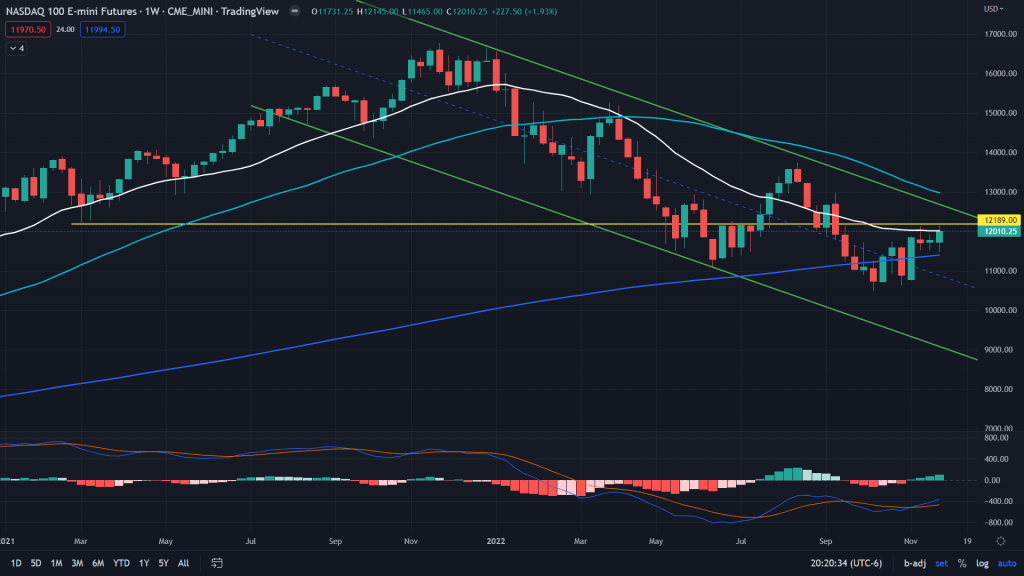
NQ (Weekly): On the weekly too, it hasn’t even been able to cross past the 20 MA. That’s a paltry performance to put it mildly.
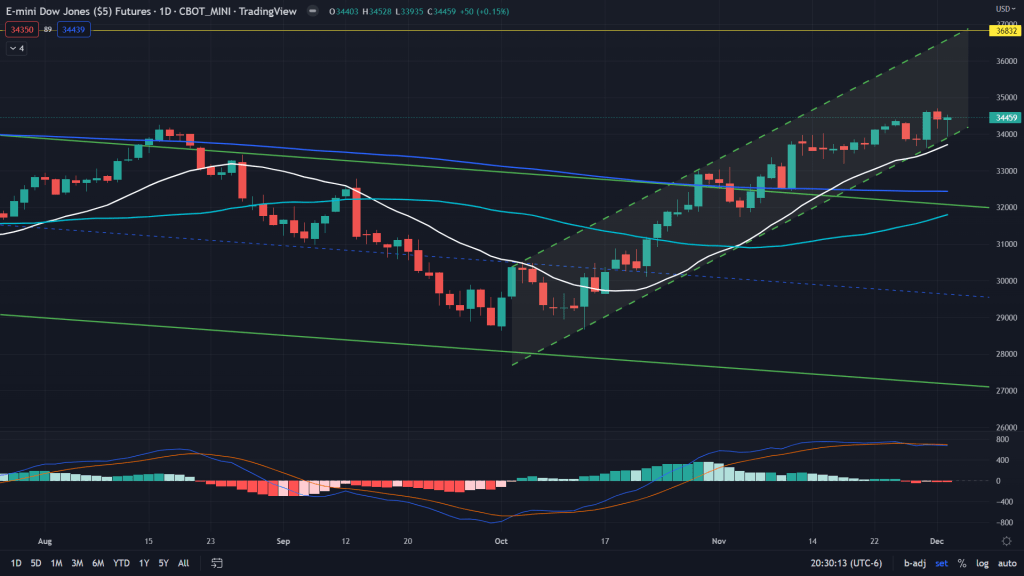
YM (Weekly): What a sight to behold. While many keep wondering and looking for the runners and when and how the bear market would end, the Dow is racing towards ATHs under their nose. BUT – that hanging man is something for the bulls to worry about!
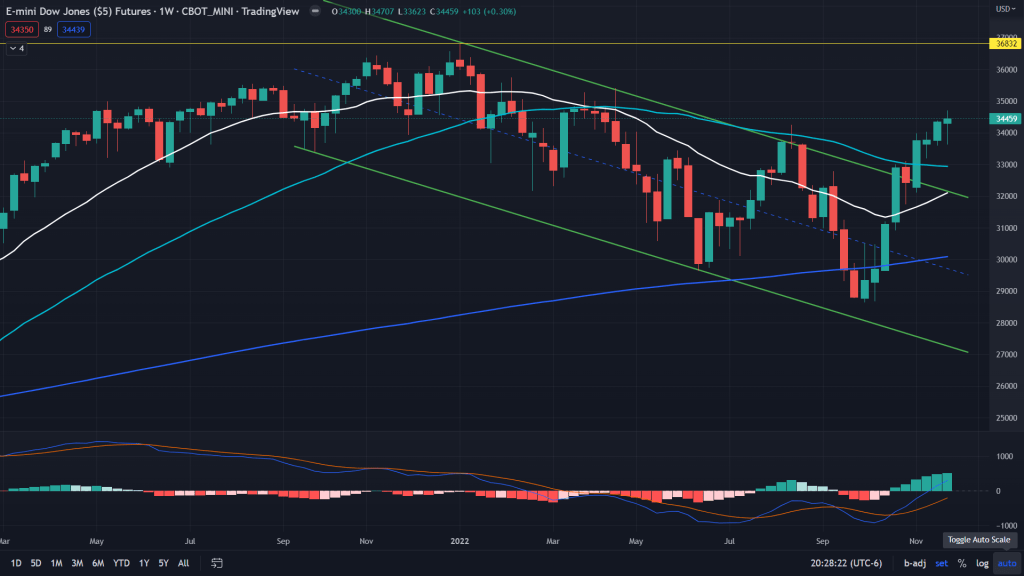
YM (Daily): Zoom in a bit and you see daily negative MACD divergence. Let’s be careful of those longs and add only when there is a significant dip to add.
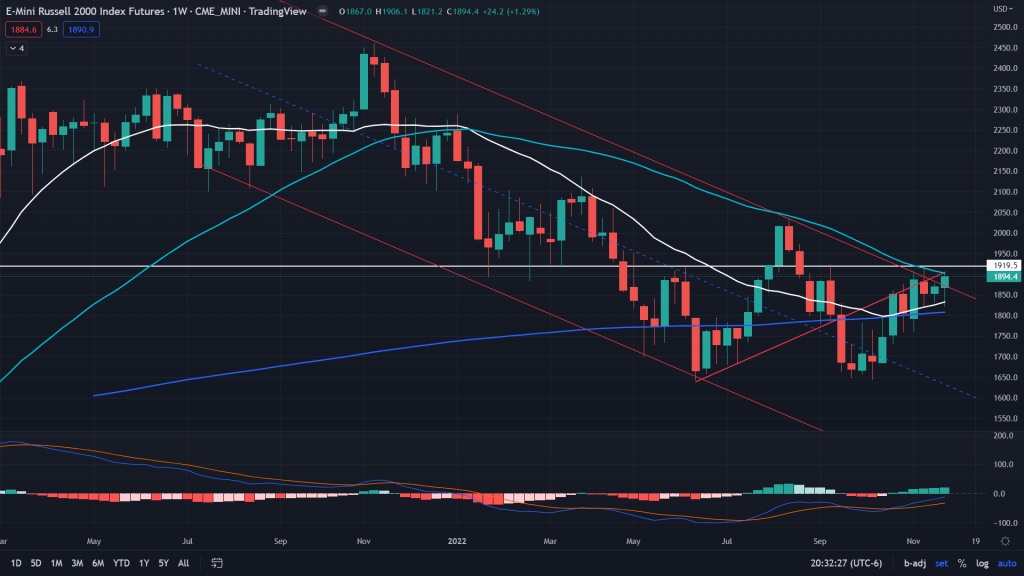
RTY (Weekly): 50 MA struggle is visible, even as there is a breakout visible on off that channel – Yes even that would turn out to be a monthly bullish flag breakout, if sustained.
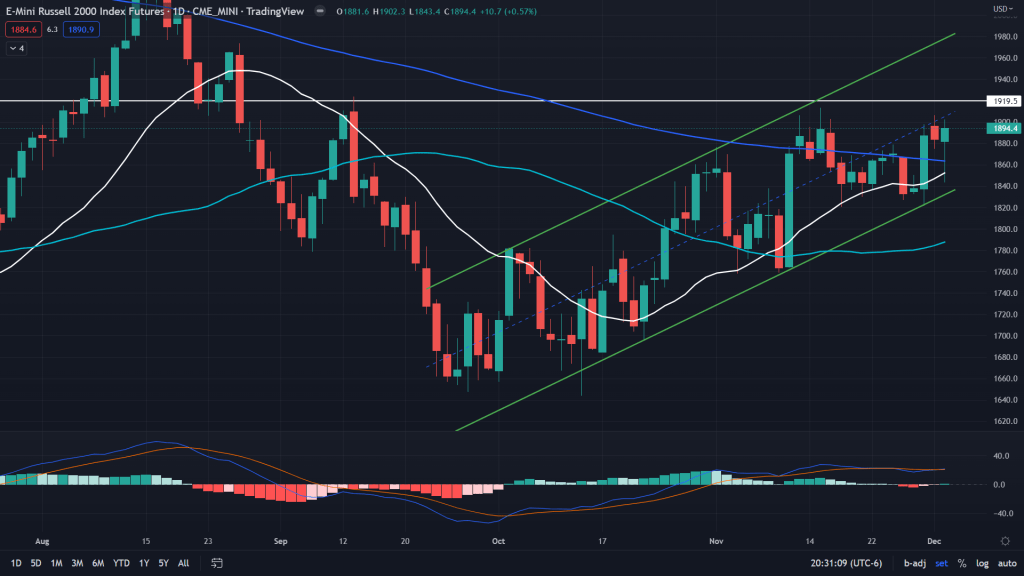
RTY (Daily): But the rally on Friday was massive from that 20 and 200 MA’s backtests. It doesn’t happen often and I won’t be bearish here even as MACD is diverging negatively.

Leave a comment