All through this year one theme has been common for the markets and that is the unabated rise of the mighty Dollar. The more it rallied the hard stocks fell and vice versa or perhaps the other way round. Irrespective of whether the fall in stocks led to the rise in dollar or otherwise, that seems to have changed. As in the tables have turned and now the stocks are rallying and the Dollar taking a beating. Not only that, there are other currencies which are considered to be risk-on currencies – the Aussie and the Kiwi Dollars. Hence it only makes sense to observe keenly as to what they are upto and if there is something for us to take cues from?
Lets start with the Greenback first:
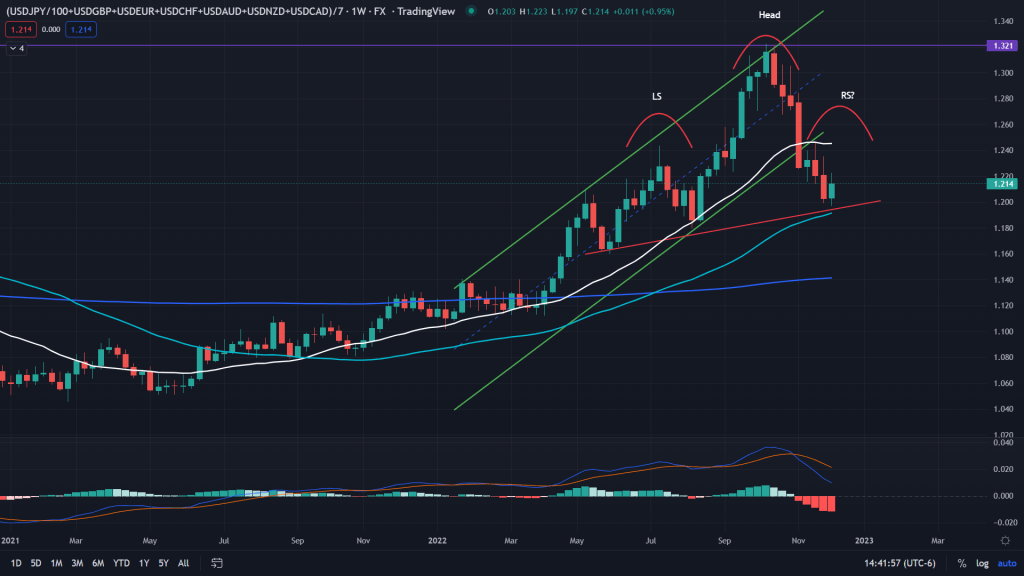
The equal weighted Dollar Index: The reason I follow the equal weighted dollar index more closely is simply because of the higher weightage (more than 50%) of the Euro in the DXY Dollar Index. What we are seeing below is the weekly chart of the equal weighted dollar index and it’s a sight to behold for the equity bulls. It reversed from the multi-year monthly supply line of 1.321 (purple line) and has also broken down of the rising parallel channel along with breaking down of the 20 weekly SMA and on the verge of breaking down of the 50 weekly SMA too. No way its going to be easy for the dollar bulls to cross past these two key hurdles once the dollar is below these. Icing on the cake for the dollar bears – A potential H&S formation on the weekly (the right shoulder is still to form and may take about 8-10 weeks more before completion). Once the pattern is complete it would be far more bearish for the dollar and we shouldn’t be surprised to see 1.15 on the cards (another 5% being shaved off the index, which is huge enough for a currency).
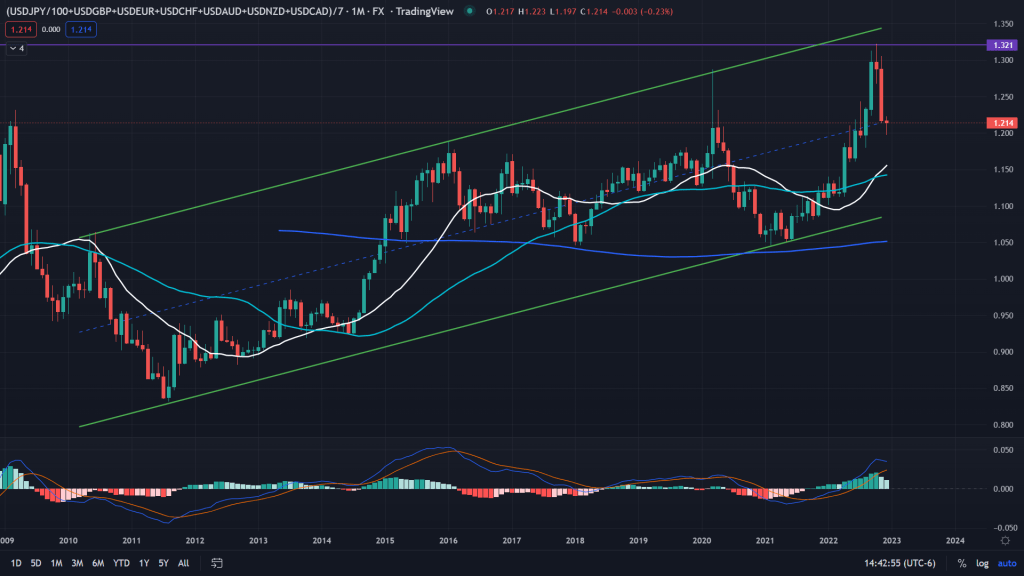
Monthly: If we zoom out further, the monthly chart isn’t bullish either and there should be at least 2-4 months more before the monthly mean reversion (monthly 20SMA) completes itself, which could easily be around the same 1.15 levels where we can re-assess what may happen next for the dollar.
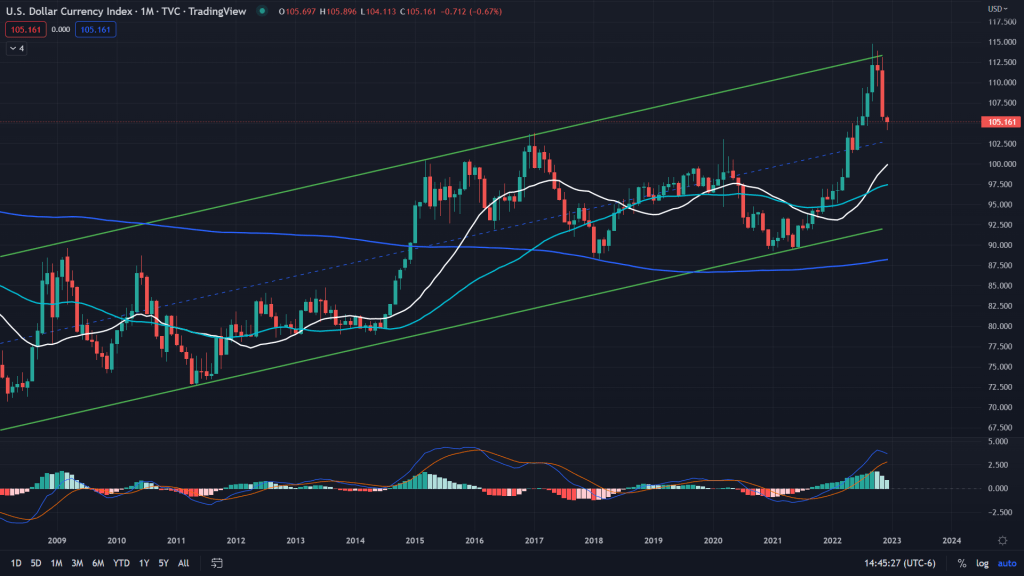
DXY: Even for the DXY index, the set up isn’t much different and it has reversed from the upper end of the multi-year cannel resistance. Be prepared to see about 100 odd levels on the DXY too in the coming months before it sees any meaningful bounce.
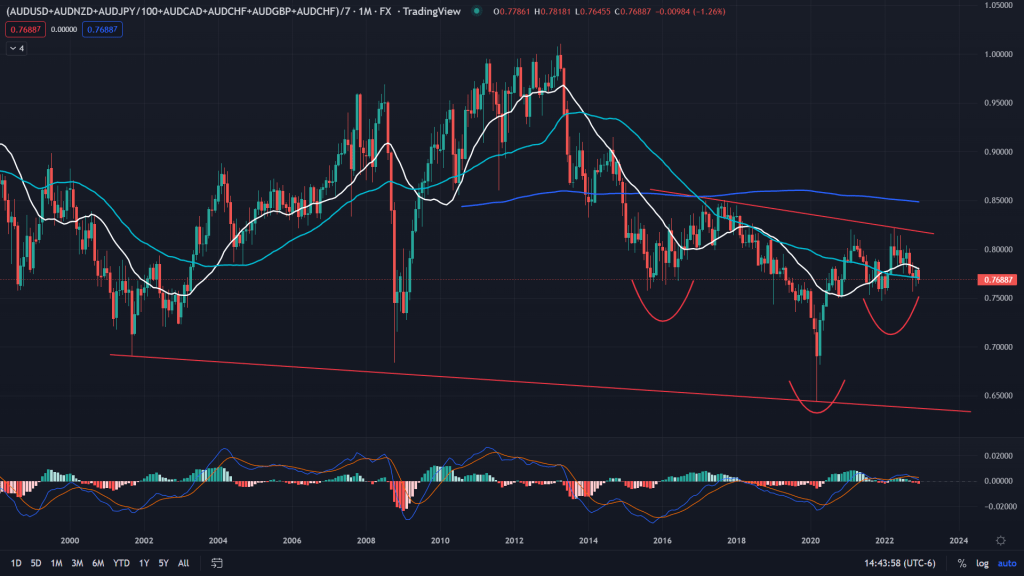
Equal weighted Aussie Dollar Index: As I mentioned above Aussie and Kiwi dollars are considered to be risk-currencies, which means they are driven by the movement in the stocks and would usually go in the similar direction of stocks. What we see below is the multi-year monthly chart of the Aussie Dollar Index forming inverse H&S. The pattern would be complete once it breaks out of the neckline which is around 0.82 odd levels. It would be at least 2-4 months before it even tries crossing past the neckline. At present, the struggle is to sustain 20-50 MAs on the monthly. I’ll be watching it very closely.
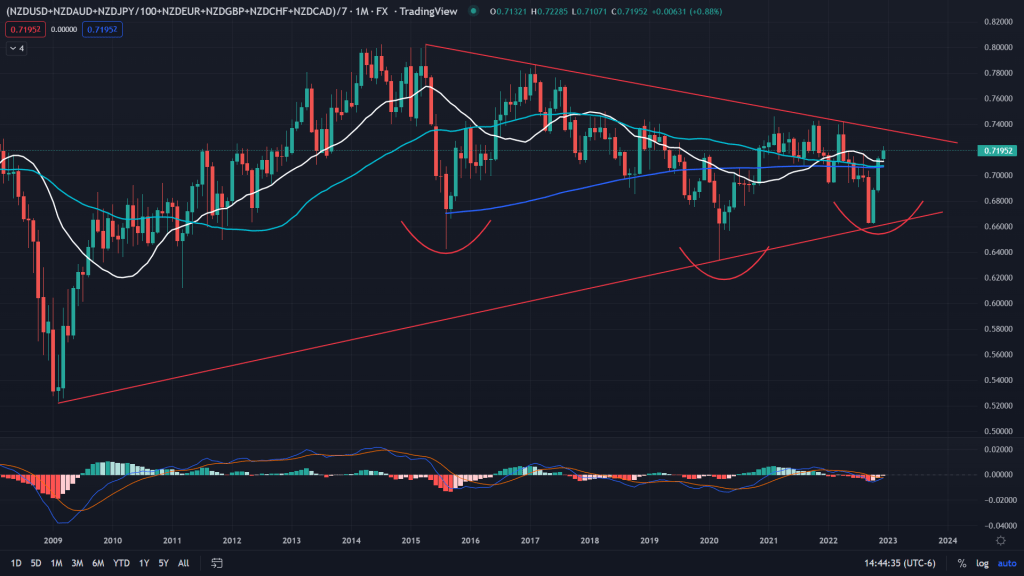
Equal weighted Kiwi Dollar Index: Even the New Zealand Dollar is showing exactly the same pattern – inverse H&S formation, the only difference being it is already above its key 20-50 MAs and the Kiwi is not too far off the neckline resistance too. Perhaps the breakout would be visible here before the Aussie.
Conclusion: As I have always said in the past that it is suicidal to be biased while watching markets, but what is visible on the charts, can not be ignored and there are good odds that the tide would be favoring the bulls in the first half of next year. Unless of course something dramatically changes on the macro front, which it may.

Leave a comment