After a long hiatus of more than 3 months, I’m here with my thoughts on the market wherein I would combine the two bags of macro insights and micro technical analysis so that we can decipher what’s happening with the market and how we may fare in the times ahead. But before we move forward, please remember:
“Don’t fall for the predictions of what is going to happen, instead just follow the price action and run to the bank. Because it’s not important to be right, but it’s important to make money without caring for if YOU ARE right!”
Anonymous.
So, let’s dive in.. first with some macro insights. I have been on the side of “inflation is going to be higher for longer” camp and I still continue to be, with slight doubts.
Although, inflation has indeed come off a lot from the peak seen last year, is it still comfortably low enough for the Fed to pause and cut? Let’s take a look at bigger picture:
Here are a few charts that show us where PPI, CPI, Core PCE and inflation expectations are:
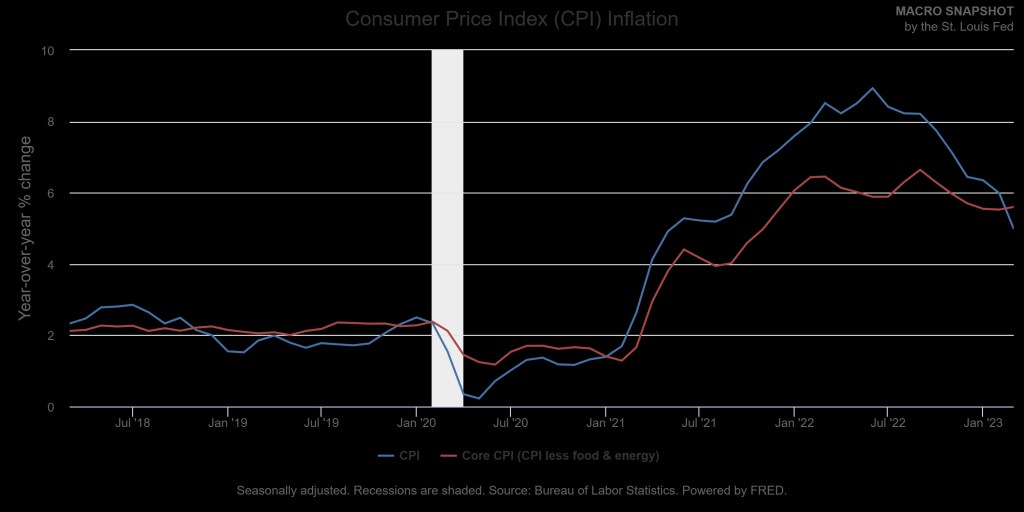
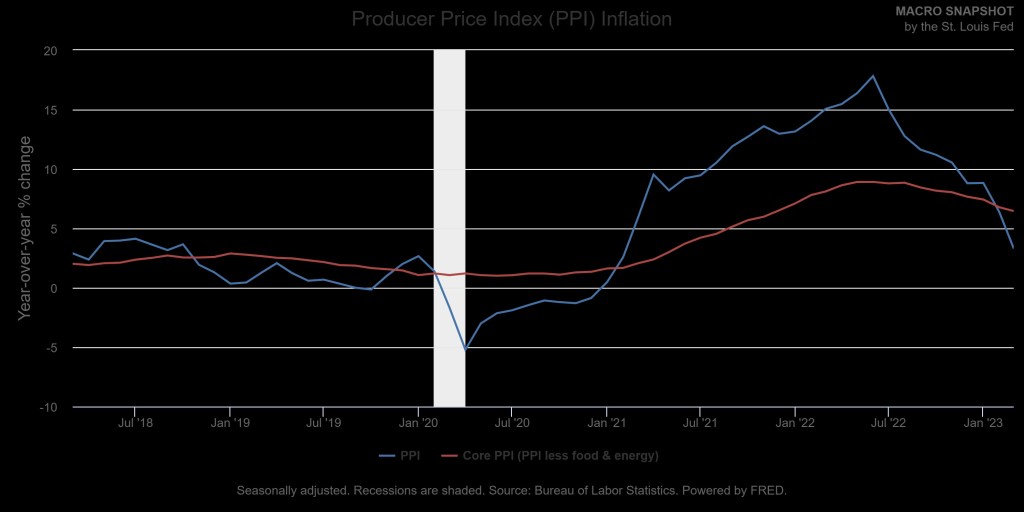
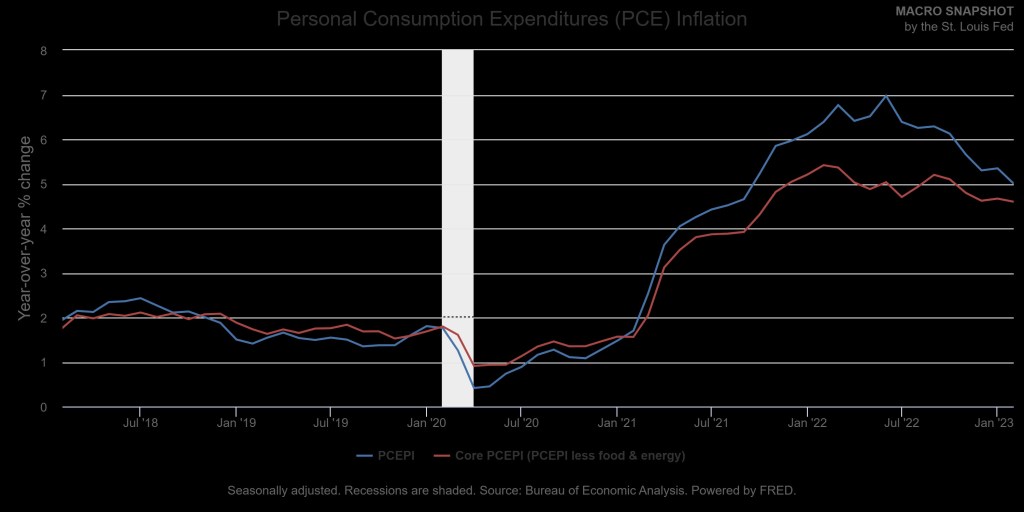
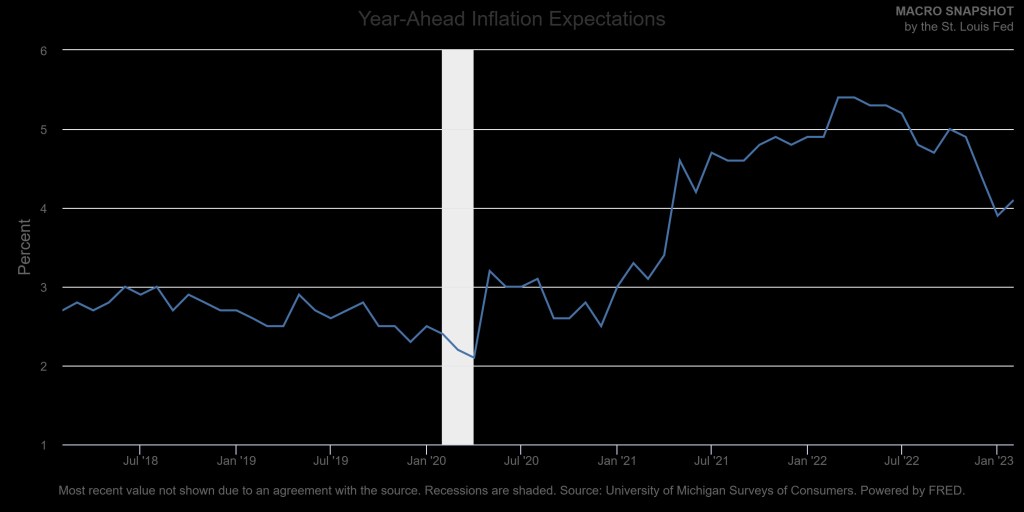
While, it does look like producer and consumer price inflations indeed have moderated. But when we look at PCE, core PCE and year ahead inflation expectations, it doesn’t look anywhere close to Fed’s inflation target of 2 percent.
But looking at inflation alone without looking at the demand side of it – employment and the earnings growth of the employed population, would be a half picture. Let’s see what employment picture is showing us:
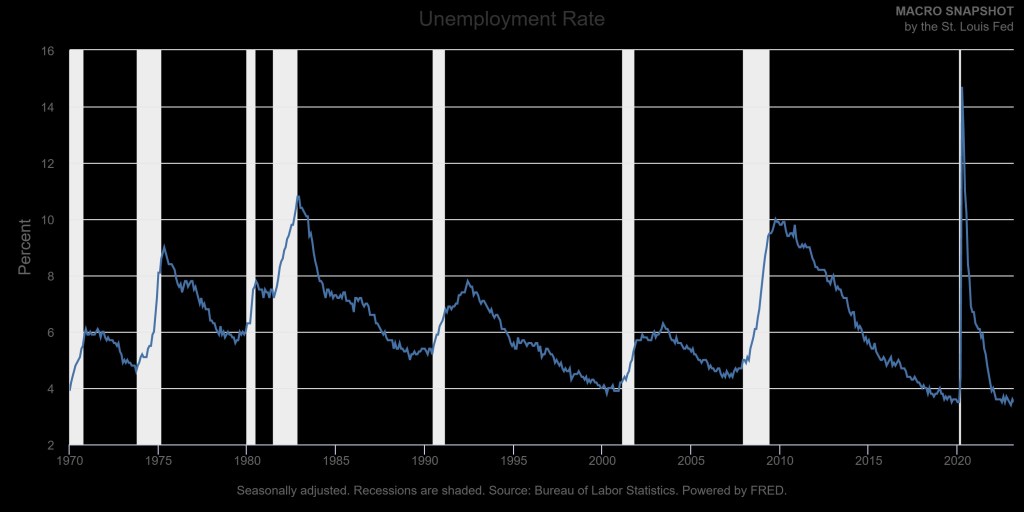
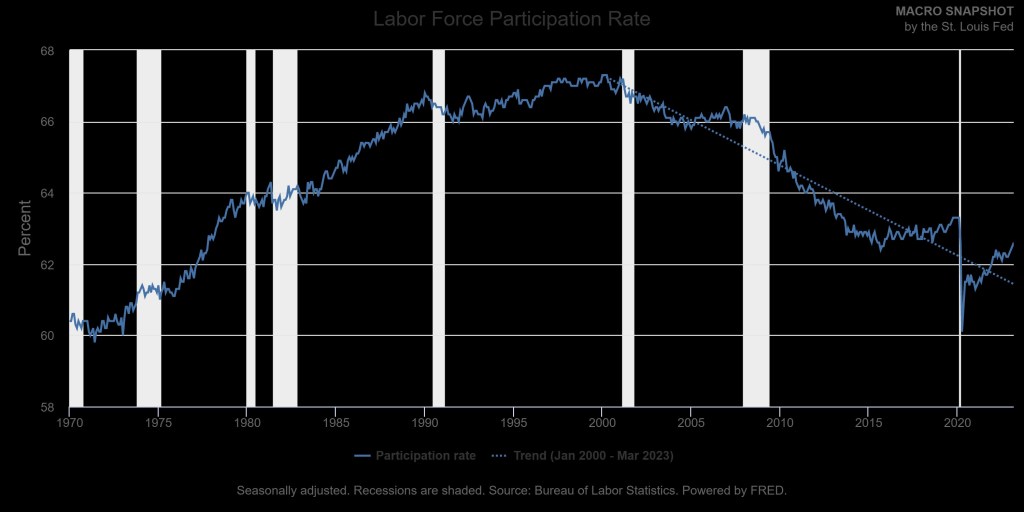
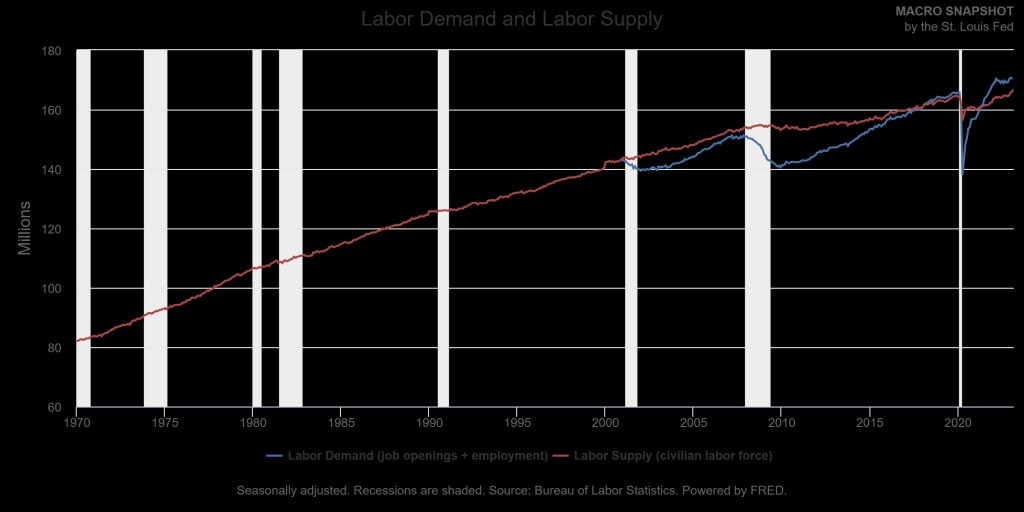
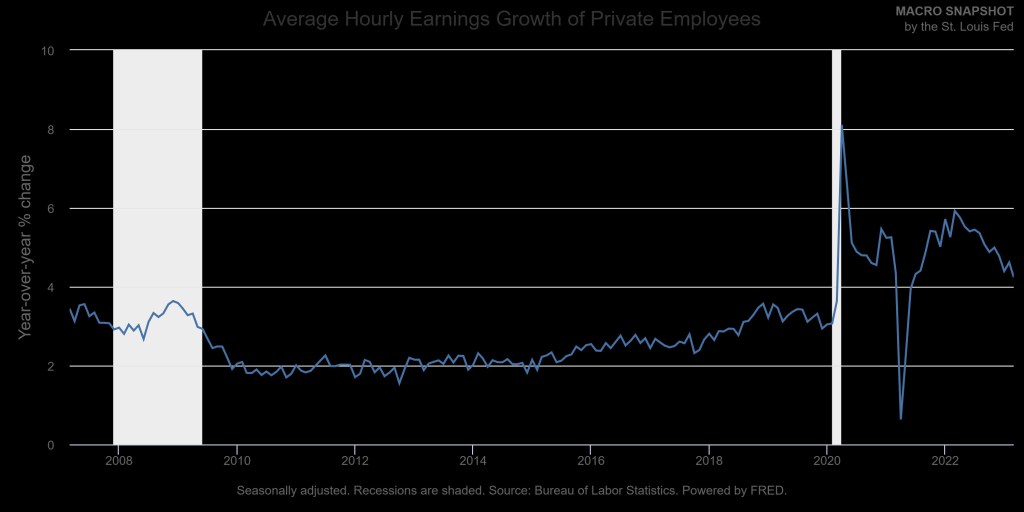
What should one take from this? Although, many market participants would like to be joyous with the fact that inflation is trending lower, but as they say, don’t say over till its over. I wouldn’t be a naysayer, but if inflation had to moderate as much as all the way up to 2 percent, then it would have by now. The longer it takes, the harder it is for the general public to expect it to moderate. It is the ‘used to’ attitude that takes longer to come off. Stickiness of inflation is far more harder to get rid of as against inflation itself and this stickiness is what worries me more and you should be worried too. More so when the labor force participation and the demand supply gap of the labor point us towards inability of the companies to be able to fulfil the vacancies they have. Making it harder for them to higher at lower wage rate, to ensure existing employees stick around. This is very pertinent when we look at the average hourly wage.
In a nutshell, I wouldn’t be surprised if we don’t see inflation going back to the Fed’s targeted 2 percent range anytime soon.
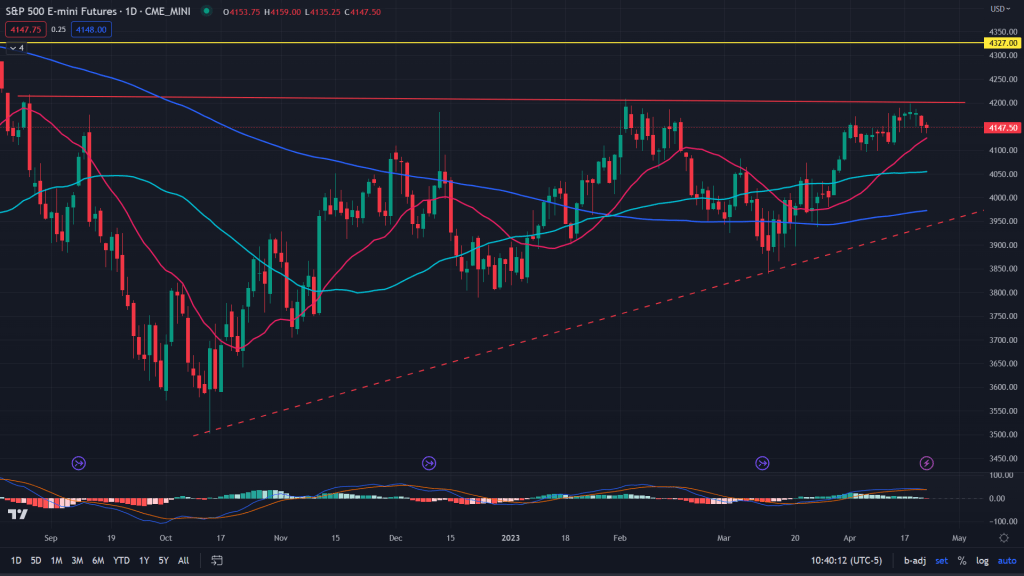
Micro view – Technicals on the ES: I have been posting my views on twitter very frequently (read here) and this formation of ascending triangle has long been on the verge of a breakout and what we are seeing off late is a consolidation before finally does break out to the upside, with initial price target of 4325.
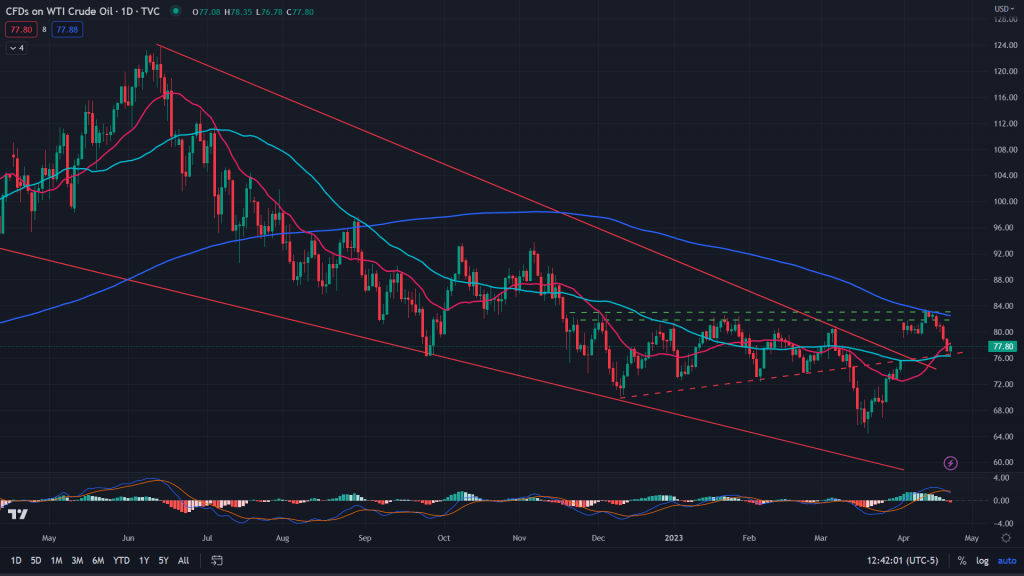
Commodities – Crude Oil: I have been bullish on crude oil for a long time now and this rally and the clawback was expected (read here). What”s important now for the bulls of crude oil is to stage a comeback after this backtest. First sign of a strong comeback would be closing past the 20MA on the upside, above $79/bbl.
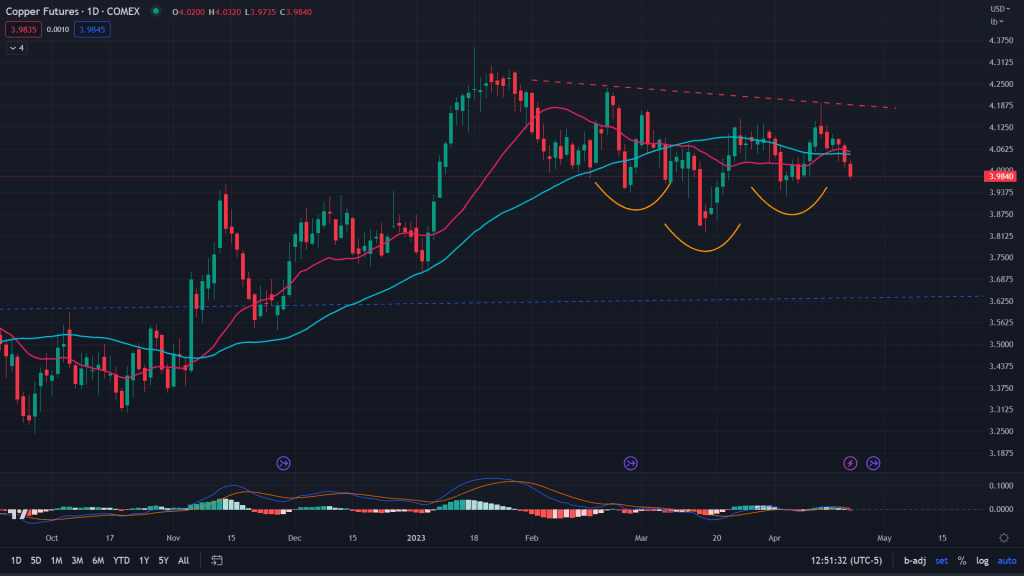
Copper – HG (Daily): No explanation needed, self explanatory chart below:
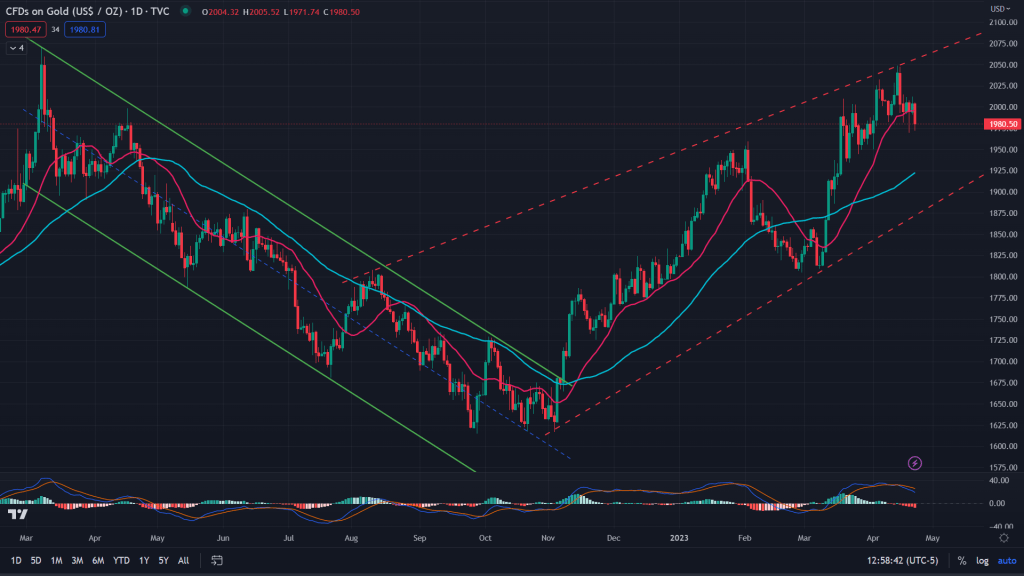
Gold (Daily): Till about last year I was very bullish on gold, but not anymore. While the breakout did occur sometime in November last year, what has been forming since is the rising wedge on the daily and that’s not bullish. Although there still some time before it breaks down.
Macro-micro conclusion: Looking at the macro data points and technicals together, here’s what I believe is happening:
- Macro data points still show stickiness on inflation front
- Stocks still have some more upside left
- Commodities are indicating signs of rally ahead
- Stocks rising along with commodities is a sign of loose financial conditions along higher commodity prices
- Gold may lose its sheen again.
What isn’t in the price though from macro perspective:
- Stagflation – stagnant growth with higher inflation (we seem to be headed this way)
- Deflation – Not my base case, but you can’t be sure if it won’t occur.
- Entrenched recession – Mild recession of 3-6 months is already in the price, but not beyond.
Stay tuned. Stay blessed.

Leave a comment