For anyone tracking markets for more than a decade, knows for sure what happens when interest rates start rising. Recession is one of the final outcomes of the slowdown witnessed in various industries and sectors. While, manufacturing, services do see significant drop in their productivity, the final nail in the coffin is in the construction and housing sectors.
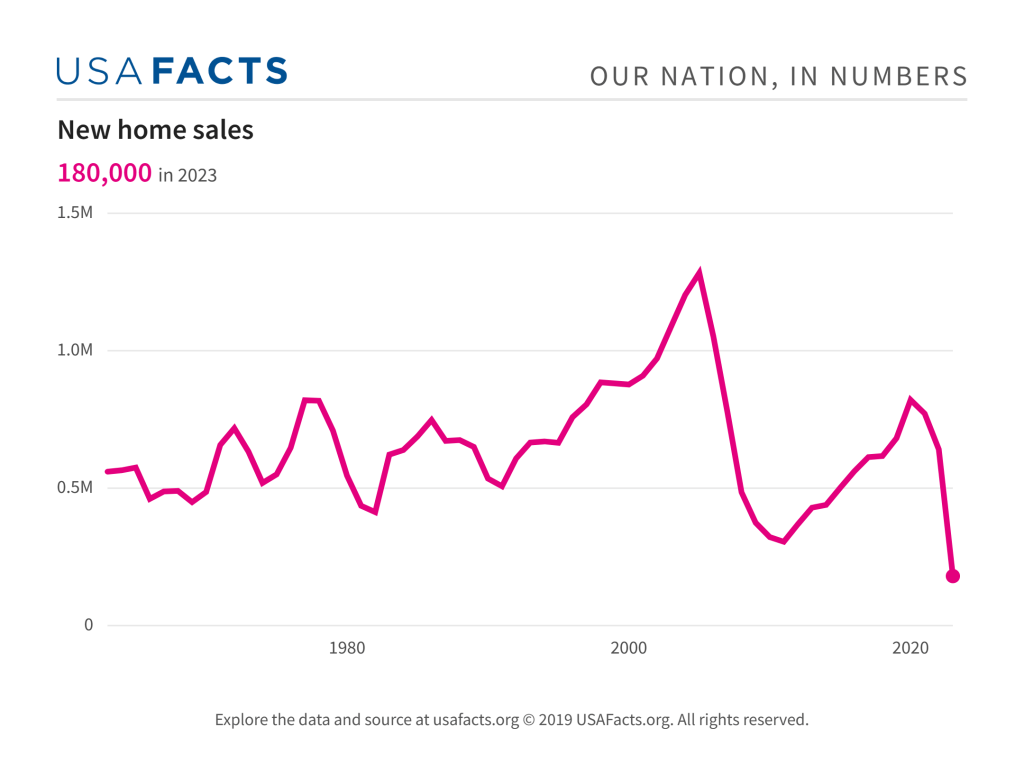
New Home sales: Sales of new homes fell 21.92 percent in 2022 from to 641,000 homes as against 821,000 in 2021.
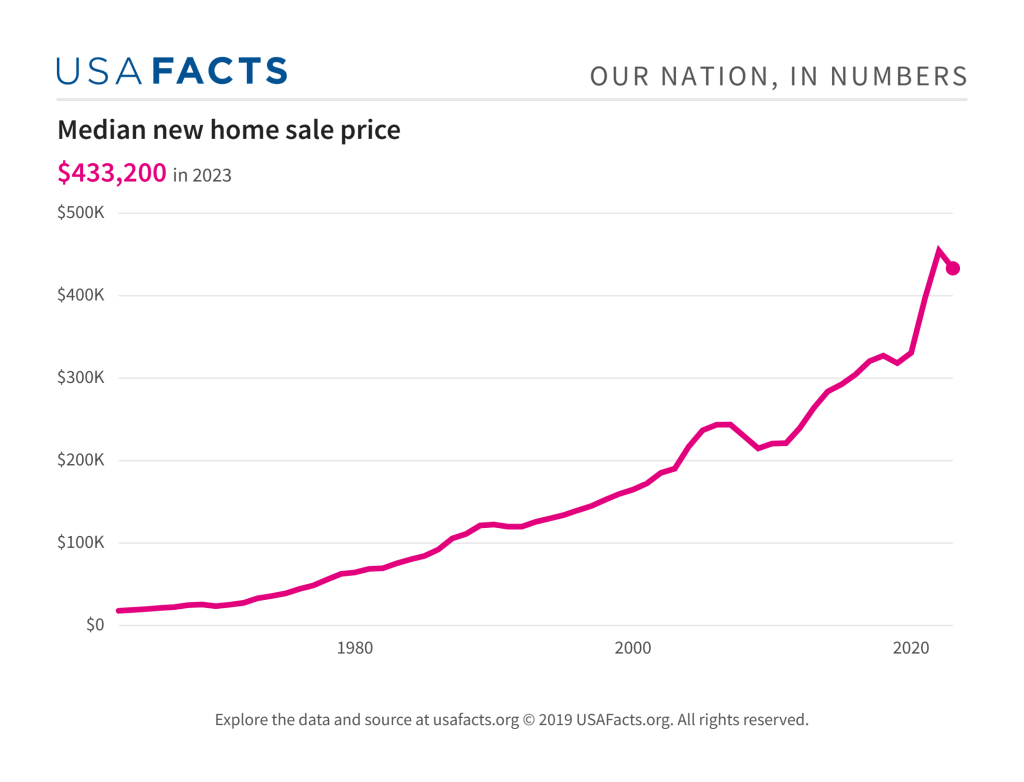
New Home Prices: New home prices have started seeing a correction, which is a good as well as bad sign. Good sign for the homebuyers who have been struggling to find a roof above their heads. But bad sign for the economy as a whole. Lower prices would mean, lower investment from real estate companies for a prolonged period of time and if it is a precursor to the oncoming recession, then these low prices could last for a few quarters or even a year or two.
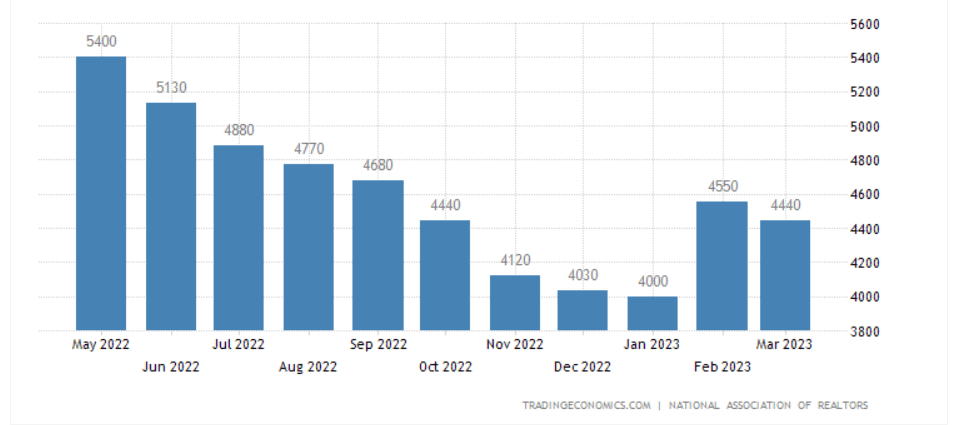
Existing home sales: Far from recovering from their early 2022 highs.
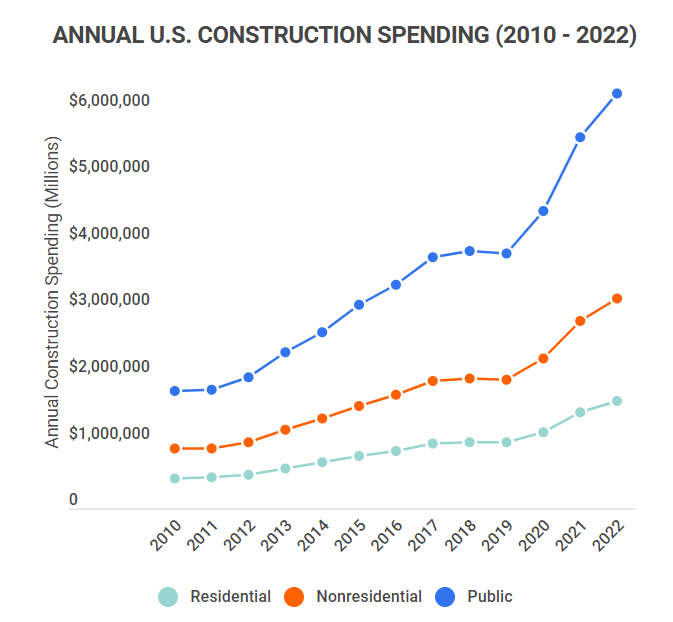
Annual construction spending: While public construction spending continues to be robust, that of private sector and the residential sector hasn’t been matching and are seeing a slowdown.
Construction industry unemployment rate: In line with the construction industry’s spendings, unemployment rate continues to be at multi-decade lows.
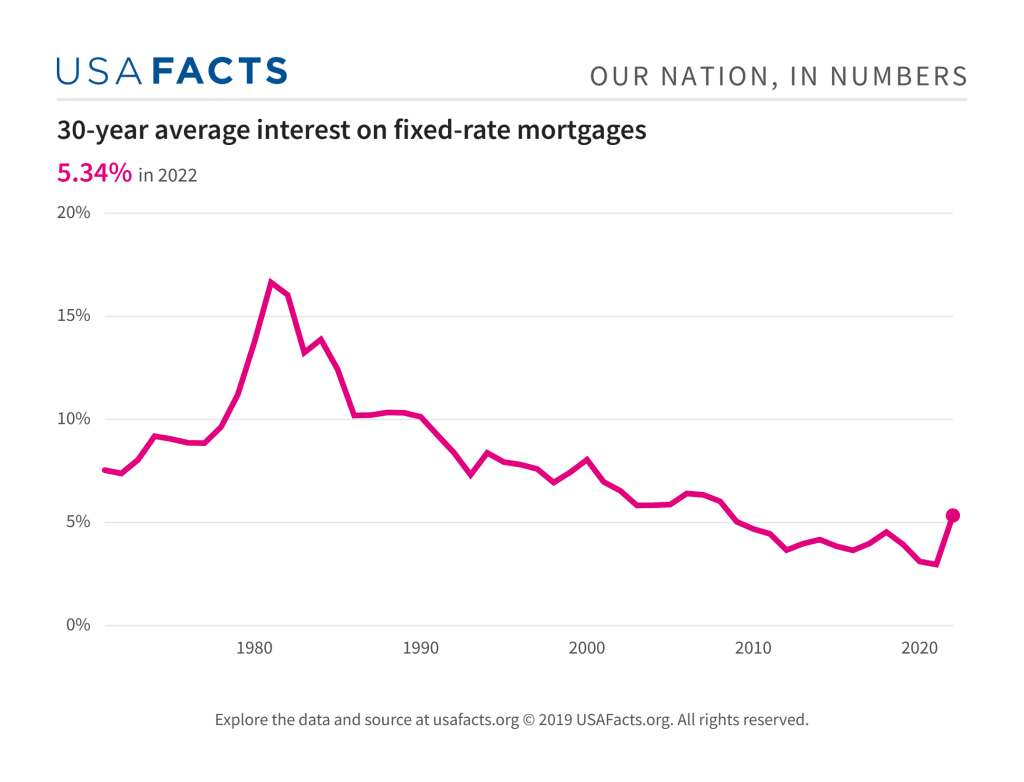
30-year mortgage rate: 30-year mortgage rate, expectedly are up and away as the Fed continues to raise rates. I would say the culprit for the slowdown in the housing market and the construction industry would be the mortgage rate. The longer it stays at this rate, the more difficult it would be for the overall economy to sustain itself.
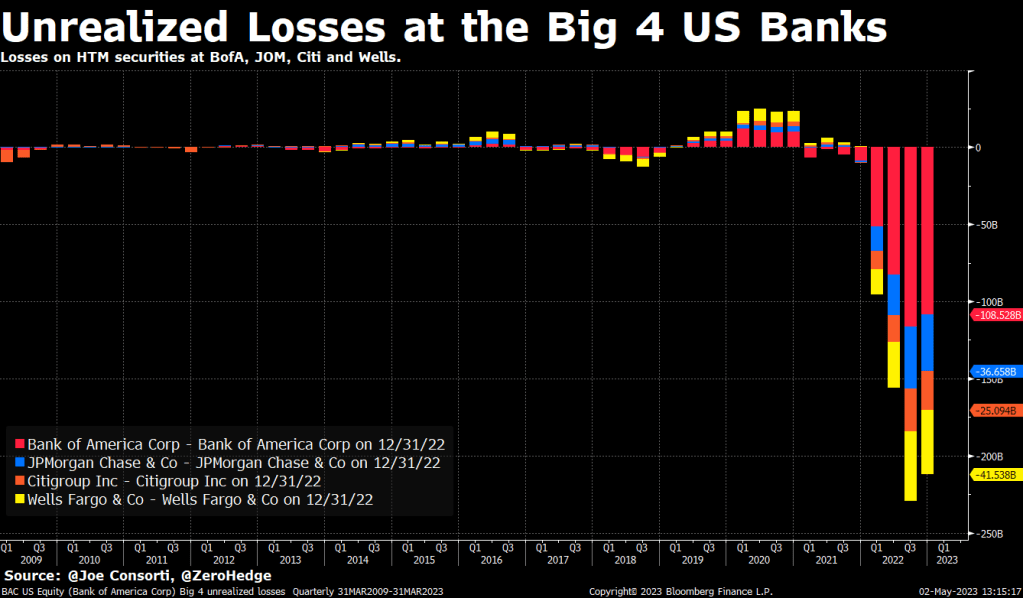
Sharing some related (yet unrelated) charts below: Unrealized losses at the Big 4 US Banks – to the tune of $41 billion. Thats not a small amount and its all due to the banks’ HTM (Held to Maturity) securities – i.e. all those bonds and securities that the banks have bought at higher prices (lower rates) and their current prices are way lower than where they bought it.
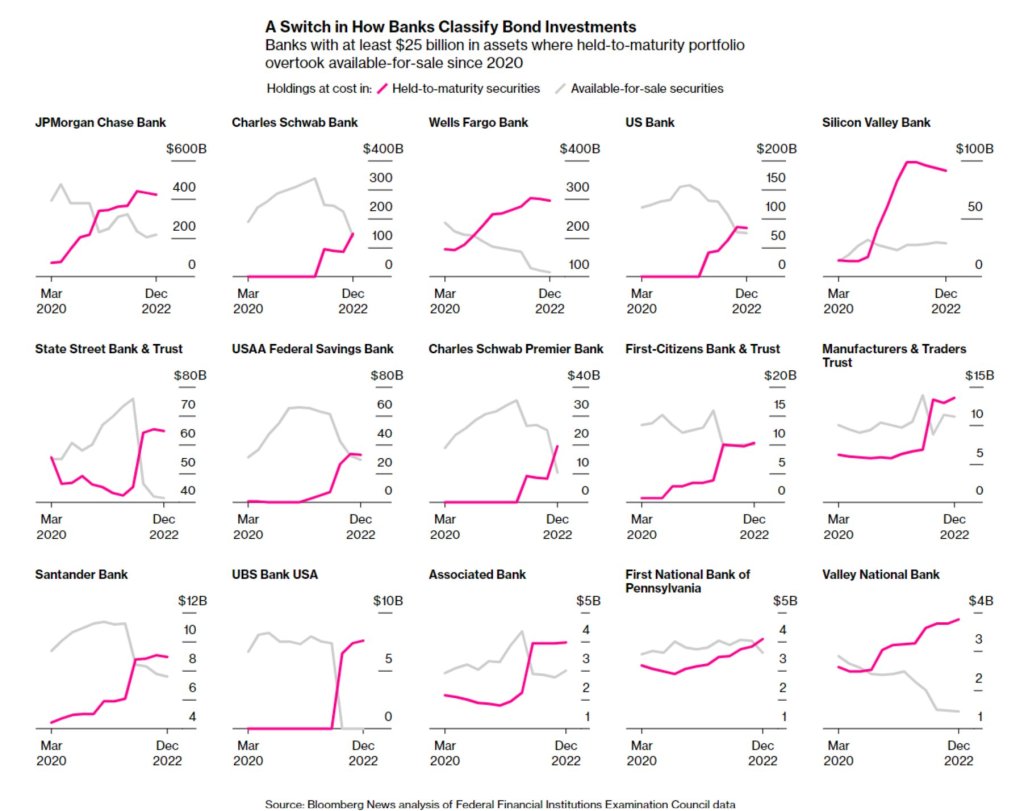
And the next chart shows something more dramatic: Due to the rise in rates, many of those banks moved their securities from “available for sale” category to HTM (Held to Maturity) category. Why? Obviously to push the can down the road so that they can window-dress their balance sheet and show profits to the shareholders, which otherwise would have been loss. Accounting gimmicks, the main culprit to hide the losses?
The micro view: For a change this week, I won’t be sharing individual charts on ES etc here today. Rather, I would take you all to this YouTube video that I did with Mukund where we talk about the week gone by and the view on the market for the coming week. Take a look here:

Leave a comment