A lot has been spoken about the recent market moves. Some think it’s a bear market rally while others say its a new bull market. I wouldn’t want to wager my money on this prediction game, but here’s something that I do want to share based on my experience of last 17 years of trading.
Market does what it does. Stock market is a discounting animal that discounts the future much before it has arrived. CPI inflation peaked in June 2022 at 9.1 percent, but given that the Fed was way behind the curve, everyone knew we have a long way to go in terms of Fed funds rates peaking out, which was at 1.5 percent back then. Even as Fed kept raising rates upto its last meeting, markets bottomed way back in October of last year.
Data and the expectation of the future rate path is something that the market started pricing in when we bottomed last year. Does that mean the bottom for the bear market is in and we are in a newfound bull market? As I said, I wouldn’t wager my bet on this prediction because predictions get you into biases and biased mind wouldn’t be able to take a decision when market turns for better or worse. All I’m coming at is even as we see markets breaking past key resistances on the charts, there is a discounting mechanism at work. Discounting of what “seems to be” lying in the future. So far that assumption is based on the fact that there won’t be any hard landing and peak of inflation is behind us.
Even as inflation continues to be stubbornly high, Fed raised interest rates in fast and furious manner, employment numbers haven’t come down much, adding folly to the fire of demand side of inflation. Typical stagflationary scenario as of now. Whether we see inflation coming down further or not and whether or not employment numbers change drastically to the downside, but markets are liking the fact that there is no hard landing as of now. Employment numbers are robust. Economic growth is fine enough and well above the contraction line. Corporate earnings for the 85% of the S&P 500 companies, that have reported earnings so far, have degrown by 2.2% as of May 5 (source: Factset) as against analysts’ expectations of 5.5% degrowth.
On top of that, investors have got a new reason to be bullish on a new sector – AI, thanks to what Nvidea has delivered. Propelling investors to pile into where there is growth. Nvidea is now trading at 201 times its TTM (Trailing Twelve months) earnings!
That brings us back to the question – is it even justified? Are we in a bubble called AI? We probably are, but do not try to time the bubble because many people did make a mistake of timing to short the market early on in 2021 but markets, as always, did what it does best – continued to rally all through 2021 only to give it back in 2022.
So, how do we trade in the current situation? As I had pointed in my earlier article, as long as this rally is not broad and only driven by a handful of largecap names, we won’t see a healthy bull market, nor would we see markets reversing if it has to. Looks like we are now in one.
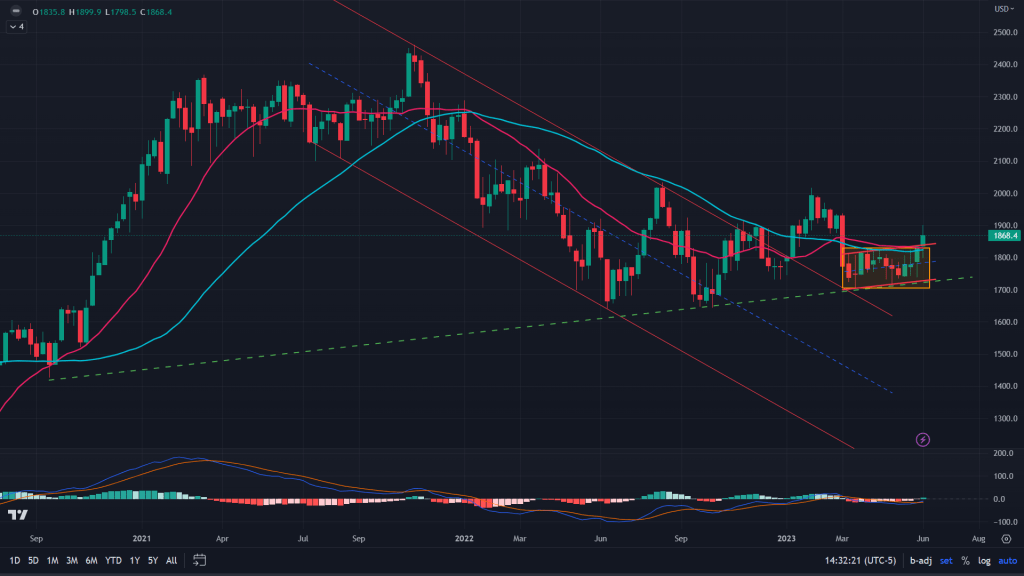
Russell 2000, the index of small cap stocks, has finally managed to break out of its long consolidation phase and now on the backtest mode. Let’s start the micros today with RTY:
RTY (weekly): RTY was consolidating for a very long time in that low base formation, which is usually a bearish pattern, but has not broken out to the upside and that’s bullish for the small cap index.
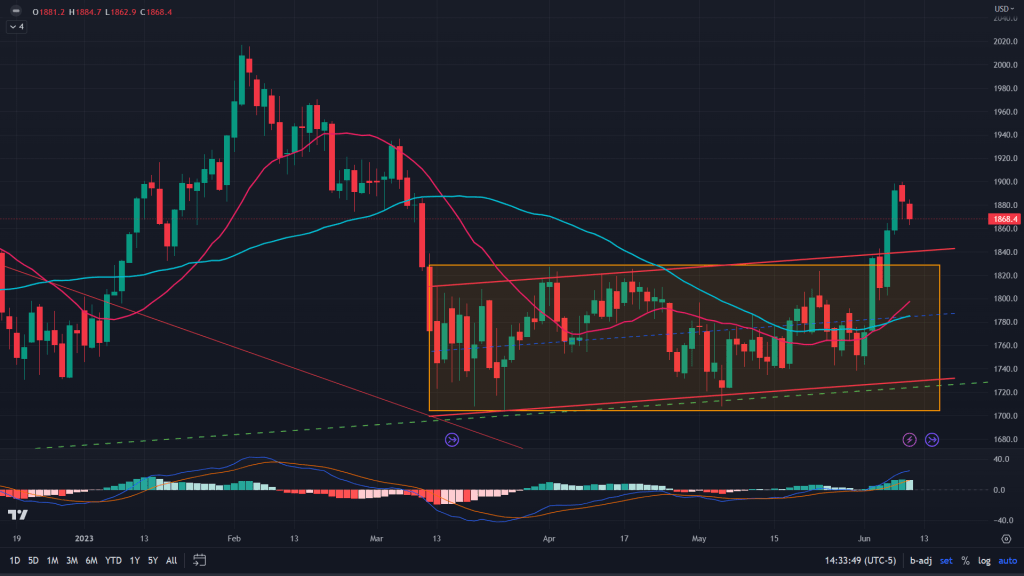
RTY (Daily): What’s more interesting is the backtest of this breakout – very very orderly. If it would have been a fake breakout, then the backtest wouldn’t have been so shallow and orderly, instead it would have been a fast and chaotic one. Makes me believe that even the small caps have leg to this upside that just started (of course only when the rally resumes after this backtest is done with).
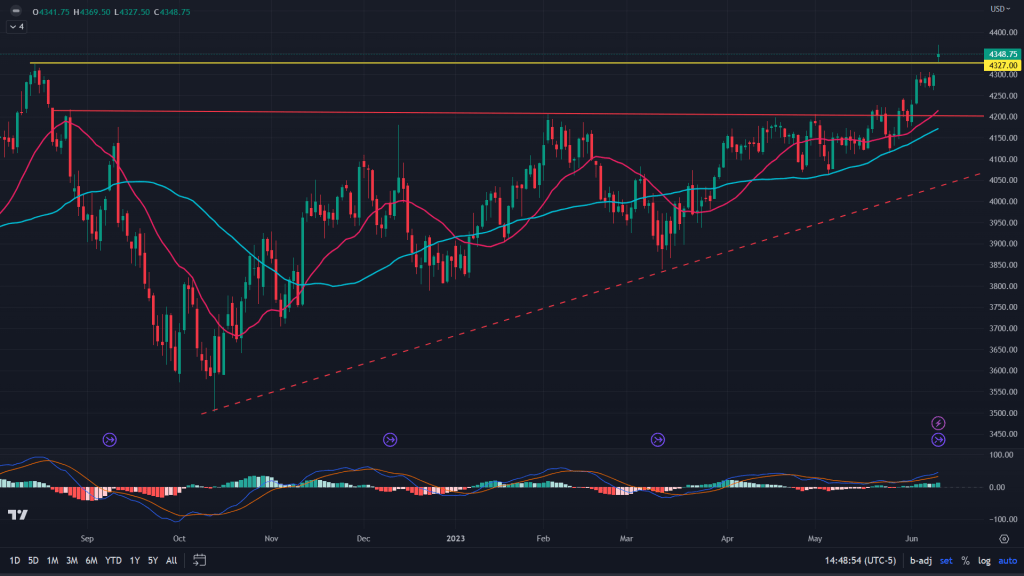
ES (Weekly): ES is on a tear. Last week it broke out of its long awaited 4200 resistance zone (ascending triangle). And in the week gone by, it also broke out of a key weekly supply line of 4327. What’s more interesting is, there hasn’t been a backtest yet, especially for the ascending triangle.
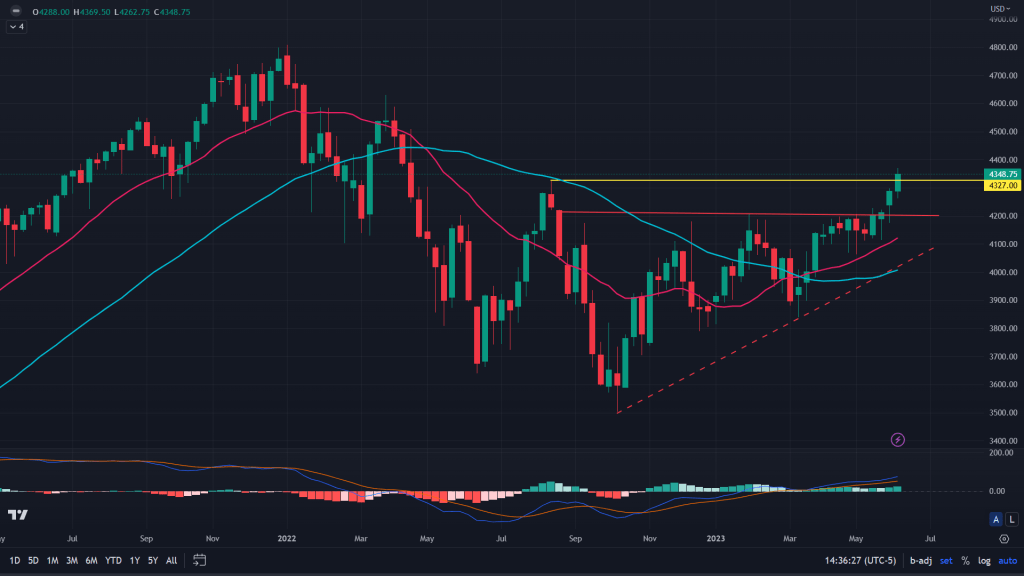
ES (Daily): When we zoom in, what gives solace is losing momentum in the form of lower highs in MACD as against higher highs for the ES. Which means we might get a much desired backtest/reversal in the ES, which would be healthy as long as it is orderly. Of course, its a big week with FOMC and CPI inflation on the horizon.
NQ (Weekly): Bears have been waiting for NQ to retract some of its gains (or may be a complete reversal) from 14367, which is 61.8% retracement level of last year’ entire fall. Comparing the rally to that of 2008’s when markets fell again after retracing 61.8% from the bottom. Not this time though, as NQ continued past this without much of a fuss.
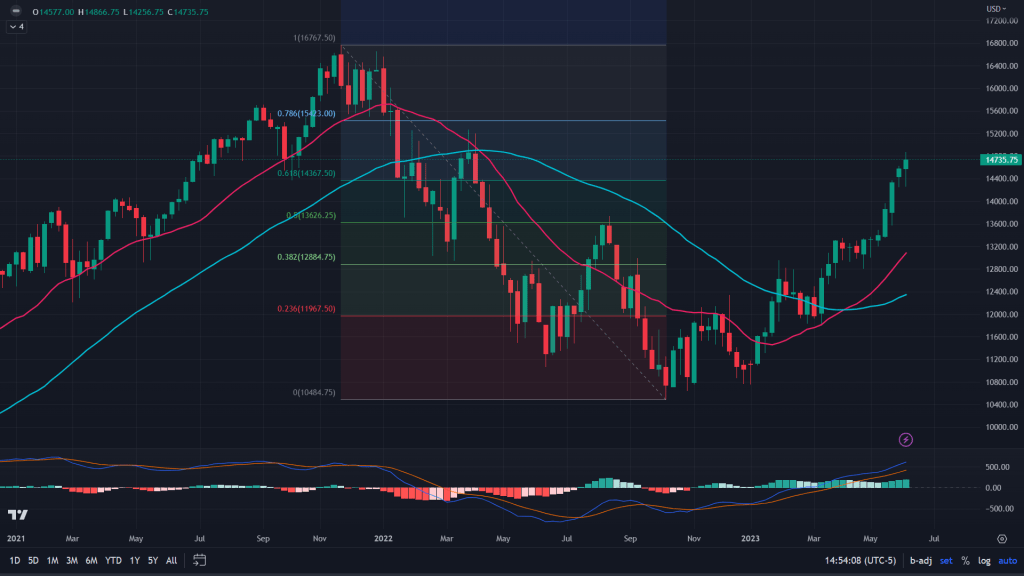
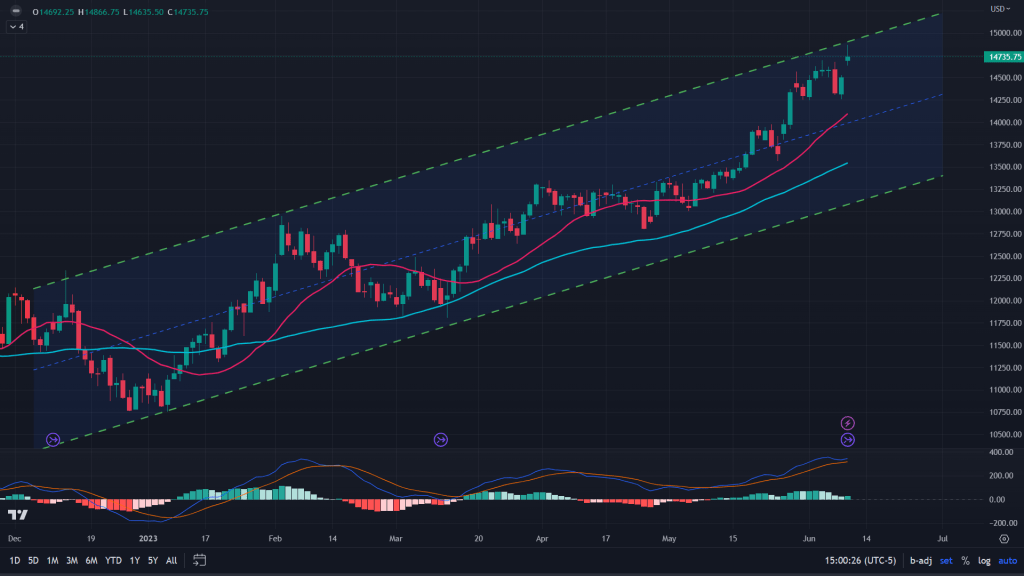
NQ (Daily): On the daily, though, it seems to be facing some resistance at upper end of this rising channel. Some clawback before any rally resumes may be?
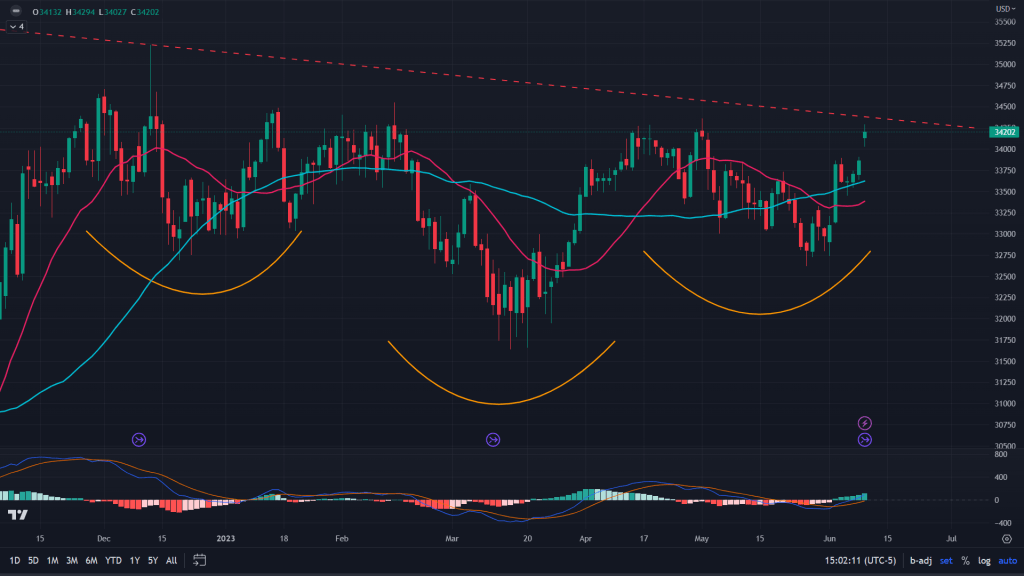
YM (Daily): Interesting times these are. While ES and NQ are looking for some clawback, YM is looking for a bullish breakout of its inverse Head and Shoulders pattern and as mentioned earlier, RTY is looking for backtest of the breakout. Rotation at its best!
Conclusion: Do not get into the timing of the top and bottom of the market. Keep it simple and continue to follow the price action. Bullish Dow, bullish Russel 2000 while ES and NQ would want to see some consolidation.

Leave a comment