Whoa! What a last couple of weeks have been! The bullish trend that we’re seeing in the market so far, is one of the most hated, unexpected yet delicious one in the recent memory. I say so because even I was on the wrong side of it during last October-December before I went back to my learning board.
Market humbles us all. The best one can do is accepting and learning from one’s own mistakes and moving on. If you choose to fight the market, be ready to lose it all. Because market won’t take revenge, it does what it does best – discounts what we don’t see.
Talking about discounting and seeing, lets take a deep look at what we have on the charts, starting with the ES – S&P 500 futures:
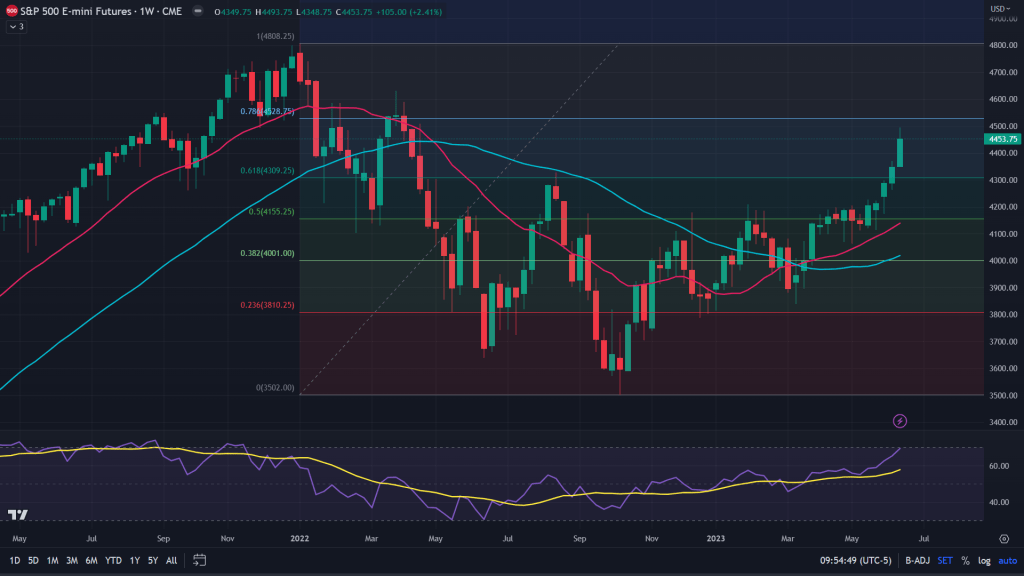
ES (weekly): It is important to look at markets from all the angles to ensure we aren’t missing any important technical developments which are out there in the plain sight and yet being royally ignored. While, I did look at and mentioned here about the risk of key Fibonacci retracement level on the NQ last week, I ignored the importance of the same on ES as well. But here we are – ES is sitting right under the key 78.6% Fibonacci level. While that’s important, what aides to the importance if RSI – sitting right where it was back in 2021 when markets hit all time high and then the sell-off began.
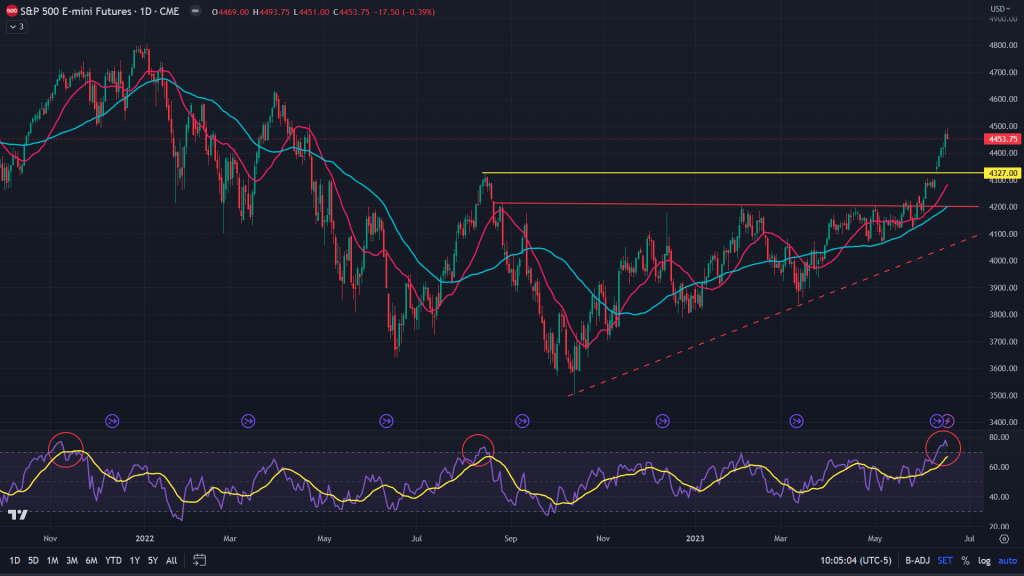
ES (Daily): Adding fuel to the fire of worries is RSI on the daily too – Previously whenever RSI was this high in the last 3 years, markets sold off.
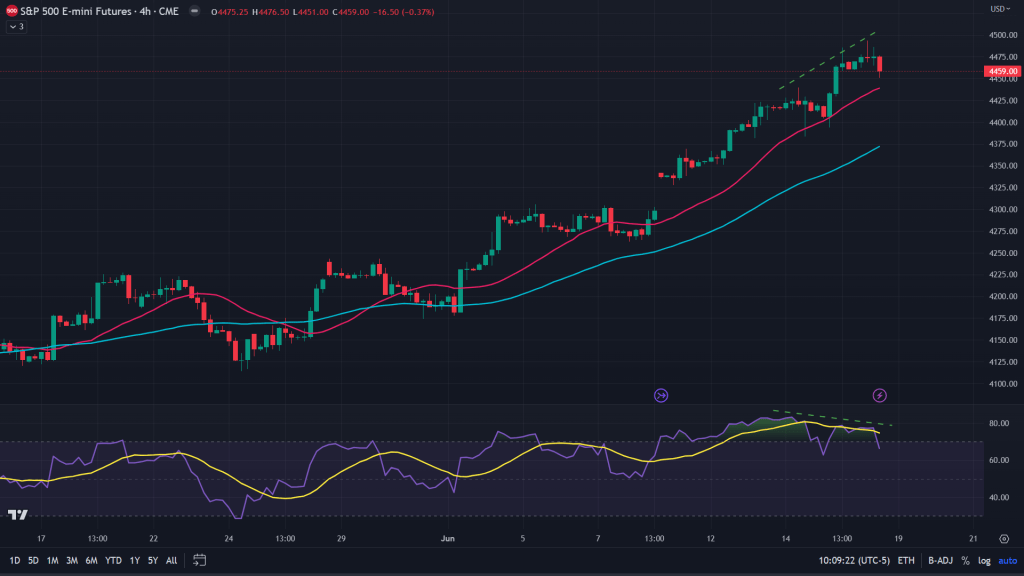
ES (4H): Zoom in further and you have 4H negative divergence on RSI as well as MACD which means momentum as well as strength petering off. Not a healthy sign to be long.
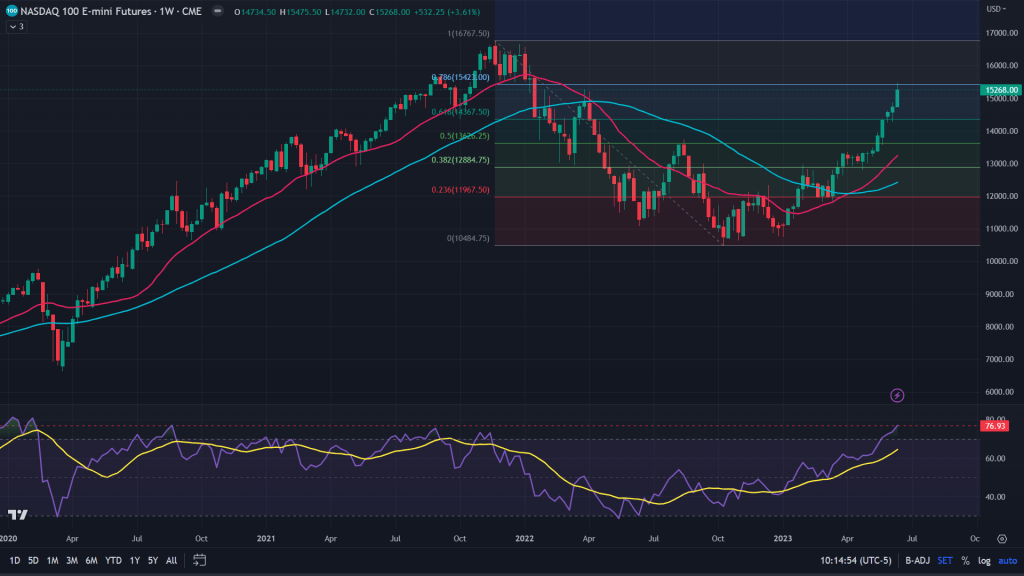
NQ (weekly): When we look at NQ, we have more reasons to be not go long here, at best I would be trimming my longs. NQ sitting right at the 78.6% Fibonacci retracement along with RSI on the weekly as high as last seen in Aug 2020. Now one might say, NQ rallied all of 2021 after that as well even as RSI dipped. That was a sign of negative divergence on the weekly while NQ made new highs all through that year. Also, the macro-economic backdrop back then was way different than what we have currently.
NQ (Daily): Zoom in and we have more reasons to NOT be long – Double top reversal, RSI at Sept 2020 highs on the daily while the vertical rally finds catalysts to retrace. I would be trimming my longs here as well.
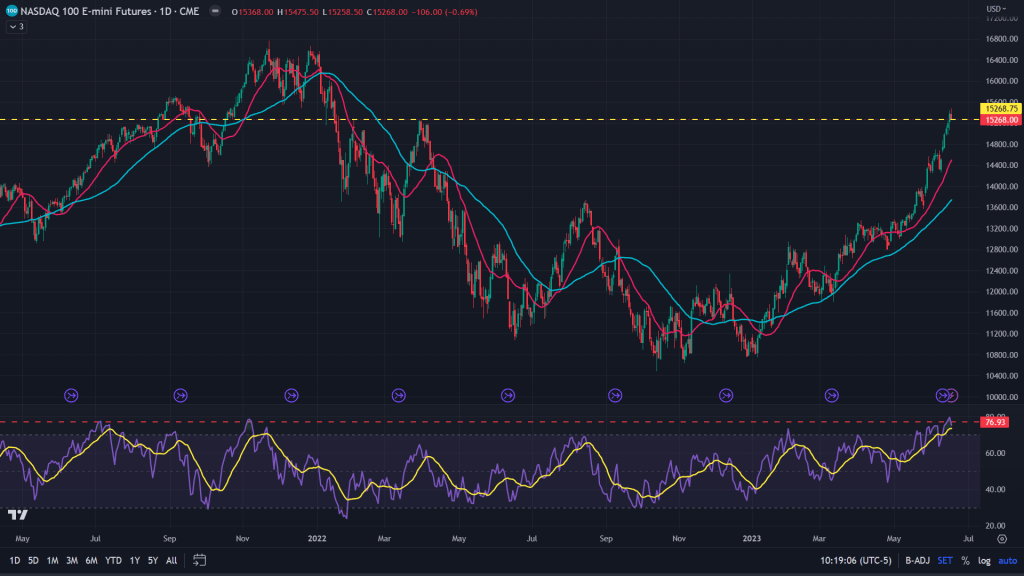
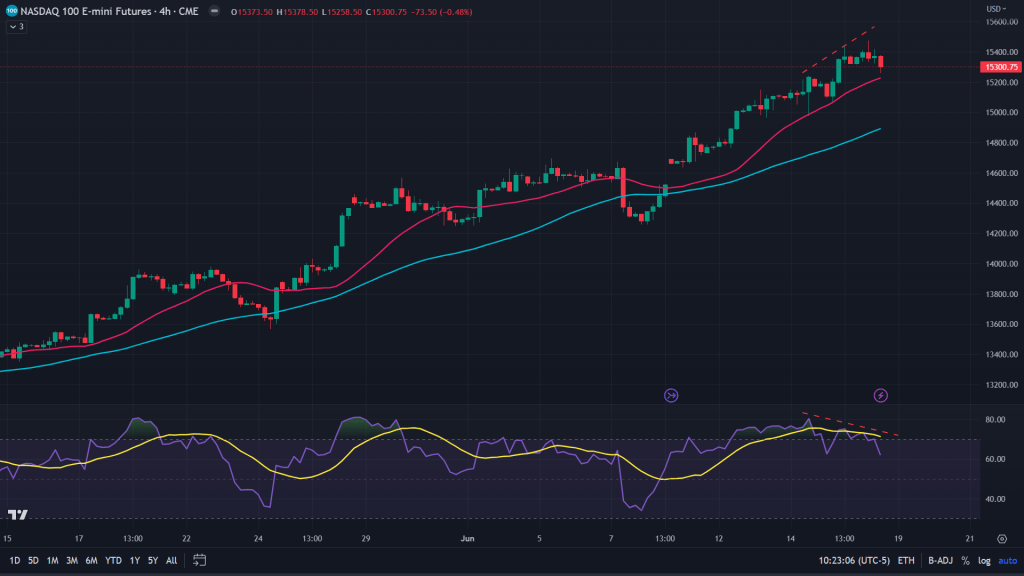
NQ (4H): Zoom in further and we have negative RSI divergence on the 4H.
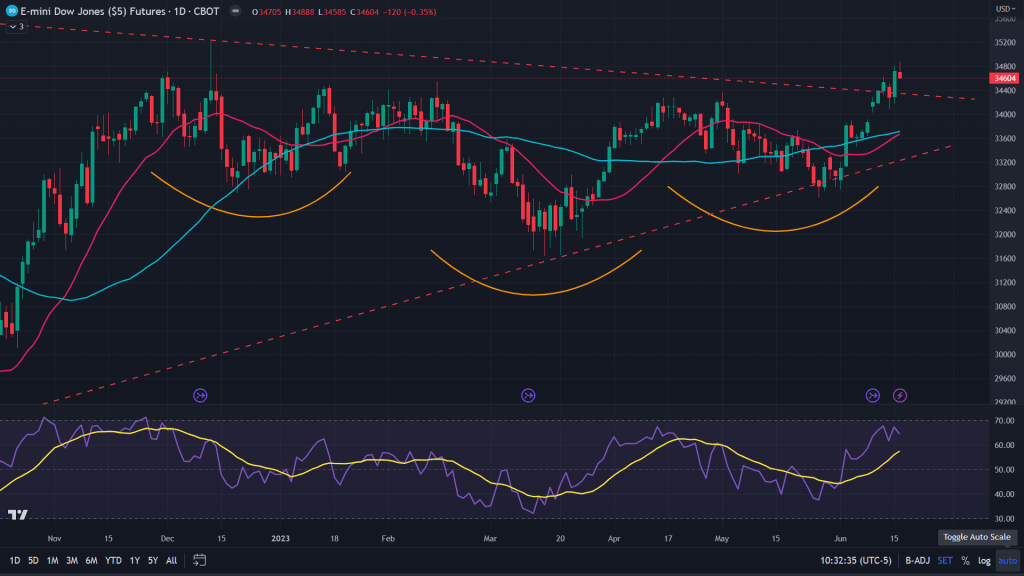
YM (Dow Jones Industrial Average) – Daily: The only index future that still has some strength left on the daily is YM where the breakout of the inverse H&S just occurred and we may see some small retractions before a rally resumes.
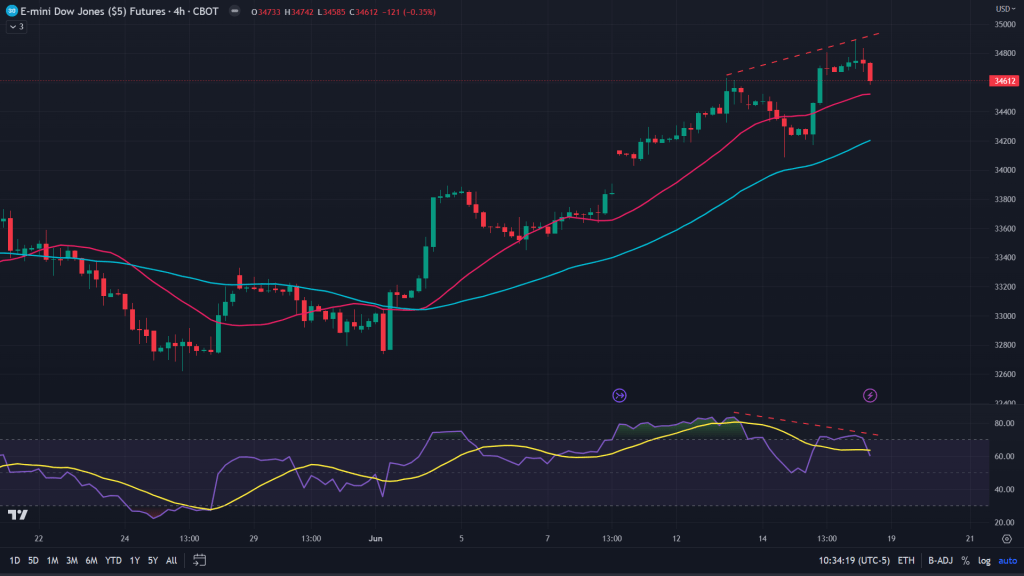
YM (4H): The retracement that I talked about above is based on the fact that RSI is negatively diverged on the 4H and deserves to be respected with some pullback.
Conclusion: I would be taking my chips off the table and start initiating shorts in small tranches on NQ and ES. Apart from imminent retracement, I do see a possibility of the bounce towards 4600 or thereabouts on the ES while NQ may still dwindle around due to its vertical rally.
Fundamentell’s Weekly market roundup with Mukund:

Leave a comment