Nothing. If you are wondering whether markets have topped out for good and we are headed all the way towards last year’s lows, then this post if not for you. Simply because as I keep saying, I don’t indulge into the argument of predictions or trying to time the tops and bottoms. This predictions based analysis results into biased mindset and then emotion takes over the rationality of price action. End result – Market beats you. I would rather be with the market and NOT beat the market.
With that in mind, let’s start with where we left last week – Yes, we timed our shorts perfectly. The signs of exhaustion and loss of momentum were all there for us to see and capitalize on, which we indeed did if you followed the advise here and of course tweetstorm on my twitter feed. Let’s now take a look into what are our charts saying:
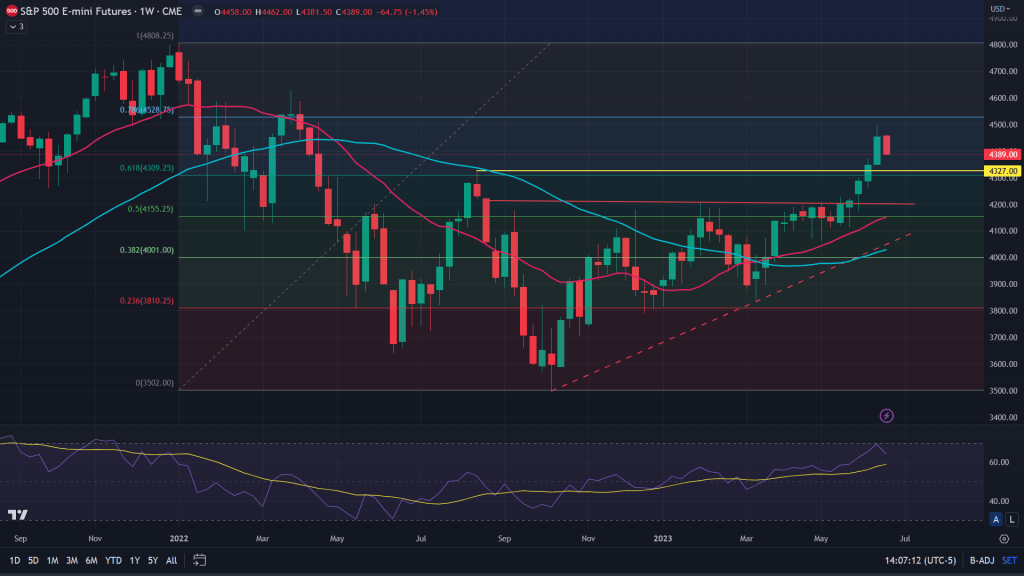
ES (Weekly): As mentioned last week, apart from the extended RSI (which is now cooling off) and almost 78.6% fibonacci retracement of last year’s fall, all we can see markets doing is probably backtesting 4327 demand (earlier supply) zone.
ES (Daily): Targeting the gaps left on the upside?

ES (4H and 1H): We’ll take a look at 4H and one hour charts together to understand what’s on the cards.
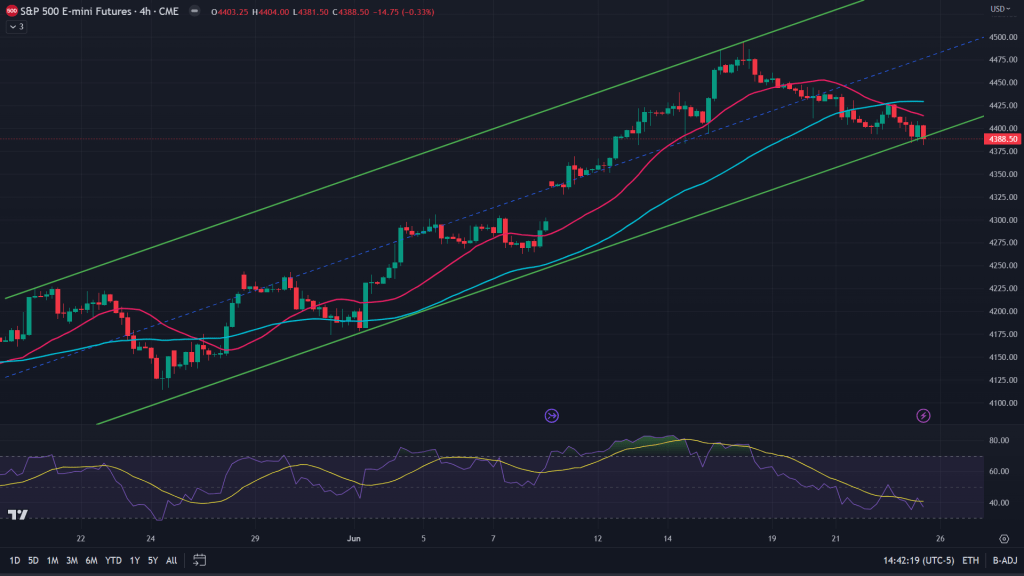
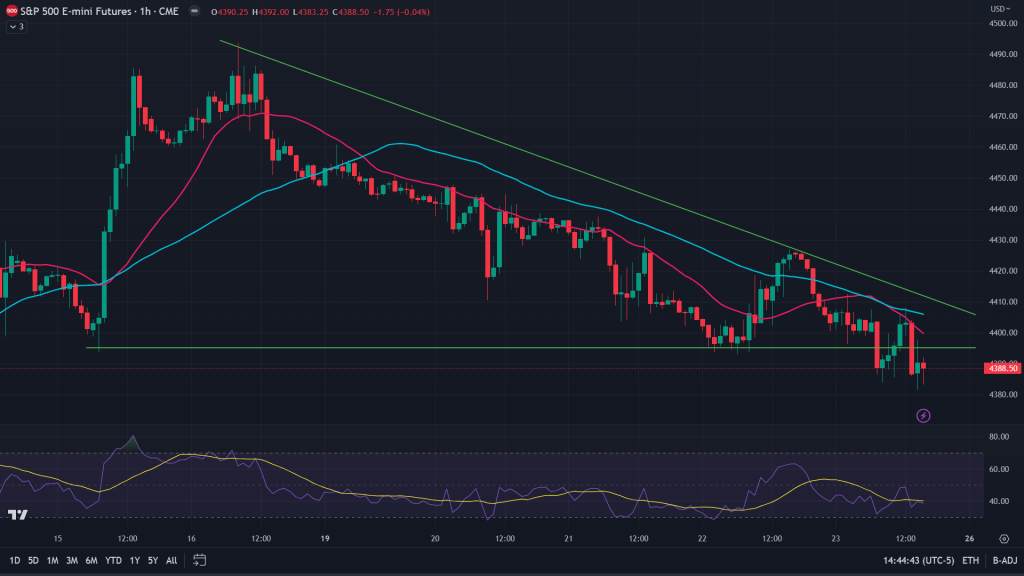
So, the 4H chart and the hourly chart both showing further weakness ahead for us as the breakdown of descending triangle is almost there on the hourly whereas on the 4H chart what’s visible is we’re on the verge of breaking down of the channel. Once these breakdowns accelerate, we should expect the gaps to be filled on the daily chart:
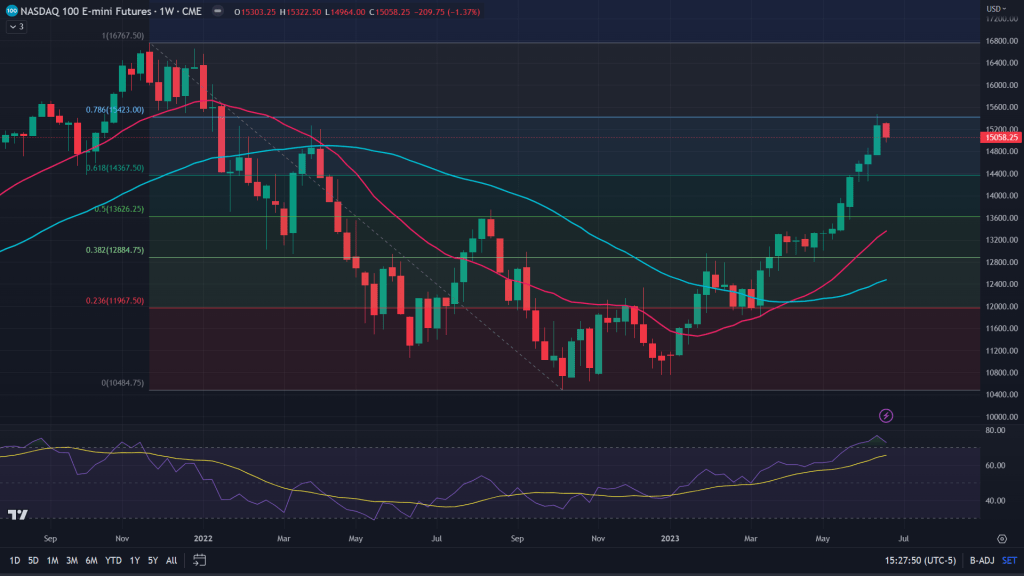
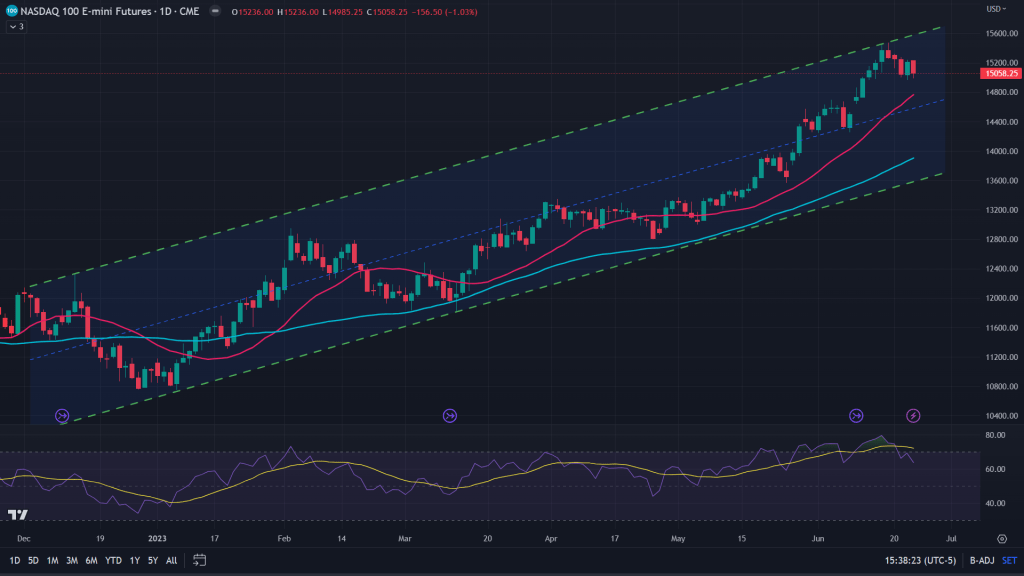
NQ (Weekly): Didn’t we talk about this danger of markets trying to retrace from 78.6% fibonacci level? It did exactly that.
NQ (Daily): Apart from retracting from the fibonacci level of 78.6%, NQ also found pressure from upper end of this channel on the daily chart. While there is also a gap to be filled on the downside between 14526.75 and 14635.5.
NQ (4H): I have two different charts on the 4H and both have different repercussions on the chart. Let me explain first chart first: Its forming a falling wedge, which is bullish once broken to the upside.
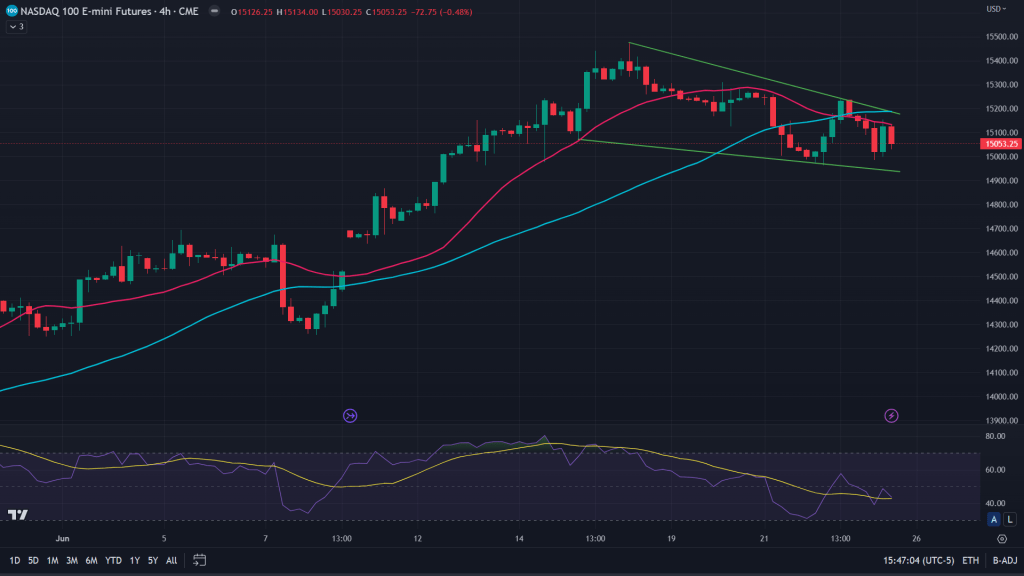
And then there is also this descending triangle, which is bearish:
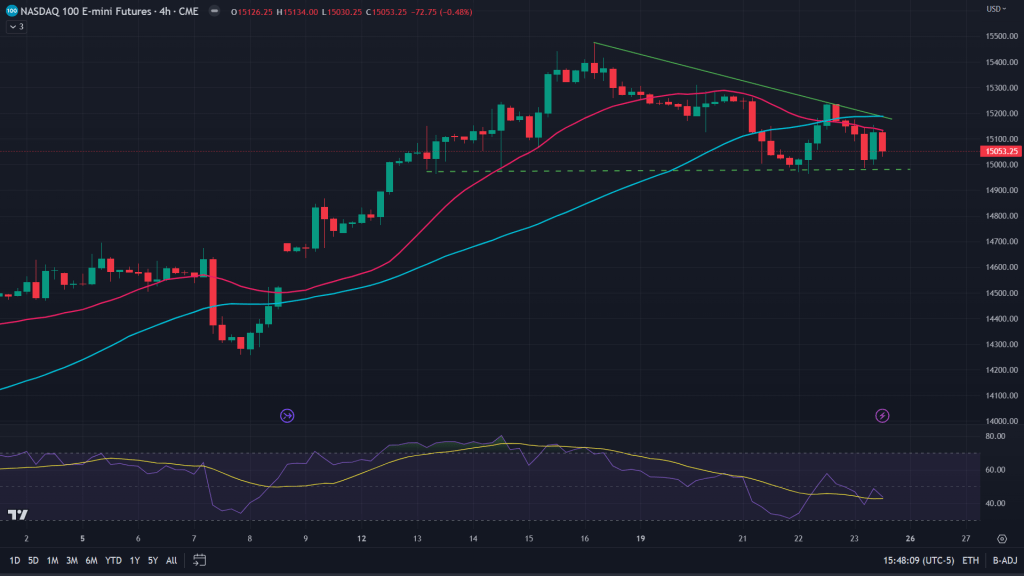
I wouldn’t be betting my bets on the upside as of now, unless market tells me otherwise.
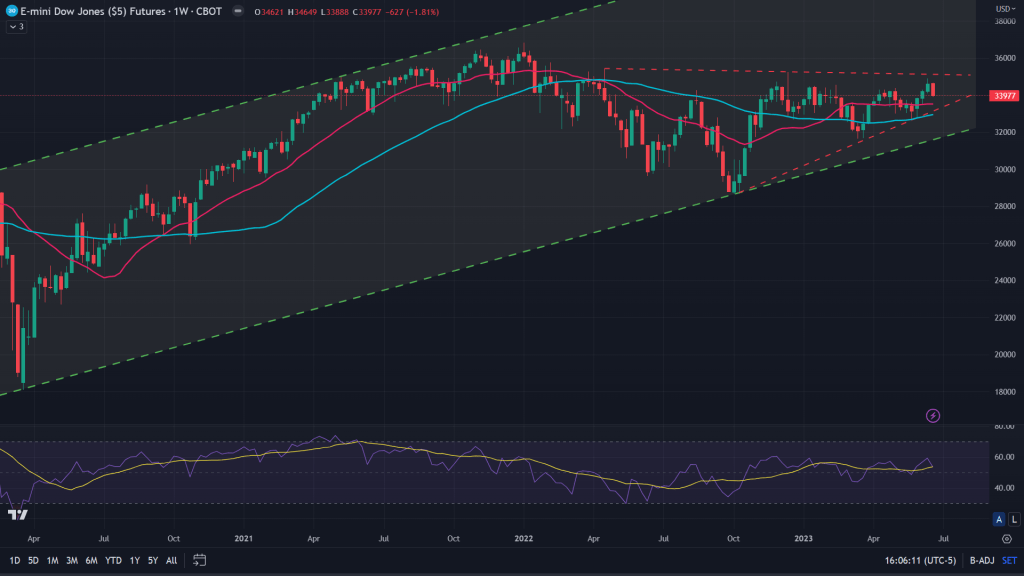
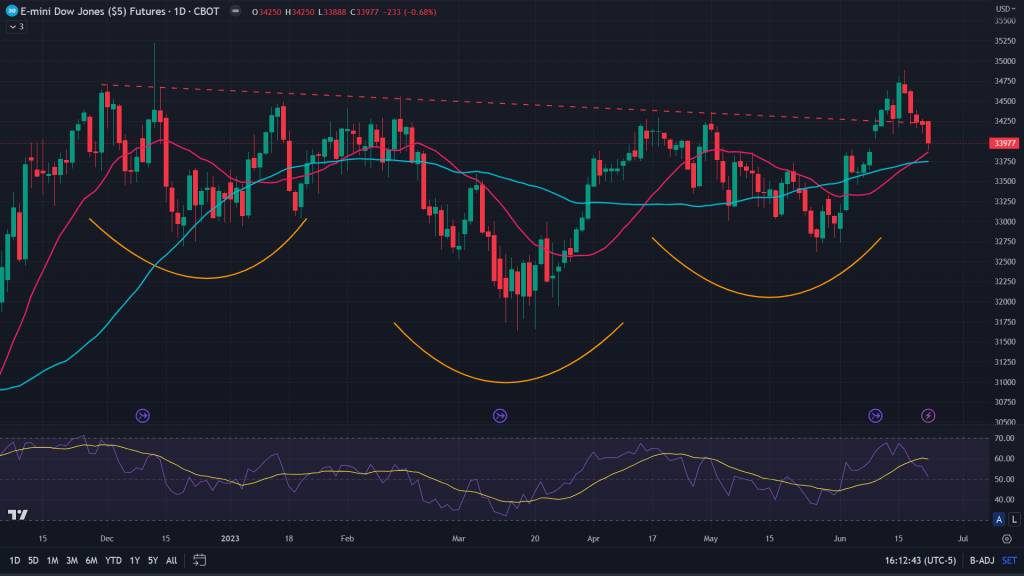
YM (Weekly) – From the drawing board: I took a relook at the Dow Jones chart on the weekly to understand if we’re missing anything. Indeed we were – this ascending triangle on the weekly (red dashed lines), which is bullish!
YM (Daily): While that ascending triangle on the weekly is a bullish one, we already had bullish inverse Head and Shoulders breakout last week, which has quickly backtested this week. Not only has it backtested, it has covered the gap of that was left unfilled during recent upmove. What next? Can the 20MA rescue the bulls? We are right there and bulls can definitely pin their hopes on the combination of 20+50 MAs along with all those bullish patterns visible.
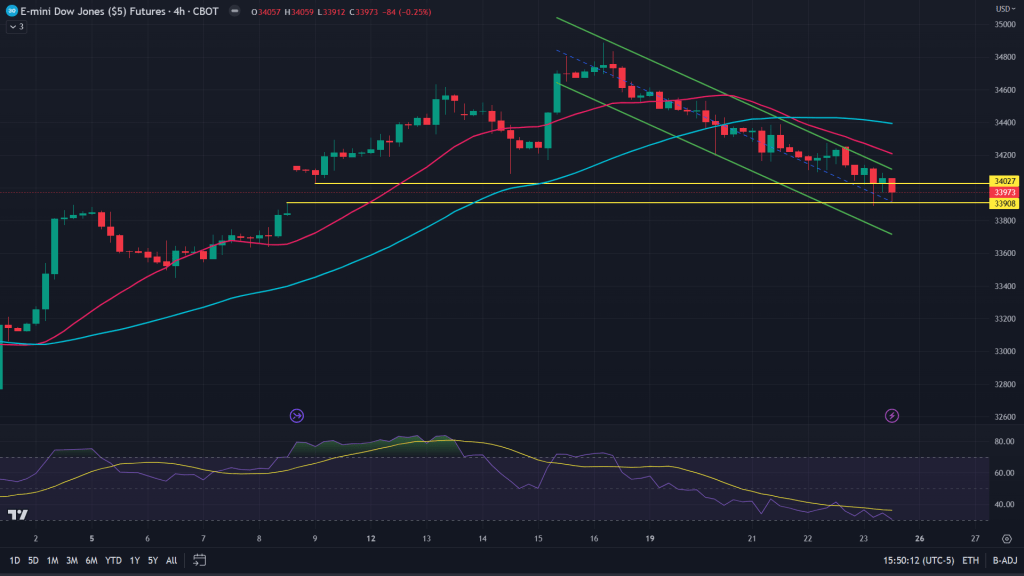
YM (4H): Zoom in and we see a decent bull flag on the 4H thats been forming in this downside move.
RTY (Weekly): As I have said in the past, any bull market can not run with full throttle unless small caps participate. Just when we thought small caps are joining the game, we had this correction that’s making things jittery all the more. What’s more interesting is the fact that small caps have fallen more than their larger counterparts! That’s something to worry about. Last hope for the bulls would be if RTY manages to bounce back after last week’s backtest of the breakout. It also has this 200 weeks MA which is just around the price where it closed last week. I would watch this space far more closely than anything else.

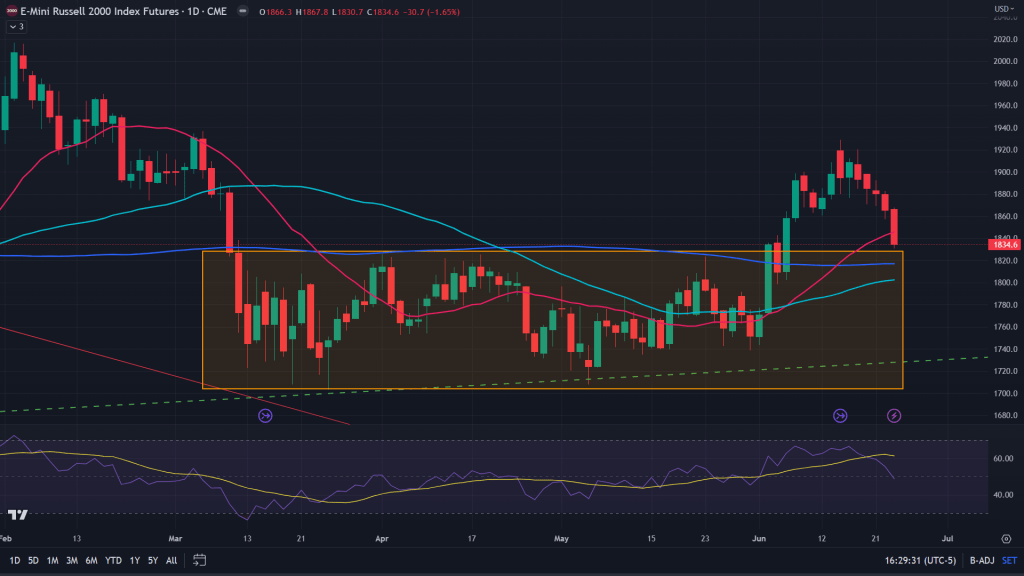
RTY (Daily): Backtests can result in a powerful rallies if it is supported by the moving averages. While weekly 200 MA is just around the closing price of last week, so is 20 MA and 200 MA on the daily! That would be a deadly combination for the bulls to come back with full force.
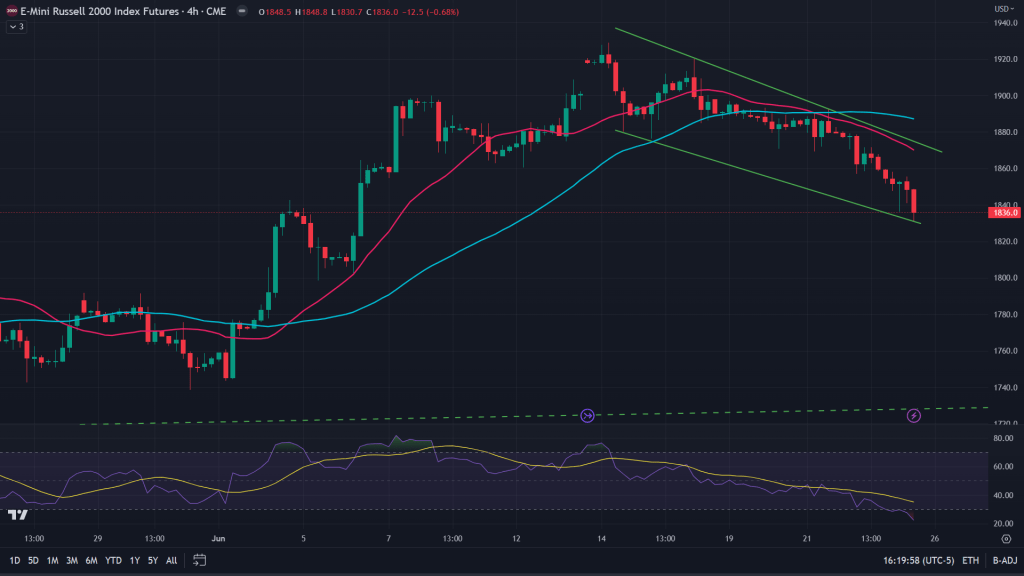
RTY (4H): On 4H, we see a formation of a falling wedge, which is bullish!
Conclusion: While ES and NQ still have downside gaps to be filled, but it is worth noting that these gaps are not a line in the sand that has to be respected. Market may not even go all the way down there and may turn a corner. For us to gauge whether market does turn show a turnaround or goes down the drain, you would want to keep your eyes on the small cap names!
Weekly markets update with Fundamentell’s Mukund Mohan:

Leave a comment