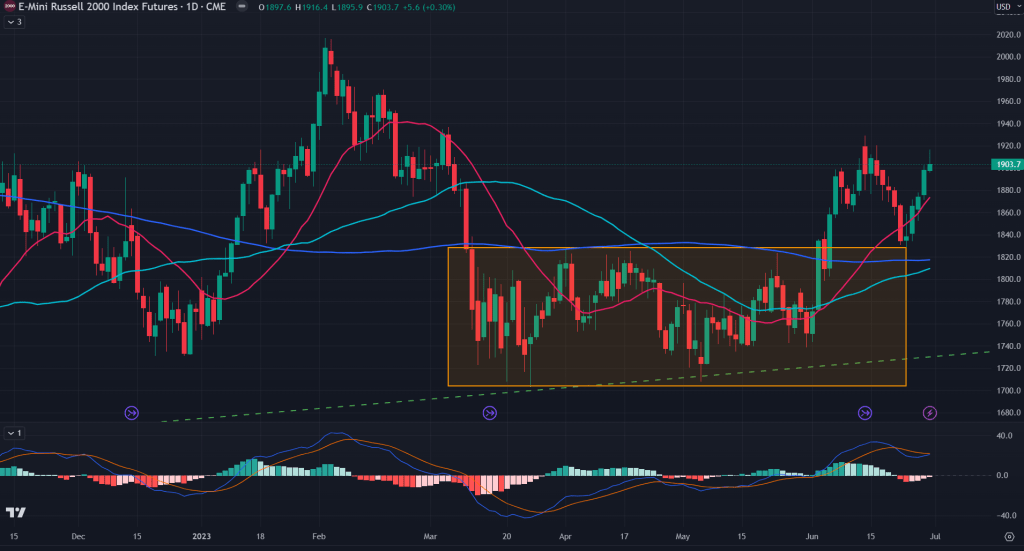
For the past few weeks I have been talking about the importance of smallcaps to participate in this bull run. For about 3 months markets rallied but the rally wasn’t broad based. And then came the week of June 26th.. it delivered an unexpected rally after the RTY mean reverted and backtested the consolidation zone breakout point. So, let’s deep dive in and see what is likely to happen next. We’ll start with RTY first.
RTY (Daily): What we saw last week was something that’s typical of a bull market – Rally driven by mean reversion and backtest of a breakout! As I pointed it previous week, this week was critical for the markets, more so from small caps point of view. It could either rally or fizzle out into the abyss. But boy, did it surprise us!
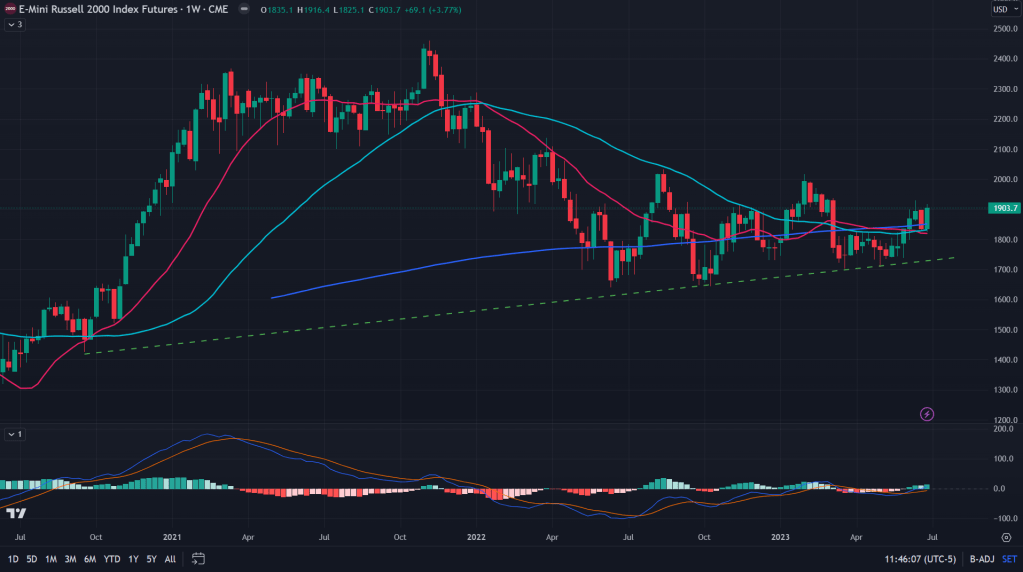
RTY (Weekly): When we zoom out to the weekly chart, what’s more interesting is the fact that the weekly green candle was a bullish engulfing one, powerfully aided by 200 weeks MA. Although, for the past one year, market has been playing around with the 200 weeks MA, but this time it’s different. Why? Because of the factors mentioned above on the daily chart.
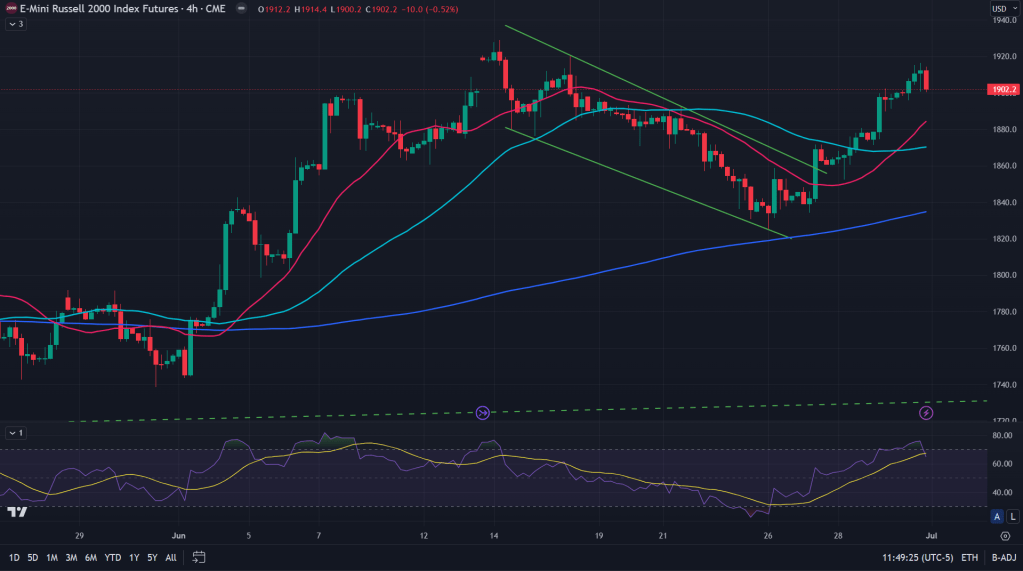
RTY (4H): On 4H charts too, it was a bull flag breakout that triggered a massive rally. Although, RSI is pointing to a heating market ahead and it makes sense to take some chips off the table after this stupendous rally.
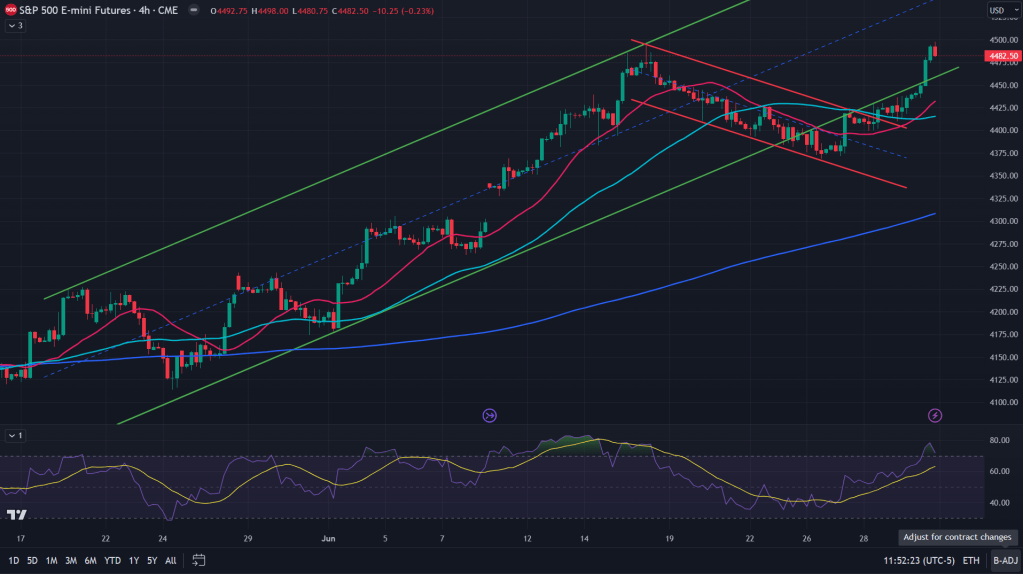
ES (4H): As I had warned in previous week’s post, ES had broken down off this green channel and was sitting at the bottom of this bull flag.. all it needed was a support from the broader market and it wasn’t disappointed. Breakout is what it got later in the week, making the previous breakdown as a failed one.
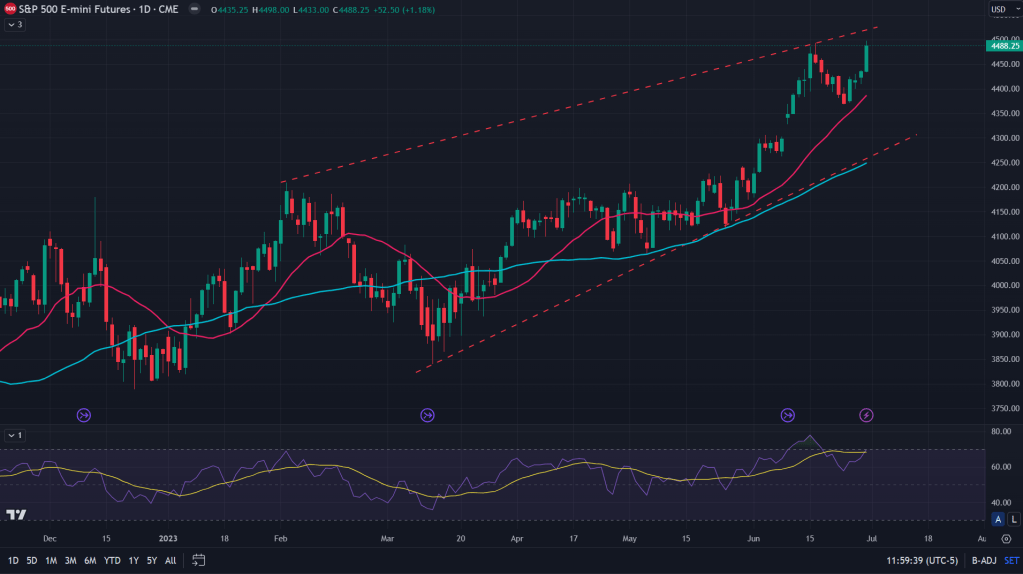
ES (Daily): On the daily chart, while that gap on the downside still remains, market preferred to bounce off the 20 MA mean reversion. In doing so, there is also a possibility of rising wedge formation (dashed lines only means it is still early days).
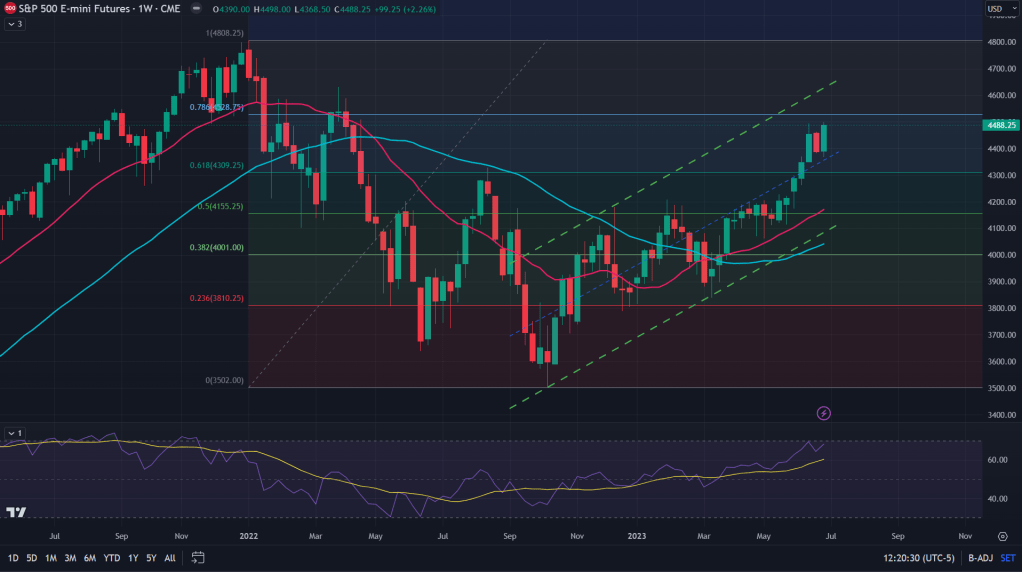
ES (Weekly): Zoom out and while weekly shows the risk of 78.6% fibonacci retracement still lurking, but it looks weak now on a retest. I would assume this fibo level to be broken on the upside and we might test upper end of this green dashed channel (again, dashed line mean, it is still early days for us to say this channel would form).
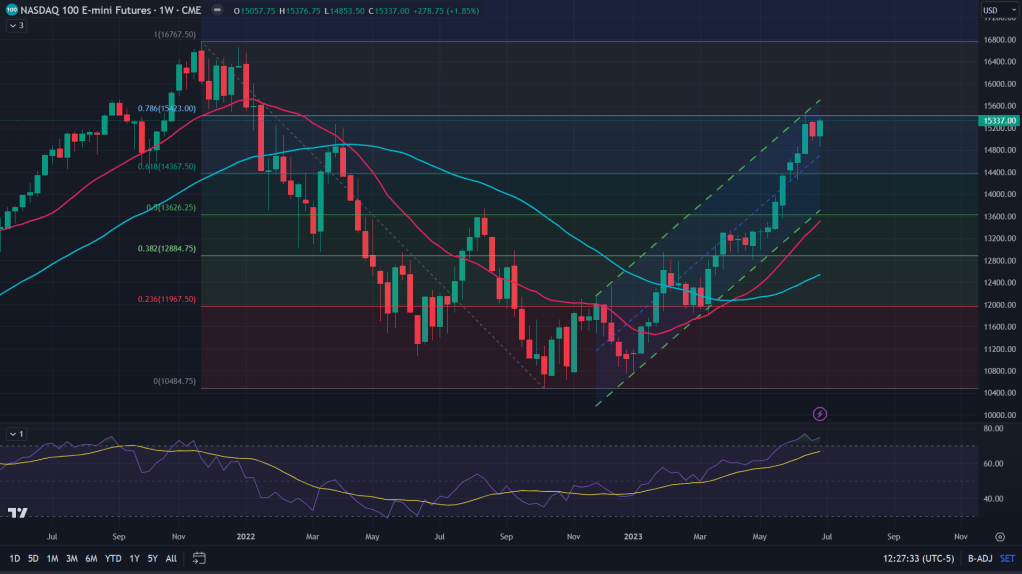
NQ (Weekly): Just like ES, even NQ is right under its 78.6% fibonacci retracement level of last year’s fall. Not only that, NQ is sitting right at upper end of this green channel.
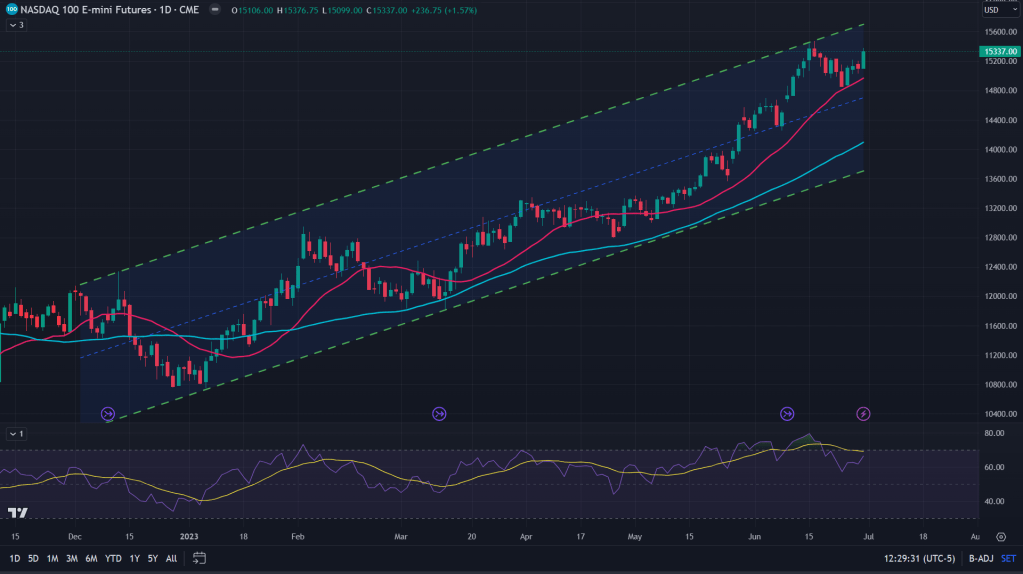
NQ (Daily): Yet again, we saw 20MA mean reversion bounce on the NQ and previous high is on the cusp of being broken.
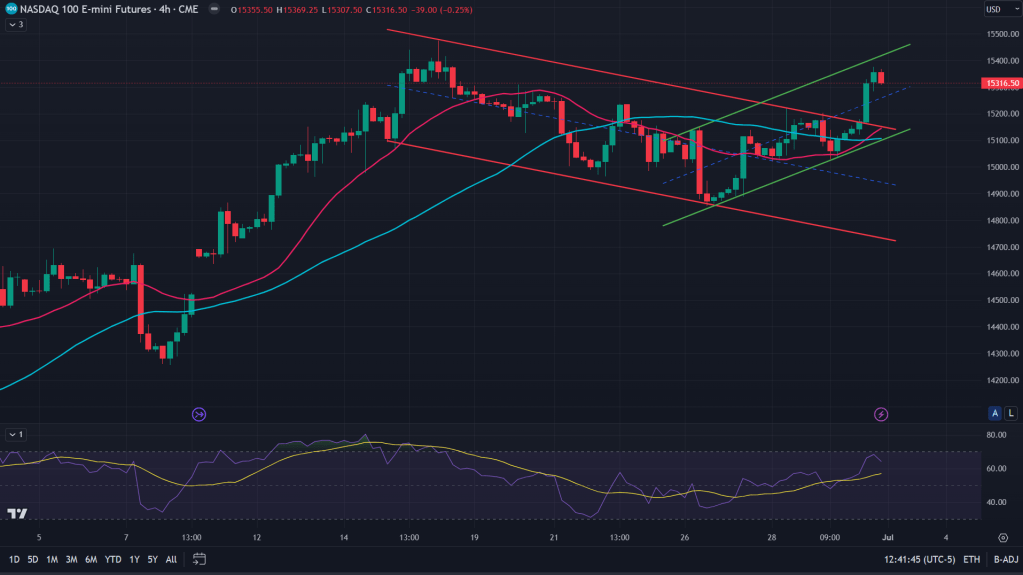
NQ (4H): On 4H though, the bull flag breakout that we saw later during the week, might get backtested as there is a resistance in the form of upper end of this green channel.
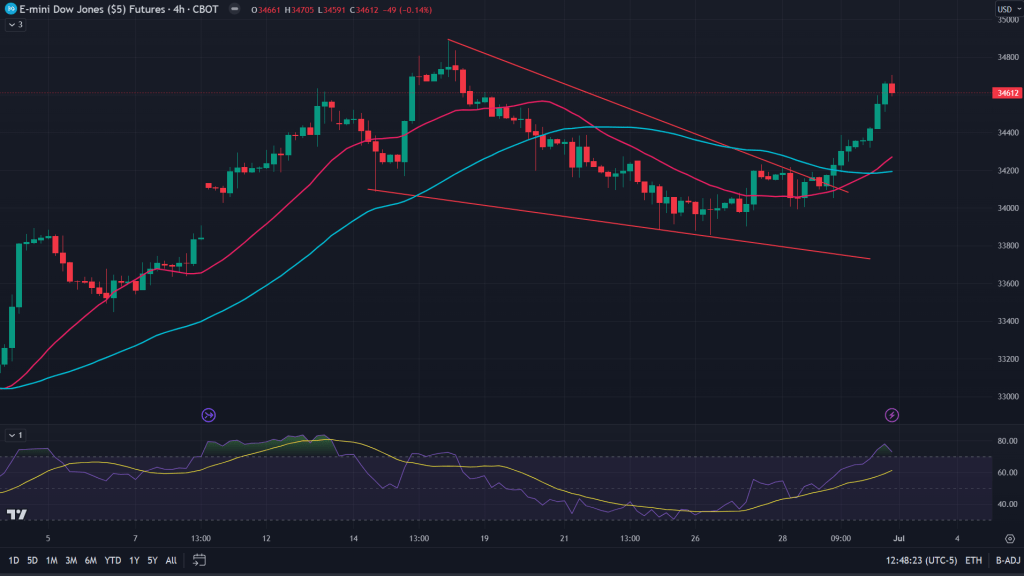
YM (4H): While, ES and NQ broke out of a bull flag, YM broke out of a falling wedge on 4H charts, while RSI is reaching overheating zone.
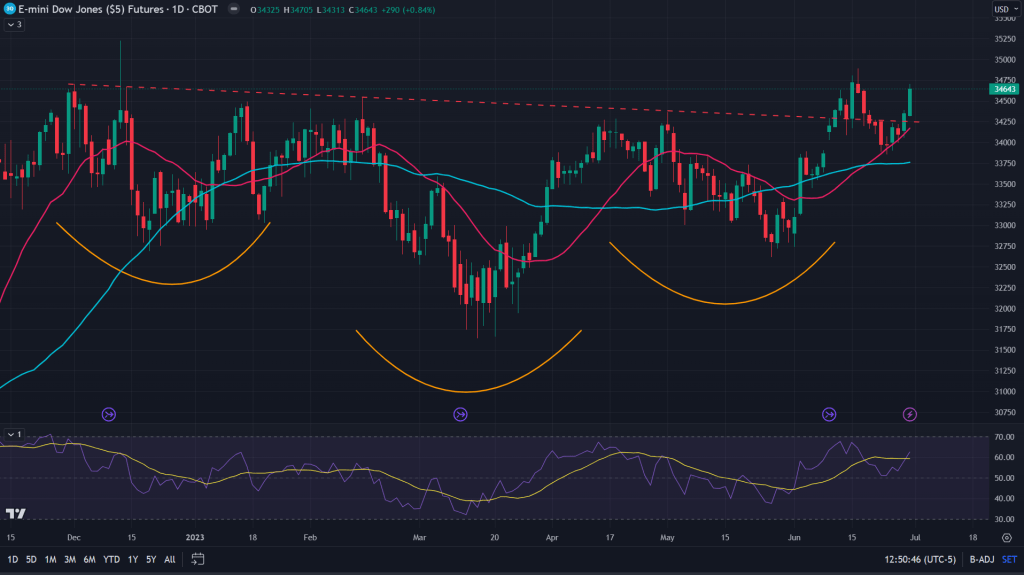
YM (Daily): Yet another chart and yet another 20MA mean reversion, backtest (of inverse H&S) and a V-shaped rally.
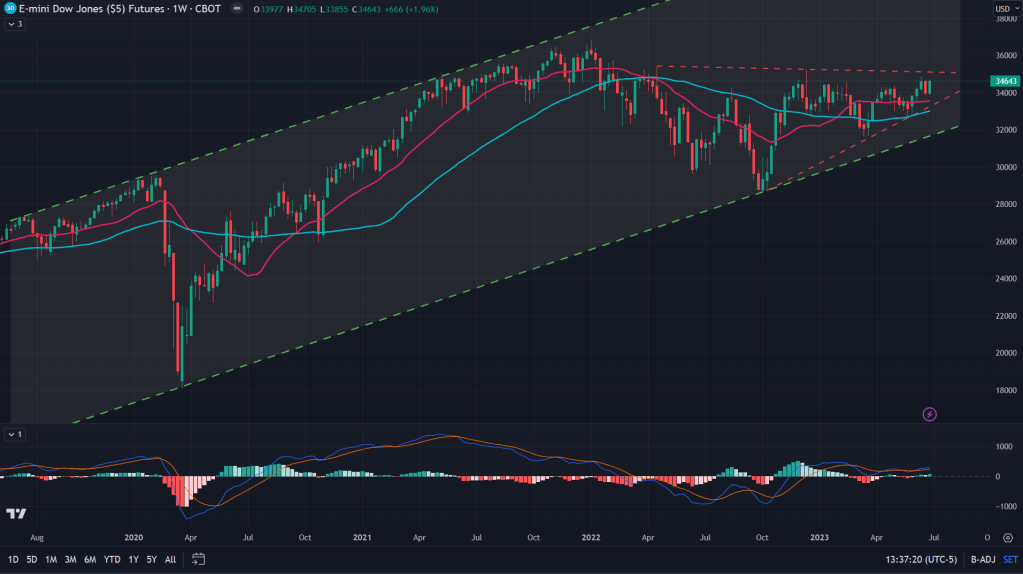
YM (Weekly): Zoom out and it looks like there is a lot left to be seen to the upside from industrial stocks point of view. YM – Dow Jones Industrial Average Index, is forming an ascending channel (red dashed lines), along with taking support from 20 and 50 MAs on the weekly chart.
Conclusion: This market remains buy on dips for now, the rally going ahead seems to be driven by small caps and soon by industrial names.
Some anecdotes based on monthly charts:
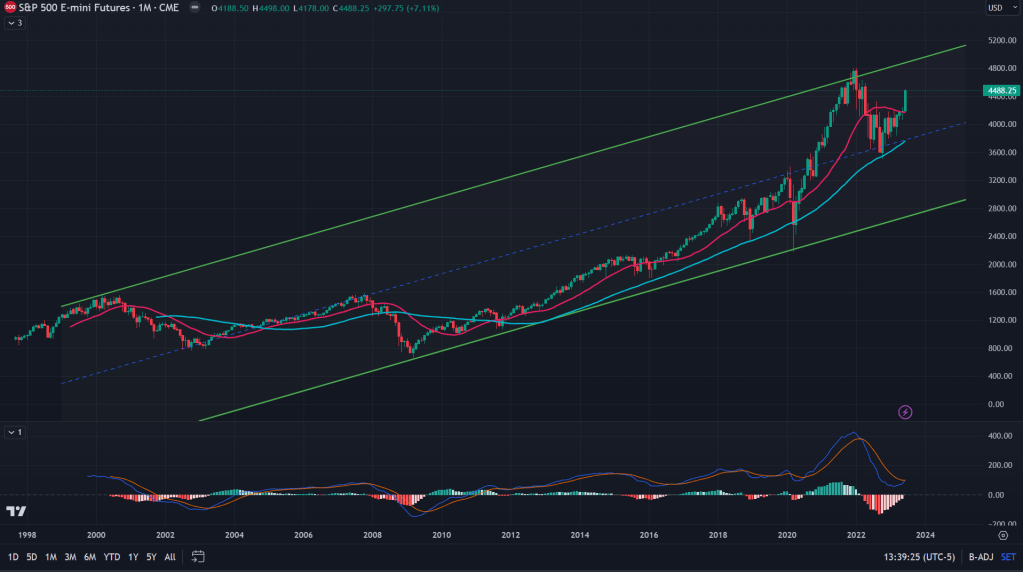
ES (Monthly): Although the 20 monthly MA looks stretched and needs smoothing of the curve, but given the bounce off the lower end of this long term channel (green) and another bounce off the 50 monthly MA last year, I won’t be surprised to see all time highs coming up on the ES along with negative MACD divergence here, before a final dump. Now, this is not a prediction and I really have no clue if this is what seems to be happening. But given the cards on the table, this scenario looks more likely to be playing out.
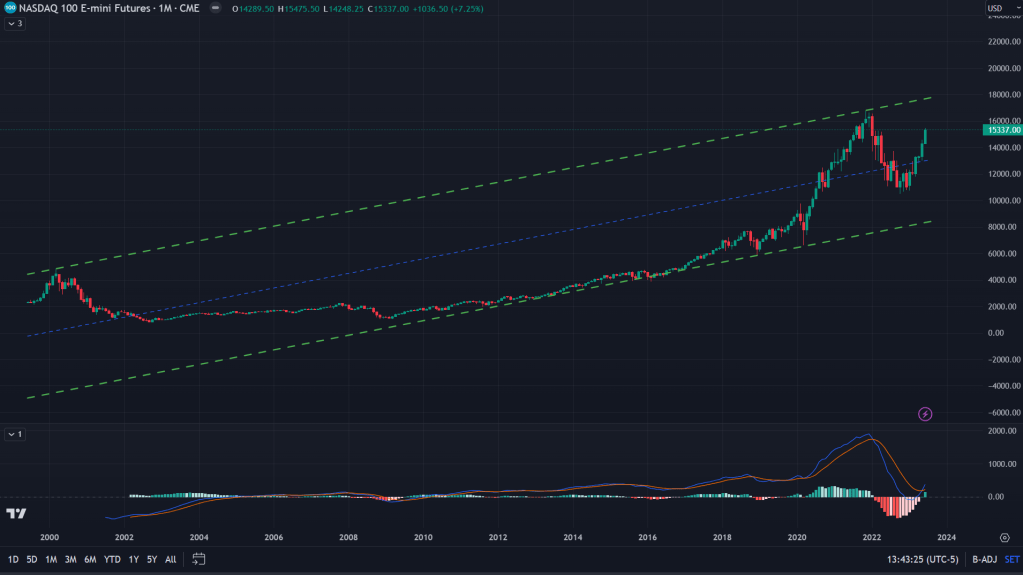
NQ (Monthly): Similarly, even on NQ similar pattern seems to be playing out, new all time highs won’t be a far cry even as MACD would be diverging negatively. I would expect that high on NQ would be the final spot to dump all that you have.
Here’s what I and Mukund discussed on the weekly market outlook:

Leave a comment