While, I did expect the markets to show some dips, what I missed observing last time, was a very obvious double top. Although, I did get into the shorts later in the week, but missing what was obvious, was a humbling experience. Let’s see what the charts are saying:
ES (Daily): Yes, the double top was a very clean signal to exit the longs and initiate new shorts. But I definitely missed it to start with. That doesn’t mean the opportunity did not present itself. The bounce on late Thursday and early Friday was another opportunity to enter the selling bandwagon. Let me explain why?
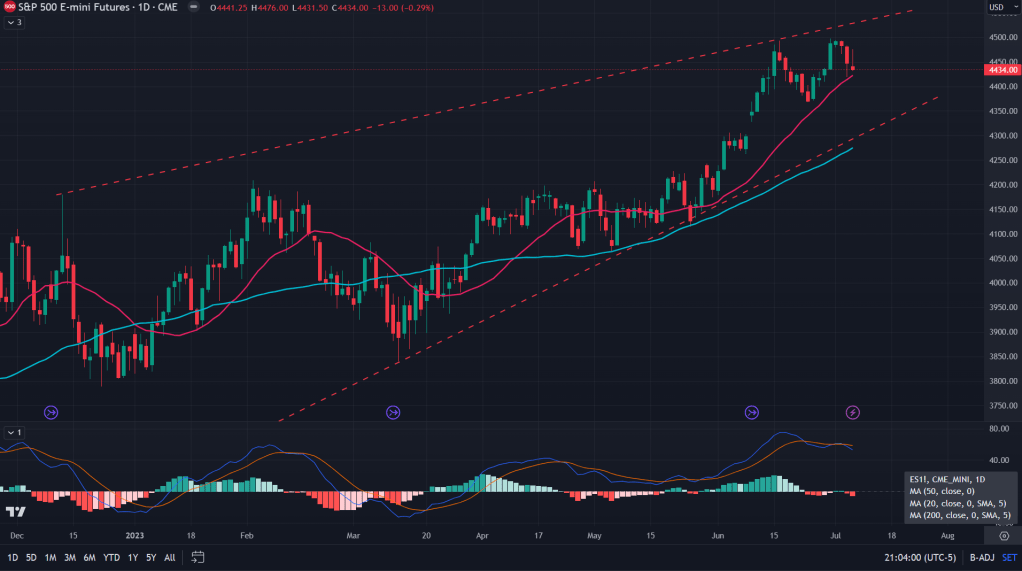
Usually traders/investors would call an inverted hammer as a bullish sign, but I beg to differ. Inverted hammer is a candle which forms after immense selling pressure at the end of the day, which is a sign that bears are grabbing opportunity to sell the rallies in an underlying. So, here in this case I would say inverted hammer is a bearish signal for bears to continue their onslaught.
Another reason why I would continue to hold my bearish bet is the steepness of the 20MA and the gap between 20 and 50 MA. While that alone couldn’t ever be the reason for us to continue holding shorts and the steepness can also be smoothed out by consolidation of the ES. But given the combination of factors mentioned above (double top, inverted hammer at the top and steepness of 20MA and the gap between 20-50 MAs), we should expect this selling to continue towards 50MA, to say the least.
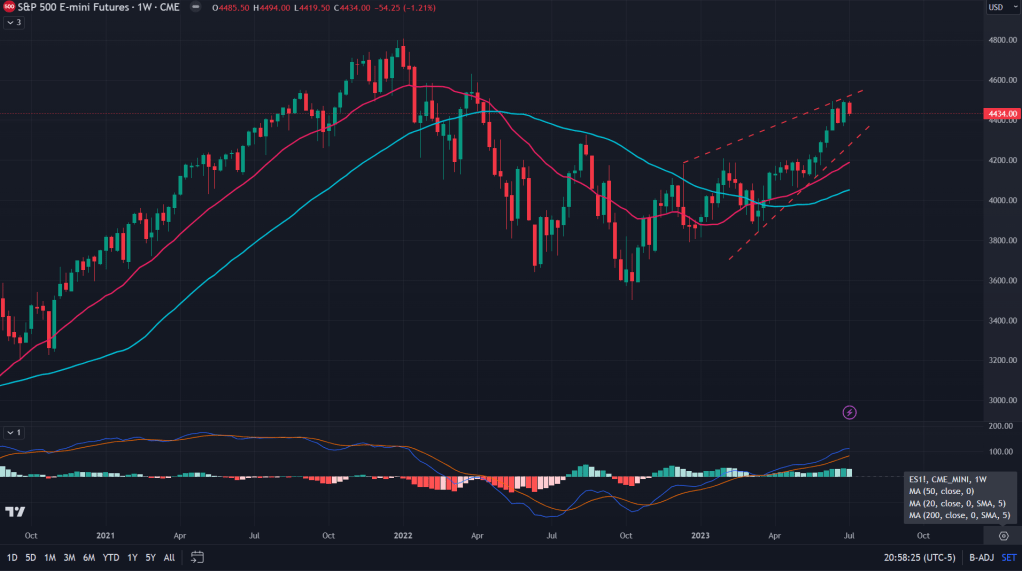
ES (Weekly): That rising wedge (expected) on the weekly, is another signal for the bears that this selling might continue even after the 50 MA on the daily. The daily 50 MA is also sitting just below the lower trendline of the rising wedge. After initial bounce off this key support area, I would expect bears to get going again.
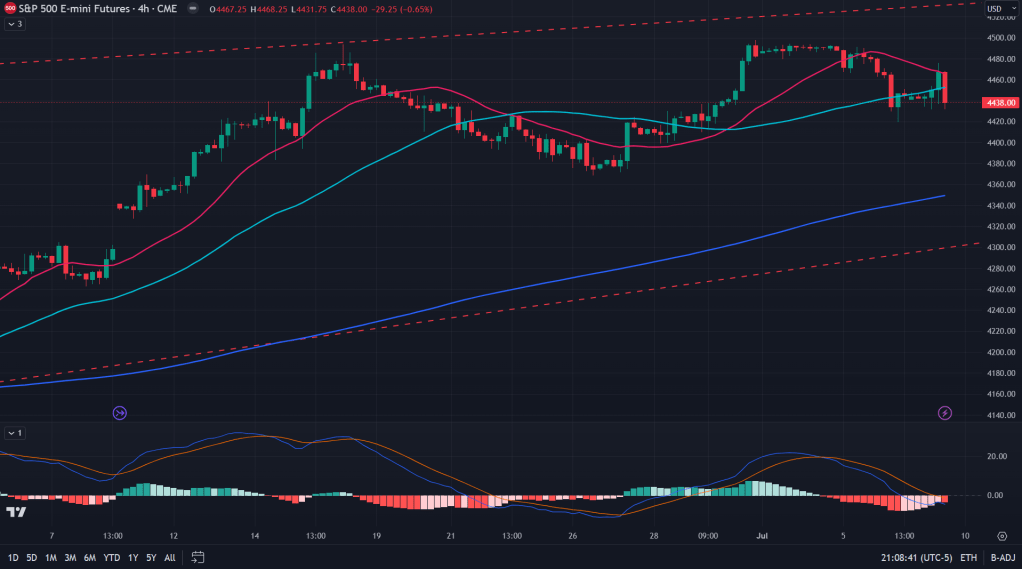
ES (4H): The shorting opportunity which I spoke about, was evident on the ES 4H. If the bulls had any credence to continue the bounce, the rally would have continued past 20 and 50 MA on the 4H chart. The initial bounce off the 50MA couldn’t even cross past the 20MA and the 4H candle was a big red one.
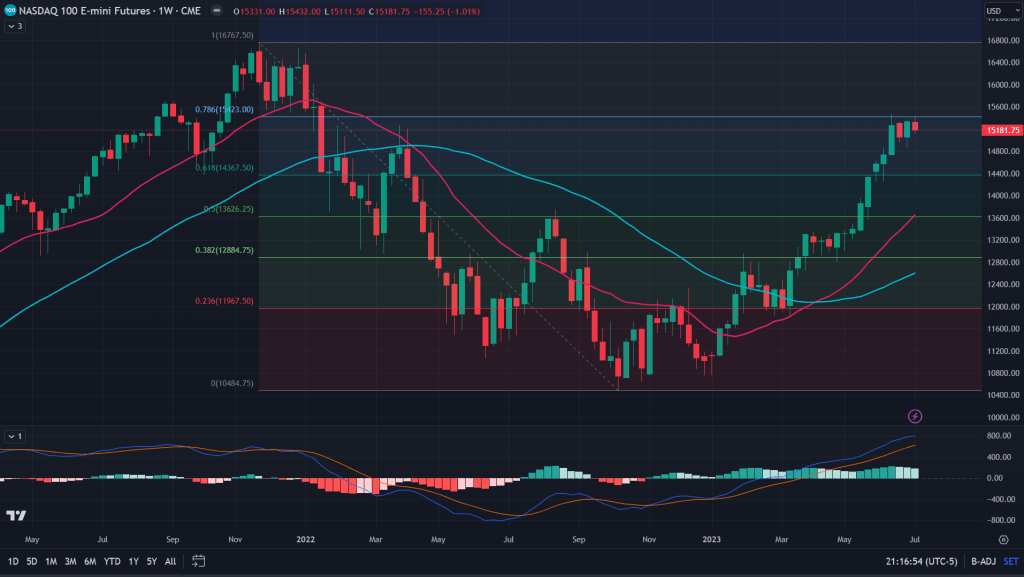
NQ (Daily): This channel that has been forming since the lows of this year, seems to be giving up. Here’s why I say that:
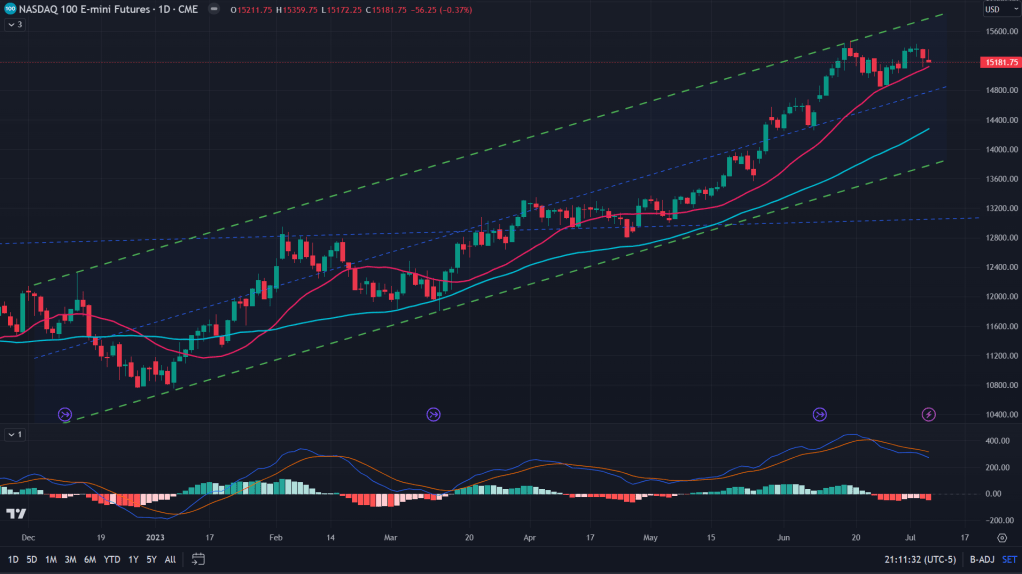
Any pattern, whether channel or a wedge, it shows signs of petering out when it stops forming higher highs and stops touching the upper end of the channel/wedge. Thats the first sign. Another sign is when the stock/future attempts the mean reversion (20 MA) quite often without making another higher high. Third sign, which is yet to occur is the break of 20 MA and mean reverting the 50MA. We are at this third point right now. It surely looks like to be breaking the 20MA on the daily.
NQ (Weekly): And then there’s continuous rejection off the 78.6% fibonacci level of the last year’s fall. If this selling continues further and below the daily 50 MA, then I would call this rally to be over and done with.
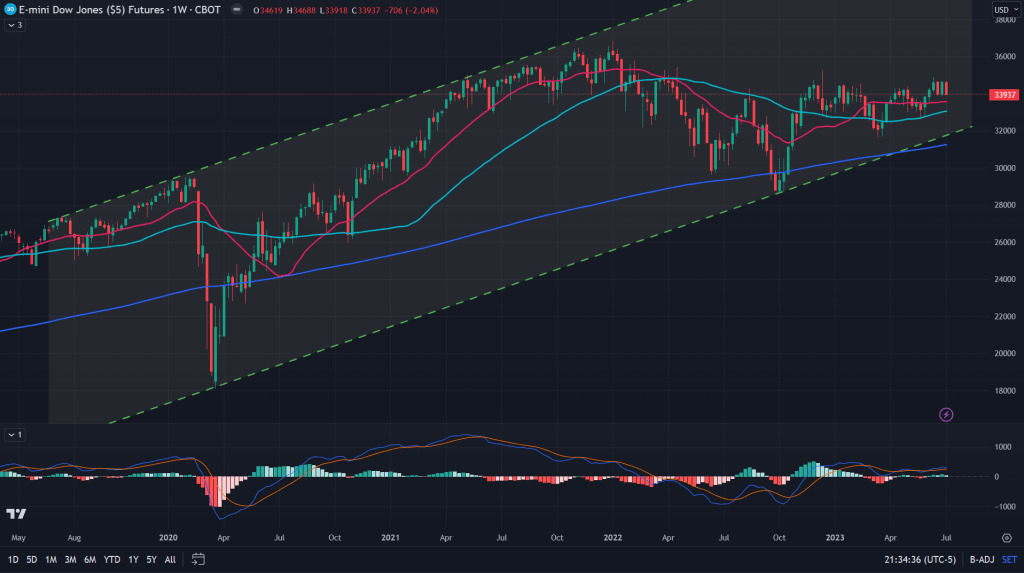
YM (Weekly): A refreshed look of the weekly chart of the Dow Jones futures and what we see is a typical topping out pattern of the channel and every likelihood that it is about to break in the coming weeks.
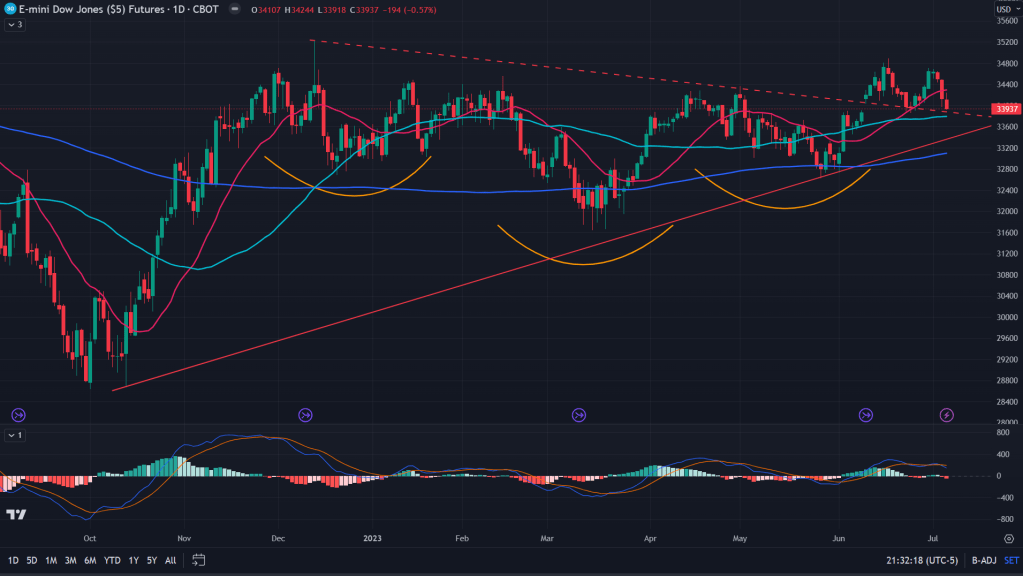
YM (Daily): That inverse H&S did give industrial stocks some thrust to rally, but inability to sustain past the previous high (in fact a double top here as well) and the 20MA breaking is good enough a proof that this rally for now is ending with.
RTY (Weekly): Not enough signs for the small caps to show it is topping out. Logical too. Small caps are usually the last to participate in a bull run and last to start selling off too.
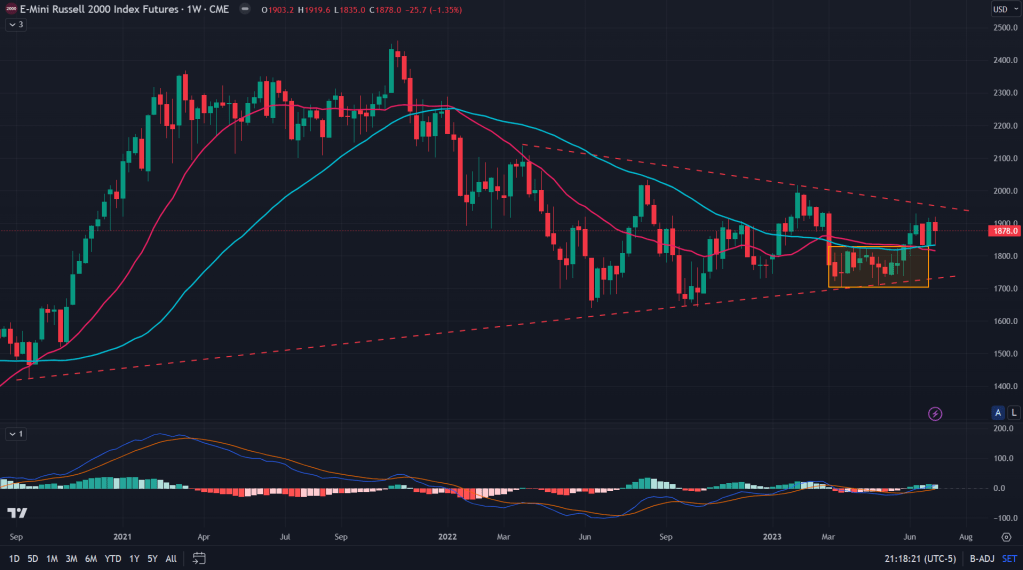
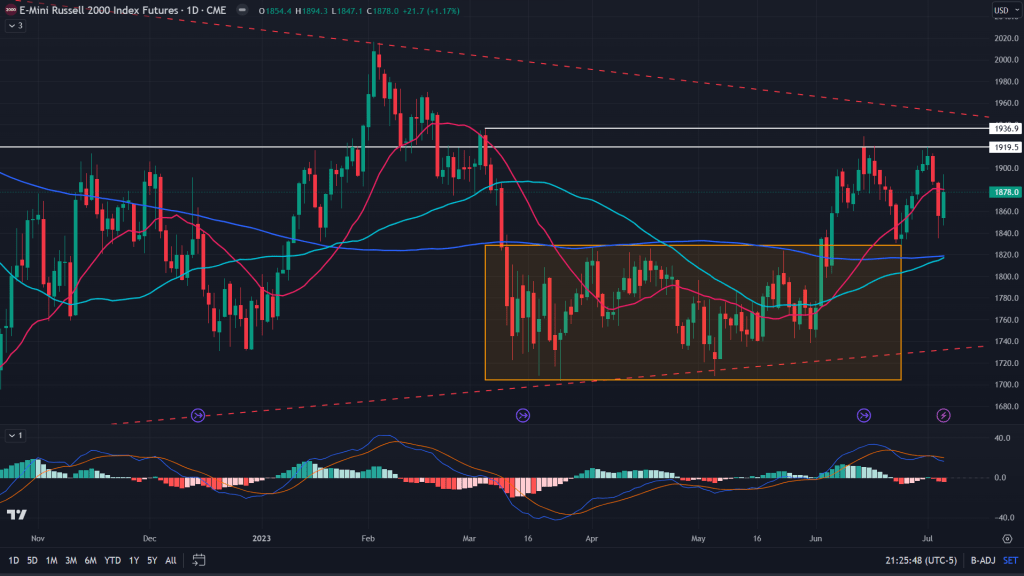
RTY (Daily): On the daily chart though, yet another sign of a double top and yet another key point that I missed was the daily supply zone of 1920-1936. At times relook at all your best gives you a fresh view of the pieces aligning themselves. If that wasn’t enough, inability of the index to sustain itself above the 20MA is another sign of weakness for the bears to try and show their strength.
Conclusion: Given that almost all the index futures have shown their signs of topping out, I would expect this weakness to continue in the coming week. In every likelihood, at least towards 50MA on the ES and NQ to begin with.

Leave a comment