Ever since the market bottomed out (if I can steal that word), there has been a lot of argument in the market about the macro-economic health and why markets can’t rally in this environment. Yet here we are! Macros and markets negatively diverged!
What is it that led to this rally? I won’t dig into macros here, we’ll deal with it in some other post. But what if technicals were to give us some cues? I have spoken about my bullish thesis in the past (here, here and here) and my failure to see last week’s rally has given me an opportunity to relook at that same theory, which seems to be holding true to its game!
ES (Monthly): Why am I talking about this monthly chart again? As I spoke about the theory that what if the crash last year was all about the monthly chart and the rally this year is all about retesting the new highs while momentum and RSI both diverge negatively on the monthly?
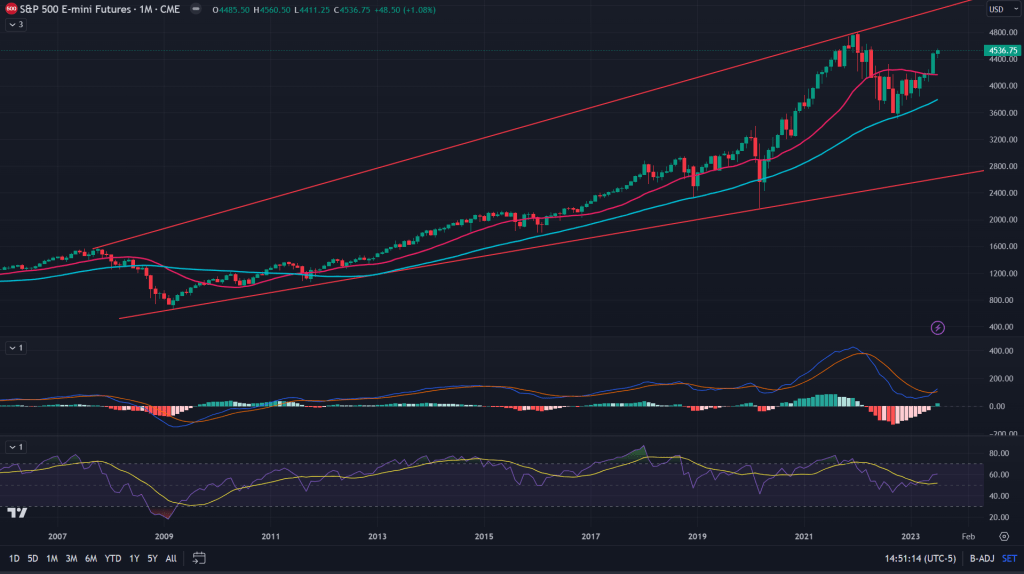
As shown in the megaphone (or expanding triangle) above and the decades long channel below. It does make sense that market tries making a new high in a gradual manner because for both those patterns to complete and then to break down (if any), market need to trade in a pattern that shows topping out of either of those two. As I spoke in last week’s post (read here), for any technical pattern to complete its formation, it involves certain characteristics that needs completion and if these two monthly patterns are to be completed, all it needs is at least revisit of the all time highs.
Having said that, we are traders and we need to dig a well each day and drink it too. So, lets take a look a little bit more closely and see what the next few days and week holds for us.
ES (15 mins): Why am I starting with 15 minutes chart this time? Because of what it is showing: Negative MACD and RSI divergences even as ES is making new higher high each time.
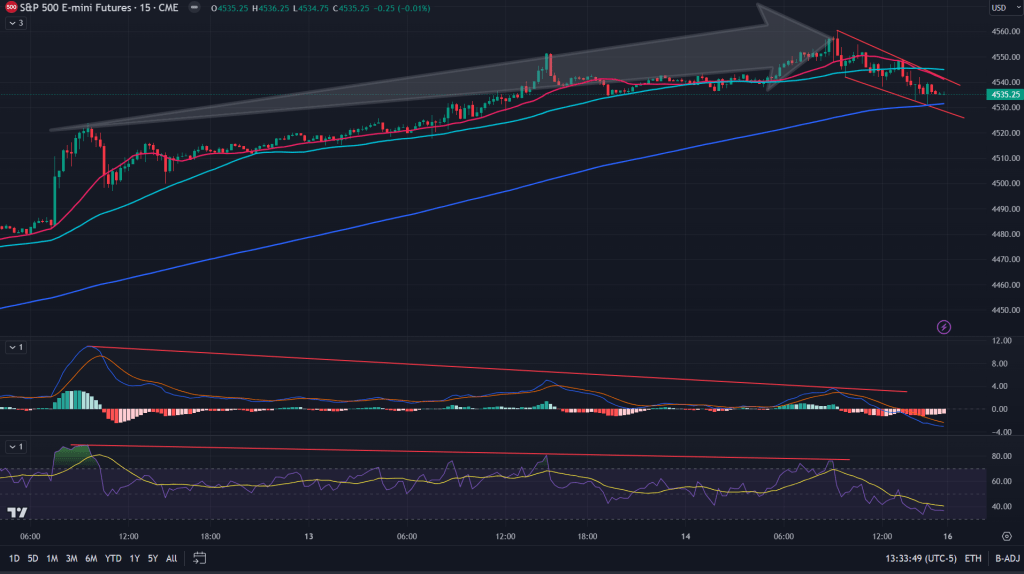
While those divergences are there, the sell-off on Friday was very normal and it formed a bull flag on 15 minute charts.
ES (Daily): But, if that divergence was only on 15 minute, I would have still carried some longs into the weekend. The daily chart too has been diverging negatively as MACD and RSI both have diverged negatively from the price. What’s more ES closed with a gravestone doji candle. That’s certainly not bullish in the short term. Gravestone doji is a powerful tool only if it occurs near a key resistance.
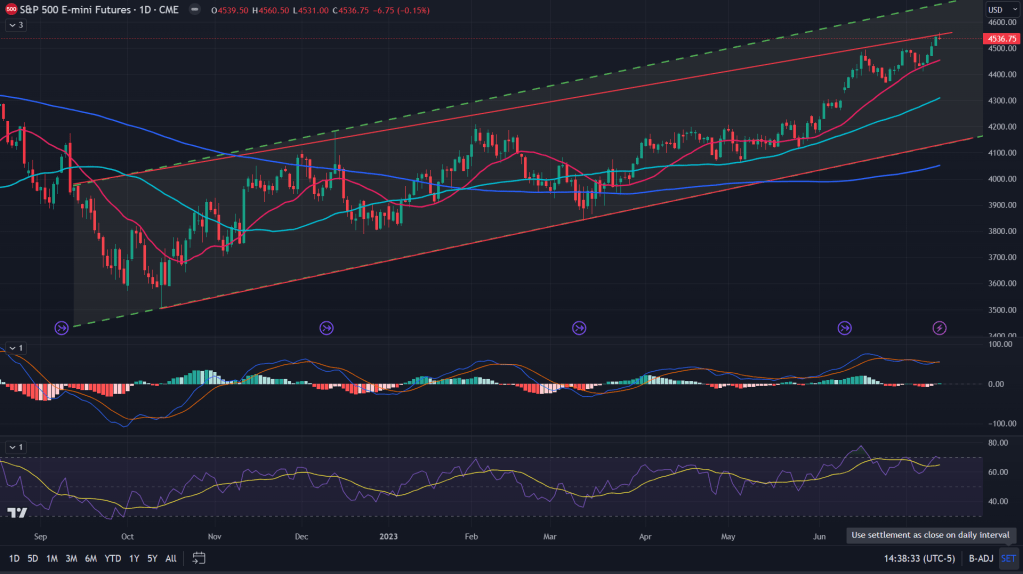
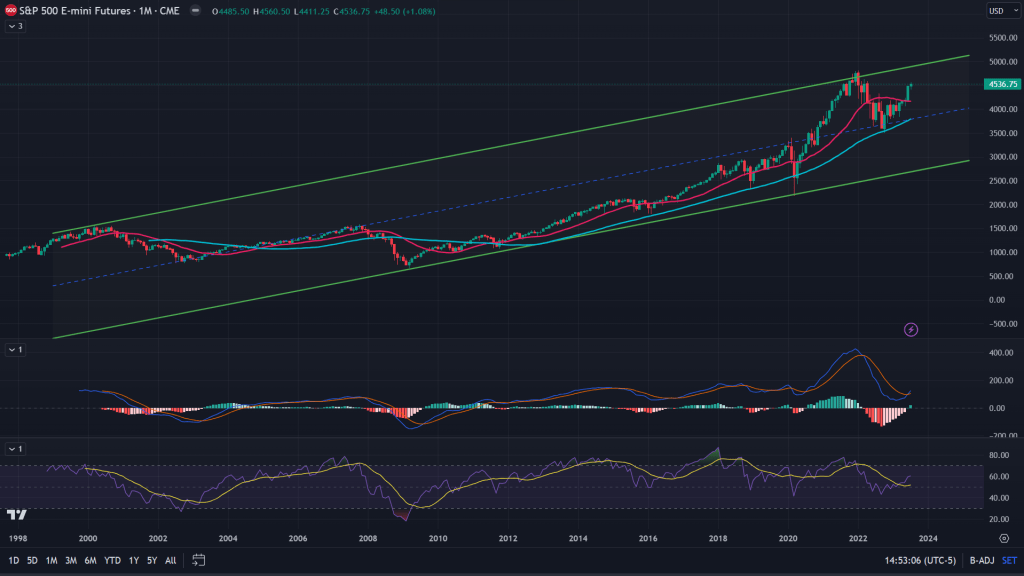
There is a reason why I have been posting that green channel with dashed lines all this along, while I have posted the rising wedge with solid red line. Because the for the channel to completely show itself, it needs more such highs that can touch upper end of the channel, while in case of the rising wedge in the chart above, the pattern holds itself true and hence it makes all the more sense to now rely on rising wedge formation to show us its colours in the coming weeks. Starting next week for sure, when it seems more of a bearish week at the start.
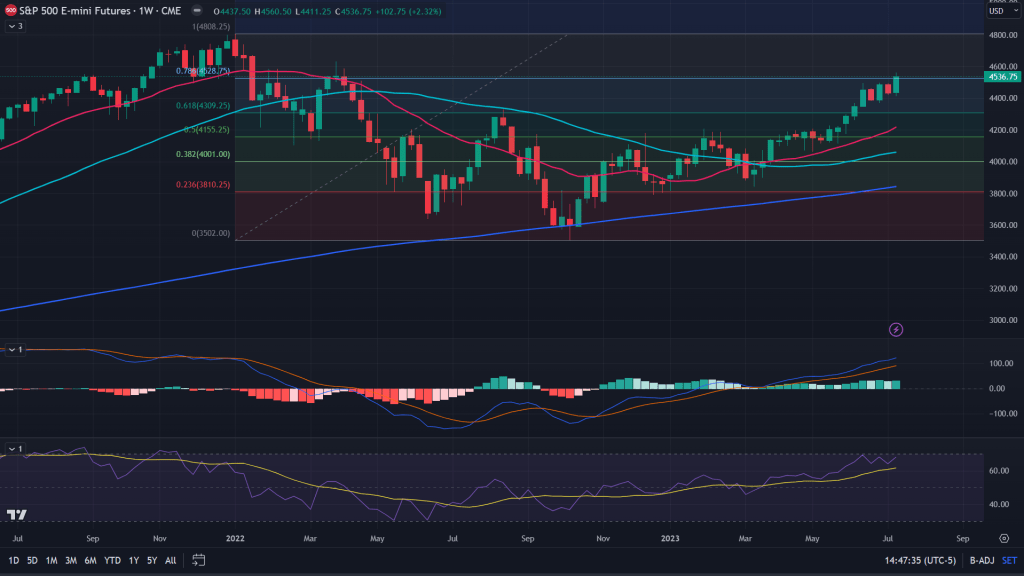
ES (Weekly): Yes, it still IS trading under that 78.6% fibonacci level.
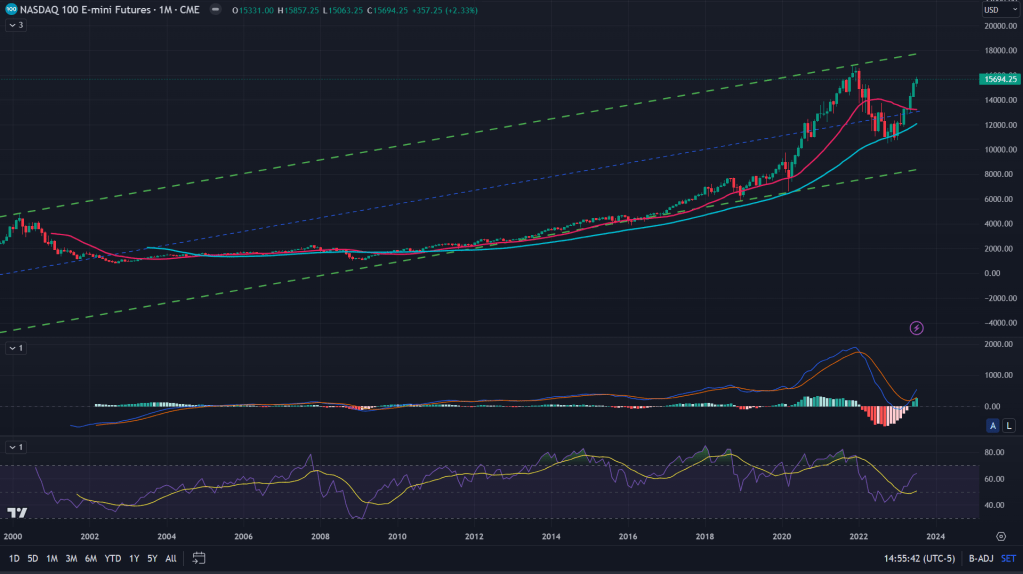
NQ (Monthly): What holds true for the ES, certainly holds true for the NQ as well on the monthly charts. New all time highs aren’t too far and yet MACD and RSI have not moved any closer to their previous highs. Final nail in the coffin of this bull rally probably coming in around the all time highs.
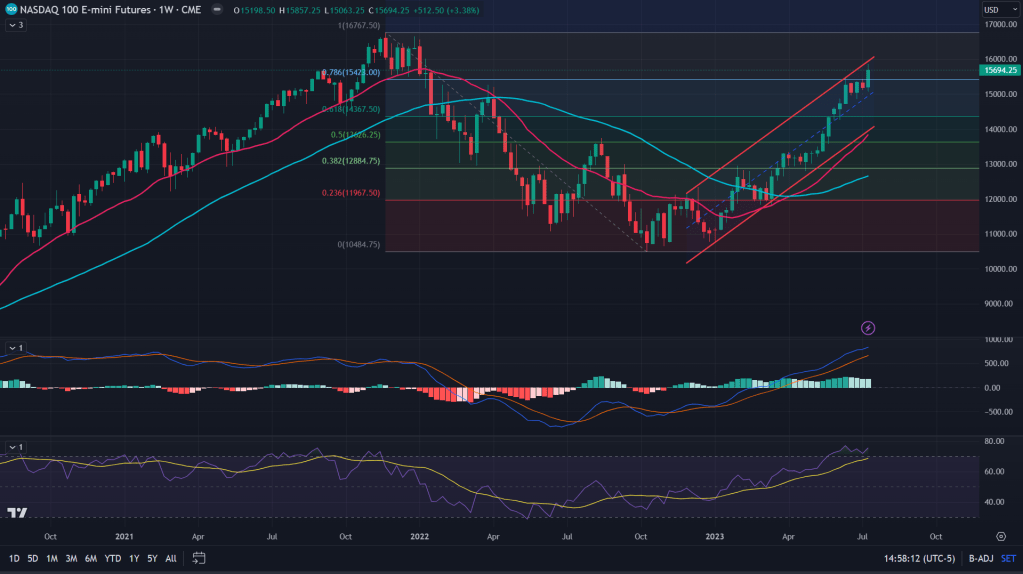
NQ (Weekly): Weekly chart, while comfortably above 78.6% fibonacci levels, it is still lurking under that upper end of the channel while RSI as high as was seen during 2021 mania.
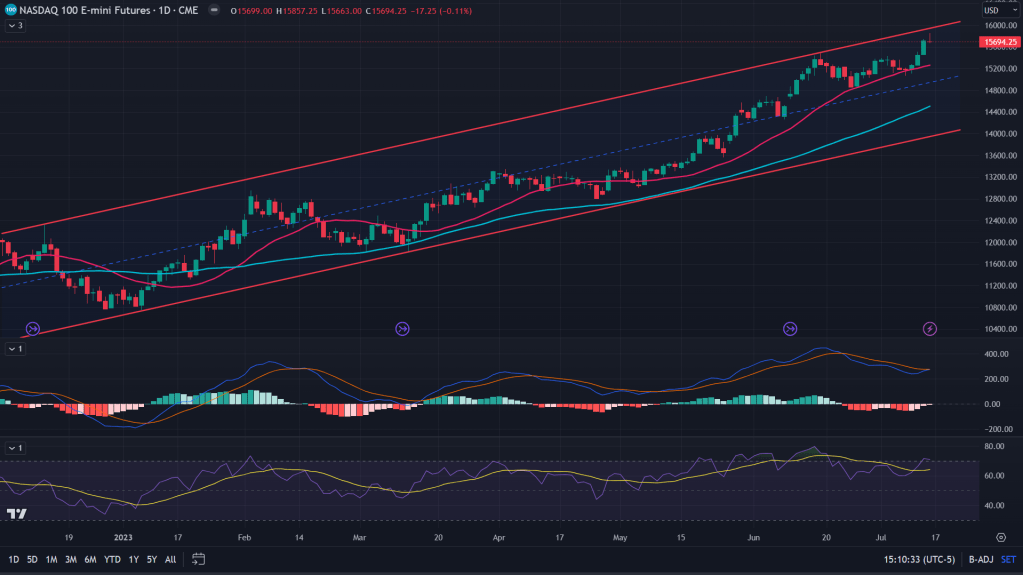
NQ (Daily): Couple that with the negative divergence of MACD and RSI on the daily and the gravestone doji at the resistance. Ouch! That’s bearish in the short term.
YM (Monthly): If ES and NQ formed those megaphones and decades long channel, can Dow Jones be any different? And yes, not too far from the all time highs either.
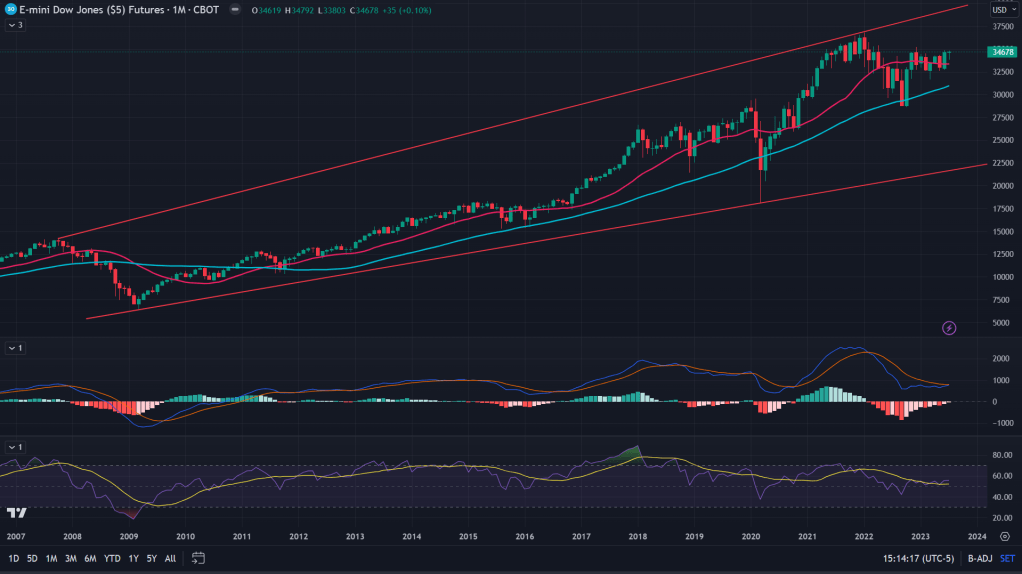
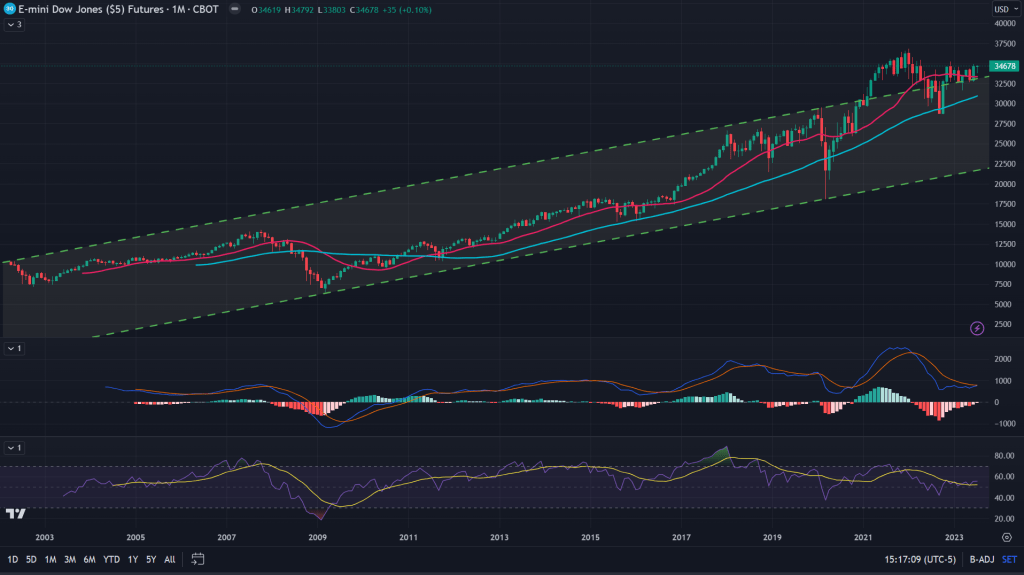
Although the channel was backtested already on the monthly chart when it broke out during 2020-2021 rally. Although after the backtest, bulls haven’t been able to capitalize much.
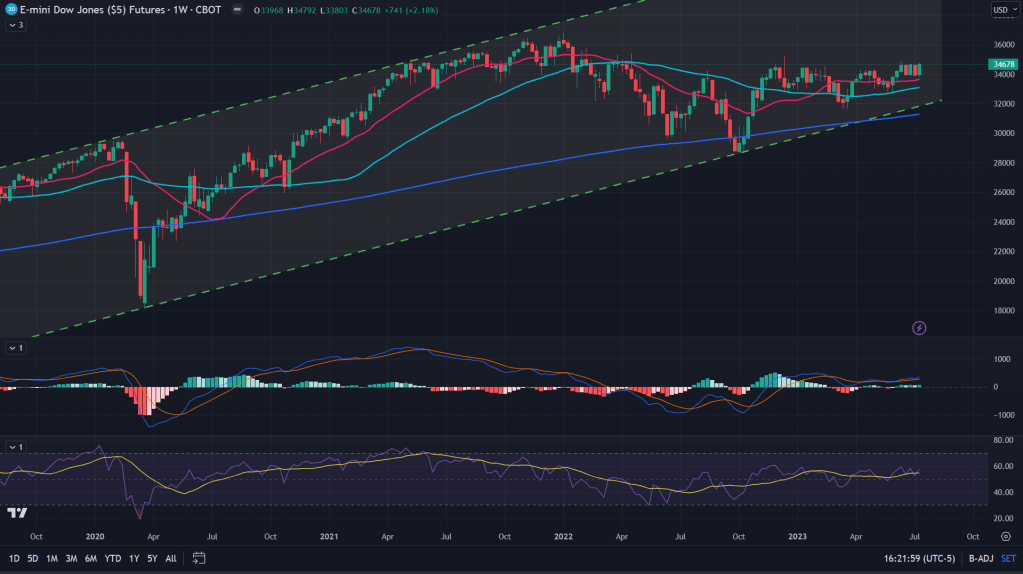
YM (Weekly): Although, whats concerning for the industrial stocks’ bulls is the fact that YM has been just dwindling around those weekly 20 and 50 MAs, not doing much to capitalize on it.
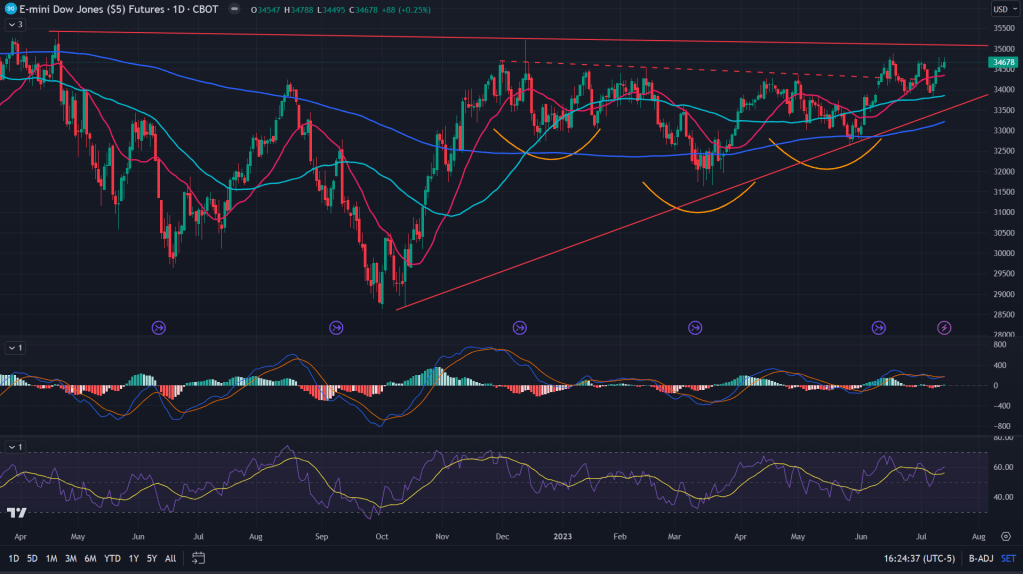
YM (Daily): The only positive? Not only have bulls been able to hold themselves up after that inverse Head and Shoulders breakout, there is a positive momentum to break past that ascending triangle. Although, yes RSI and MACD are diverging negatively. Not healthy!
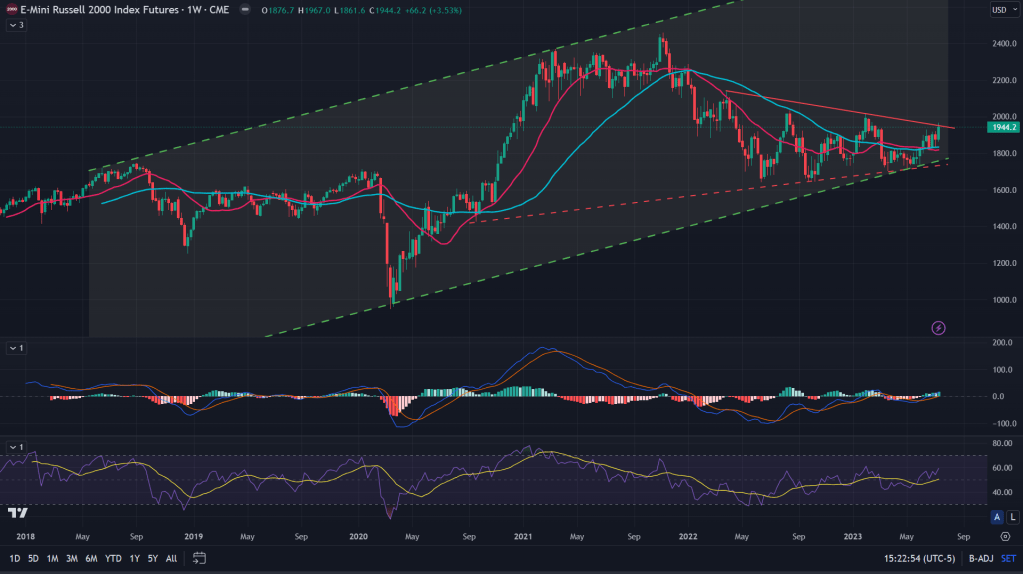
RTY (Weekly): While RTY doesn’t have enough data to talk about monthly charts, weekly does give us some hopes to be bullish on. Continues to build from strength to strength and that breakout? Yes, it’s finally around the corner.
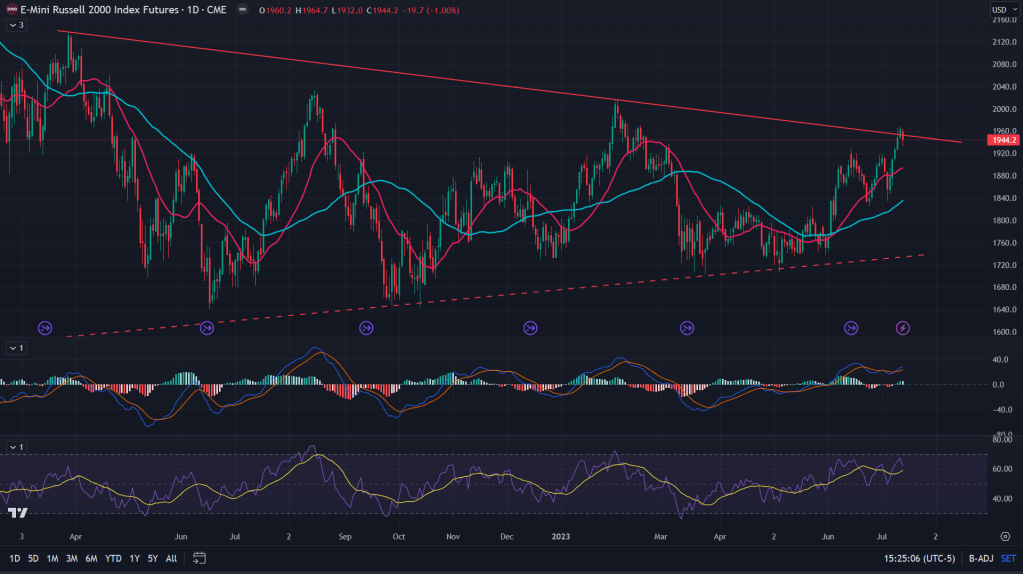
RTY (Daily): While, Friday bulls couldn’t really hold their nerves to close that daily candle above the B-line, I would say the next mean reversion would result into this breakout.
Conclusion: Medium term (more than a month, less than 6 months, that is), holds bullish for the stocks. But immediate term looks shaky for ES, NQ both as they negatively diverge in terms of momentum and strength of the price action. Any dip on the ES and NQ towards 20 and 50 daily MAs should be used as a buying opportunity while RTY and YM does look bullish in the immediate term.
Finally, here’s that weekly market round up video with Fundamentell’s Mukund Mohan:

Leave a comment