There are quite a few things that I look out for to decipher if the bull or bear market is still alive, such as to see how broader market is performing, if the pullback from the existing trend is healthy or if it is turning volatile? At the lows last year we saw how the daily candles were bigger when we were rallying up and as we moved further up, volatility started dying down.
Similarly if and when we top out of this ‘bull market’, we need to find those anomalies to avoid ourselves from getting trapped. I had pointed out some of those key anomalies few days ago on twitter, if one would like to read them: What are the signs bull market is nearing its end? Now, lets take a look at what the market is telling us for the coming week:
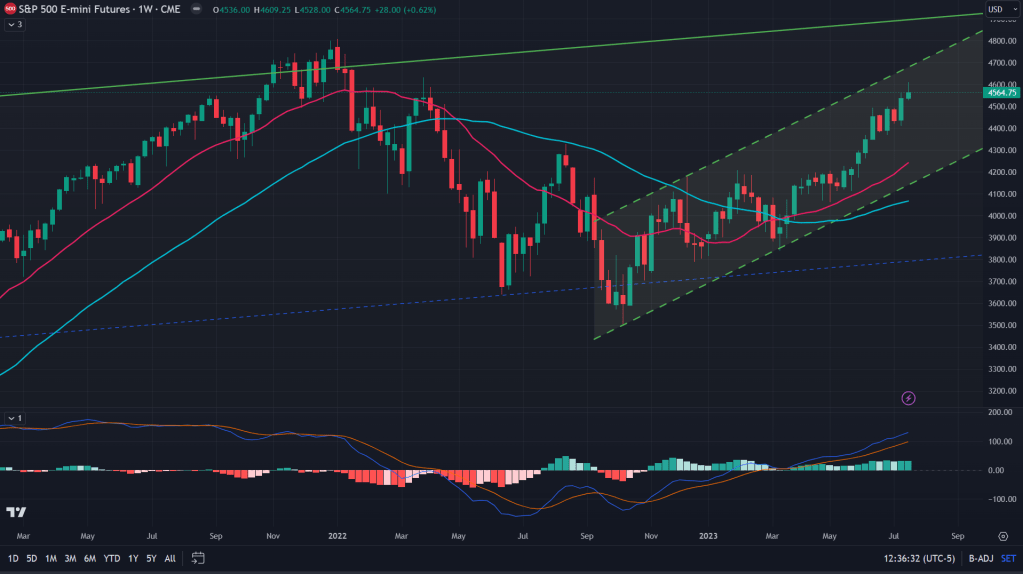
ES (Weekly): Apart from that inverted hammer like candle on the weekly, there’s nothing much to worry about from the weekly perspective and I would call the pullback as normal in the broader trend, which is still up.
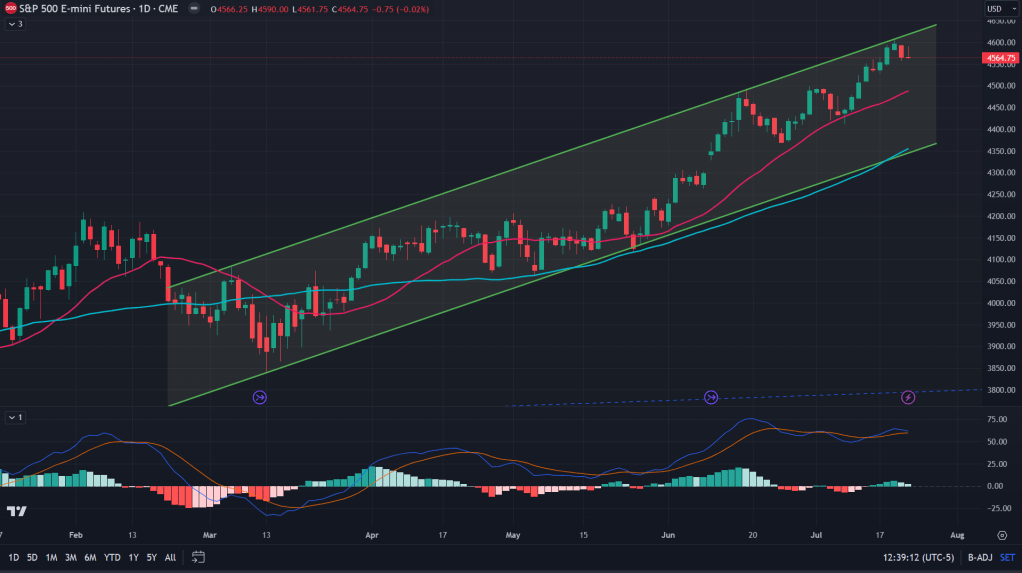
ES (Daily): From the daily time frame perspective, this time the dip could get a little deeper than pervious dips with Friday’s candle being a bearish gravestone doji (again, yes!). Apart from that, two more things that makes me carry my shorts: 1) The gap between the 20 and 50 MAs being wider and 2) Daily negative MACD and RSI divergences which has been going on for each new highs on the ES.
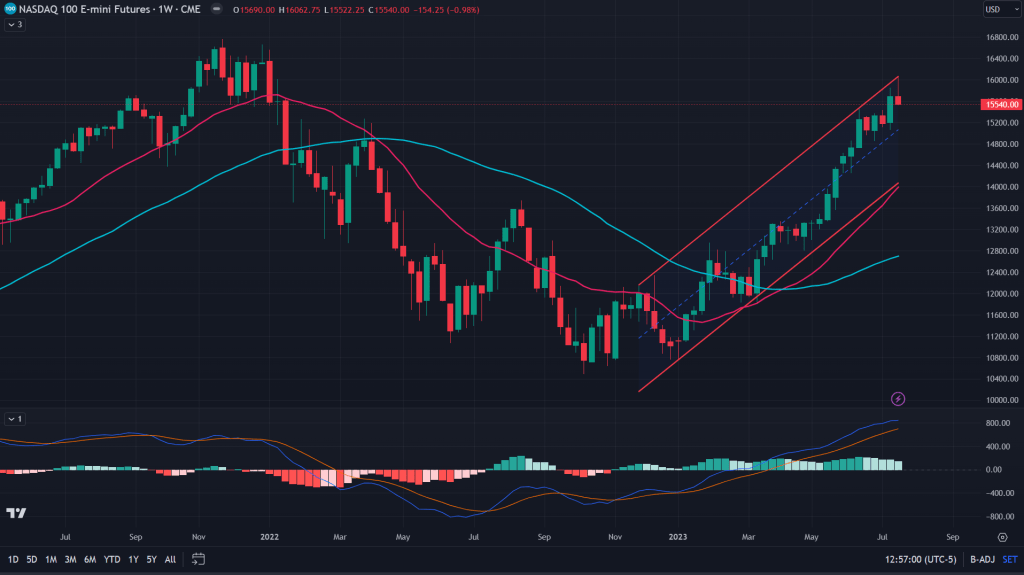
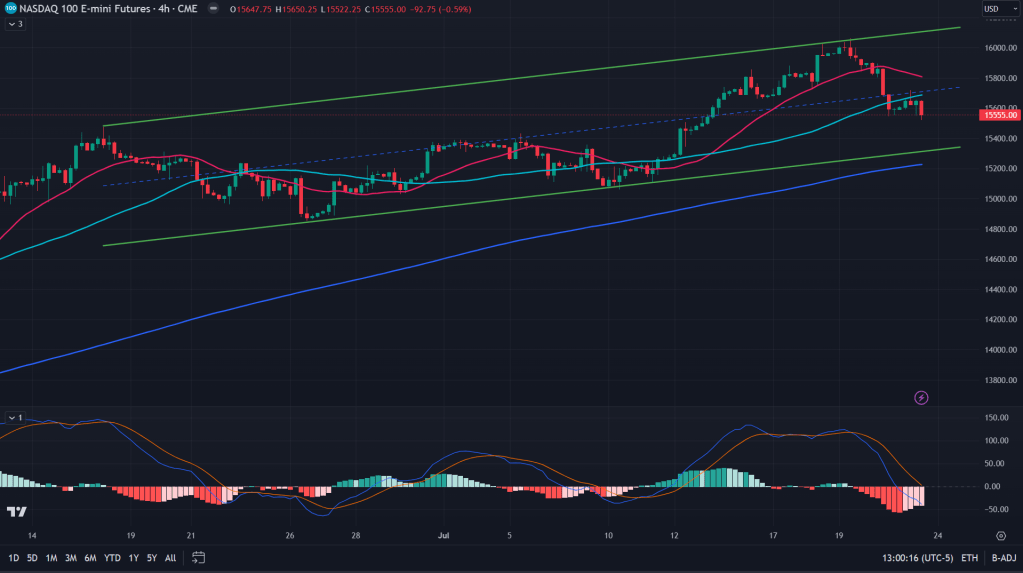
NQ (Weekly): While ES looks healthy on the weekly perspective, we can’t say so for the NQ. Rejection from upper end of that channel along with weekly inverted hammer close is not healthy for the bulls.
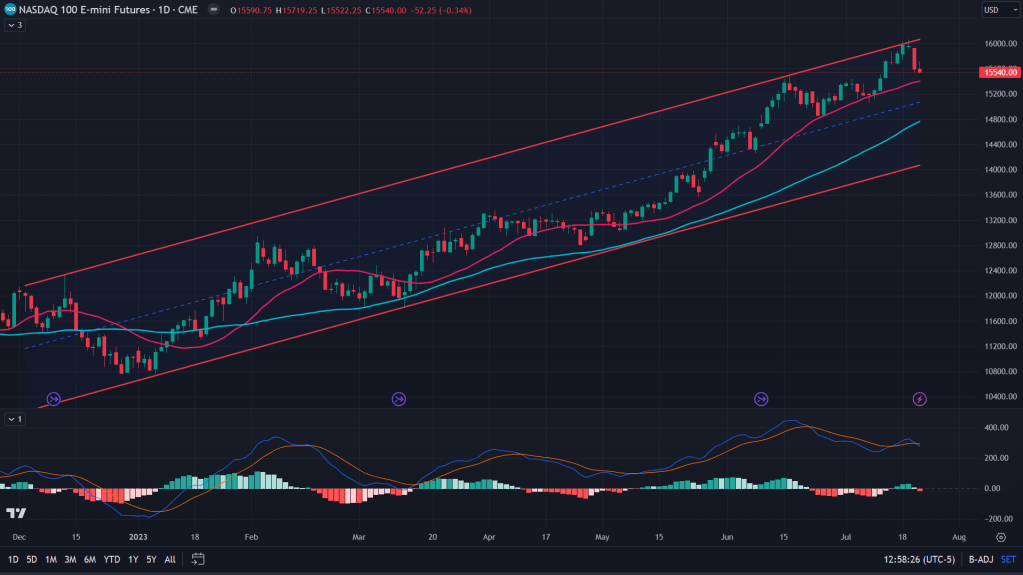
NQ (Daily): That bearish gravestone doji close at the top end of the channel, followed by big read candle next day and then an inverted hammer the next, coupled with negative RSI and MACD divergences on the daily – all a recipe of troubles ahead for the tech bulls. It certainly won’t be a straight line down, but I would assume we are headed for a journey towards 50 MA on the daily in NQ. For now, lets keep our eyes on the 20 DMA which is about 140 points away from Friday’s close.
NQ (4H): While 20 days MA on the NQ is around 15,400, the lower end of this channel on 4H is deeper below around 15300 and I would guess that should be first legitimate pause before any bounce comes into play.
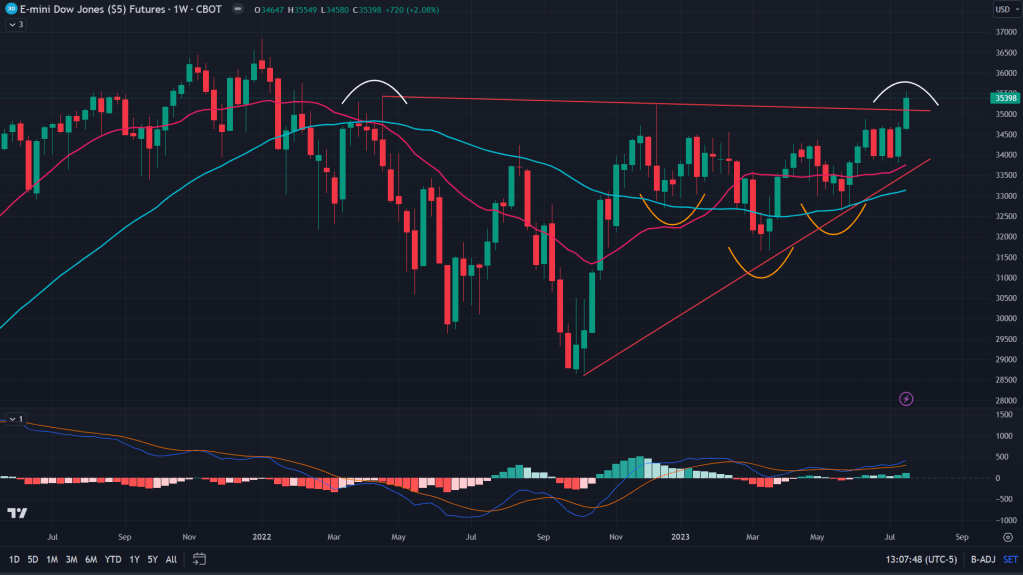
YM (Weekly): Interesting play for the industrial stocks’ barometer. While it has broken out of that ascending triangle, along with carrying its inverted H&S breakout further, there is one small concern for the bulls – double top appearing right at the breakout. How to trade it then? Let’s see what we get when we zoom in.
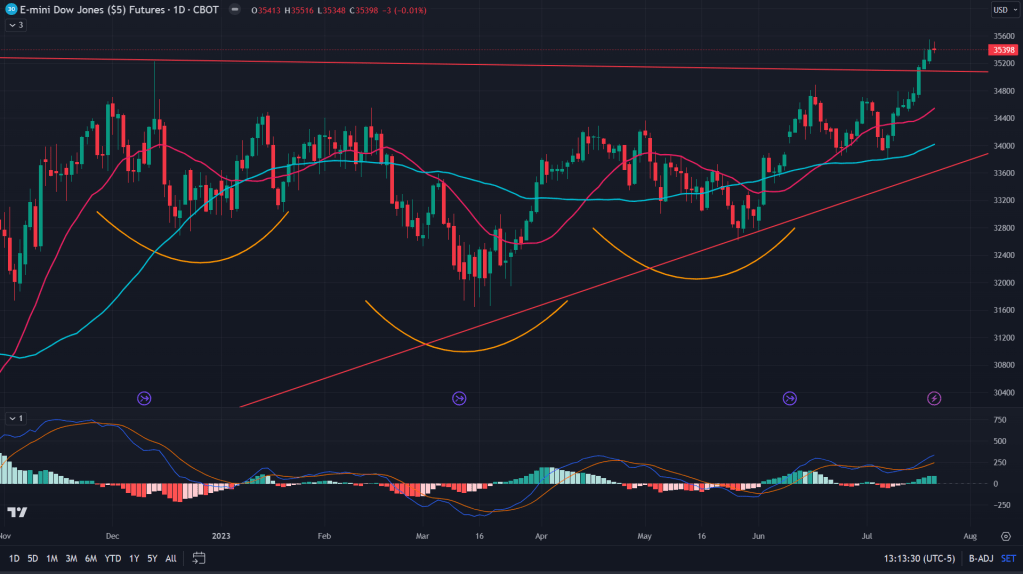
YM (Daily): While weekly charts gave us some confusion, daily didn’t spare us either – Friday’s close was a doji candle – which is a sign of indecisiveness. If all the other indexes were not negative, I would have wagered a long position here. But given the bearish outlook on NQ and ES, I would wait for that pullback into the breakout point, which is around 35,000 levels.
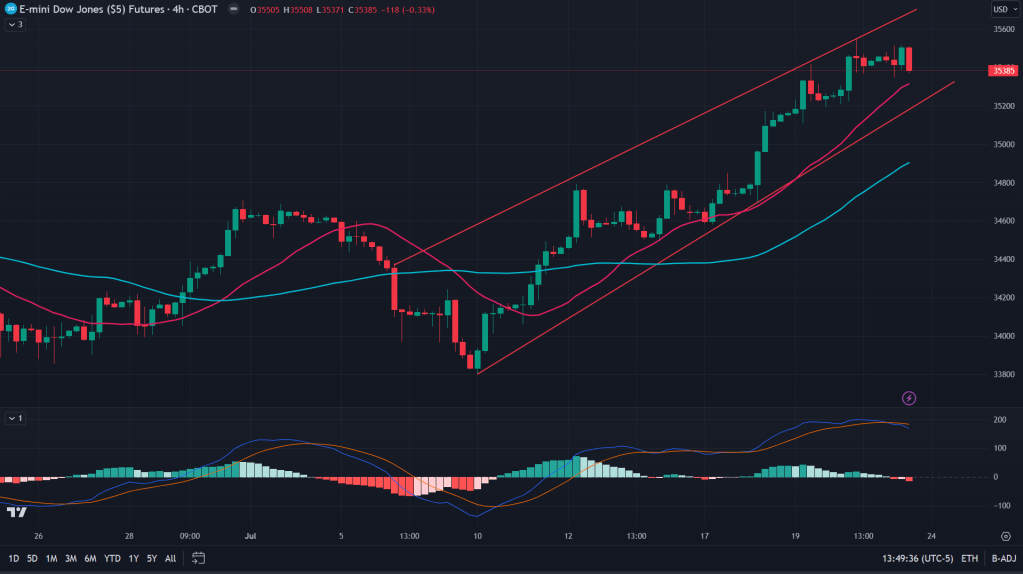
YM (4H): The only clarity in the Dow Jones Industrial Average? 4H charts showing rising wedge and I would assume its headed towards the lower end of the wedge. That should be the place to wager a long, with stop placed around 50 MA of the 4H candles.
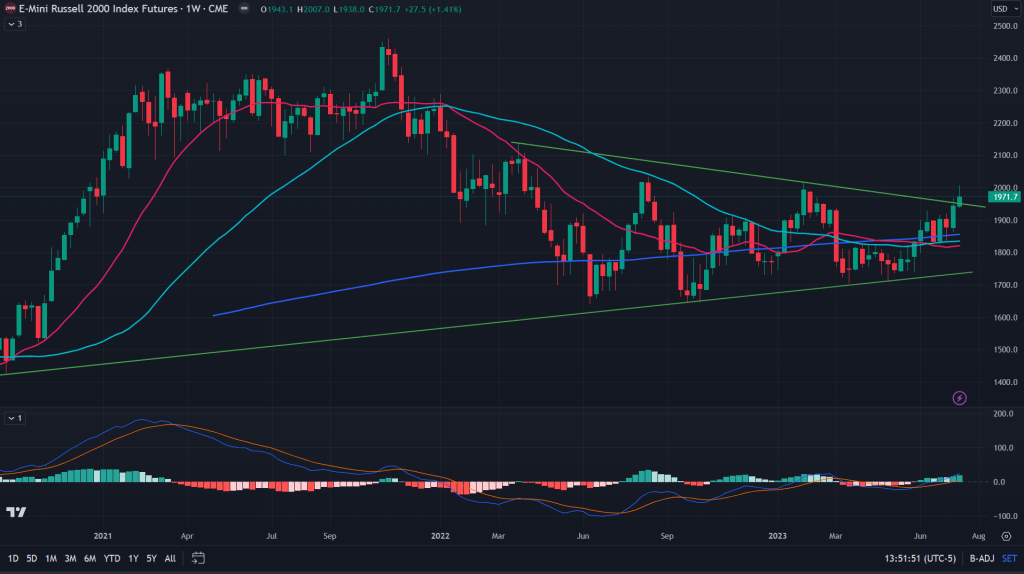
RTY (Weekly): Yes, it broke out finally for good. Although towards the end of last week, bulls gave up some ground, but on the weekly horizon, it still looks healthy and nothing much to worry about.
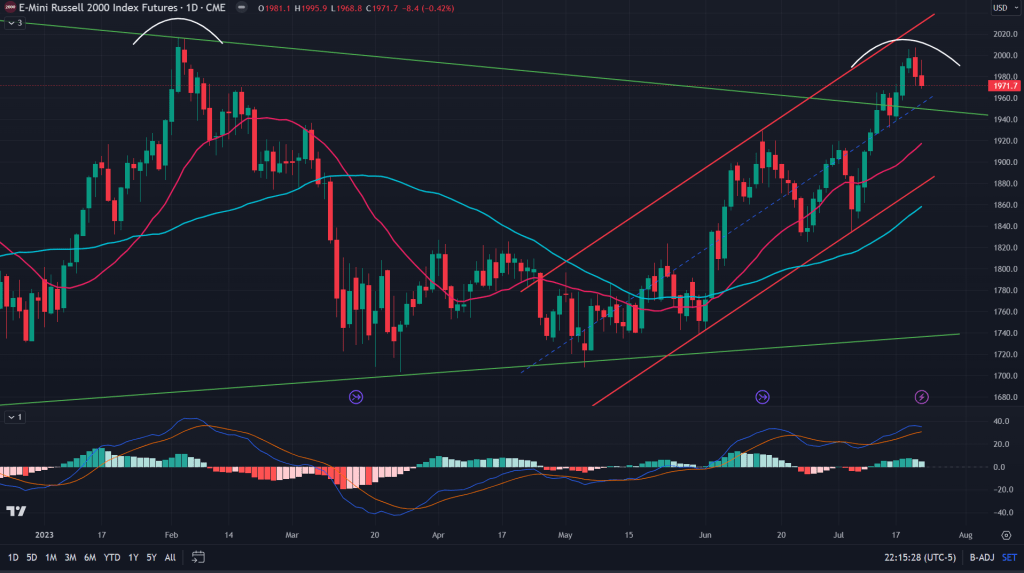
RTY (Daily): But the daily chart isn’t healthy as the daily candle on Thursday was a bearish engulfing one and what we got next was a bearish inverted hammer. If that wasn’t enough, it came right at the double top. Journey towards 20MA is coming, around 1925/30 that is.
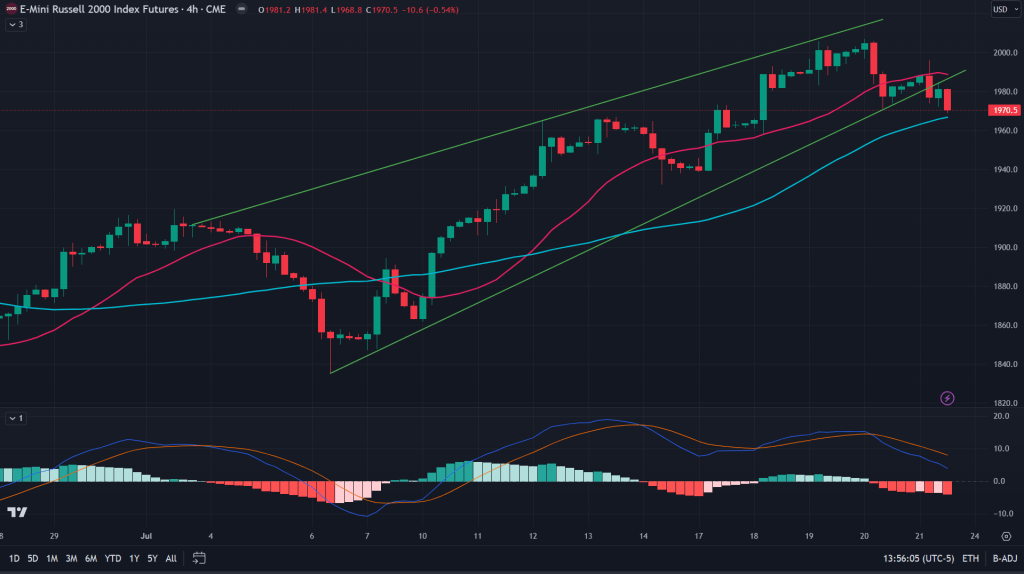
RTY (4H): If those were not enough for the bears, this rising wedge breakdown on 4H charts is enough for bears to carry their shorts further, apart from 50MA on the 4H and a probability of the backtest of this breakdown, bears do not have much to worry about and any small bounce would be a shorting opportunity towards daily 20 MA.
Conclusion: From the long term perspective, ES still looks healthy, but in the immediate term, it has those cracks that tells us this downtick has some more legs. NQ has cracks wider and deeper as the weekly chart isn’t as healthy as that of the ES. YM and RTY though are in far better shape and apart from the immediate term weakness, which is perhaps percolating from NQ that has been leading from the front in recent weeks, any dips would be buying opportunities for the small cap and industrial stocks’ bulls.
Here’s the YouTube link for the weekly outlook with Mukund:

Leave a comment