What we saw last week wasn’t unexpected and something that was coming because it was long overdue and technically all the signs were there for us to be prepared for the sell-off that happened. As I have been saying in the past, if we trade the price action, we won’t have to worry about the news that affects the markets. Fitch downgrade was just the trigger, the price action of the last few weeks was tepid enough for us to have prepared ourselves for what was coming.
With that in mind, let’s take a look at what happened and where we stand now?
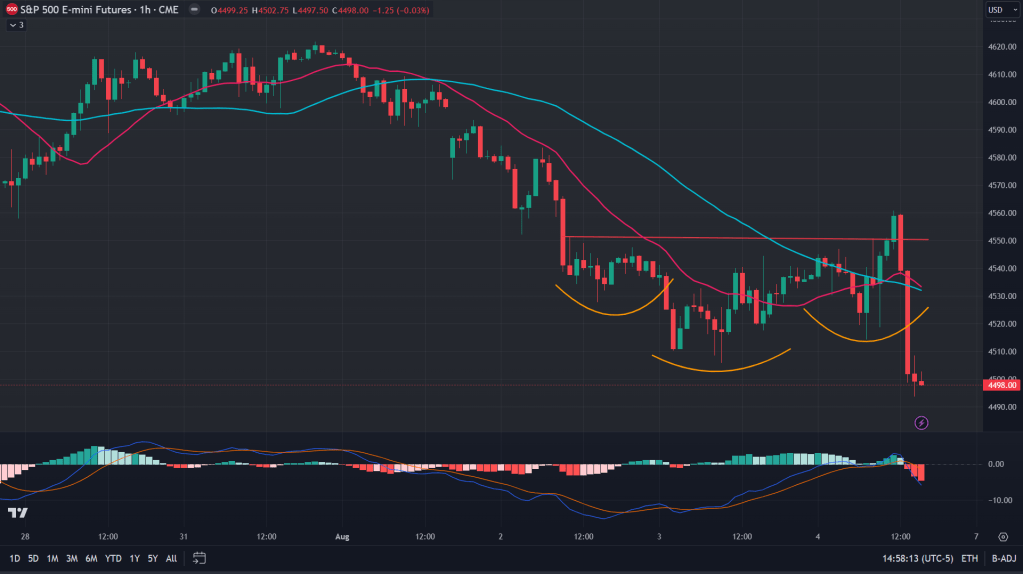
ES (1H): On Friday there was this bullish inverse H&S formation playing out on the hourly chart, which did break out, only to reverse all of it and more in the next couple of hours – a typical failed breakout.
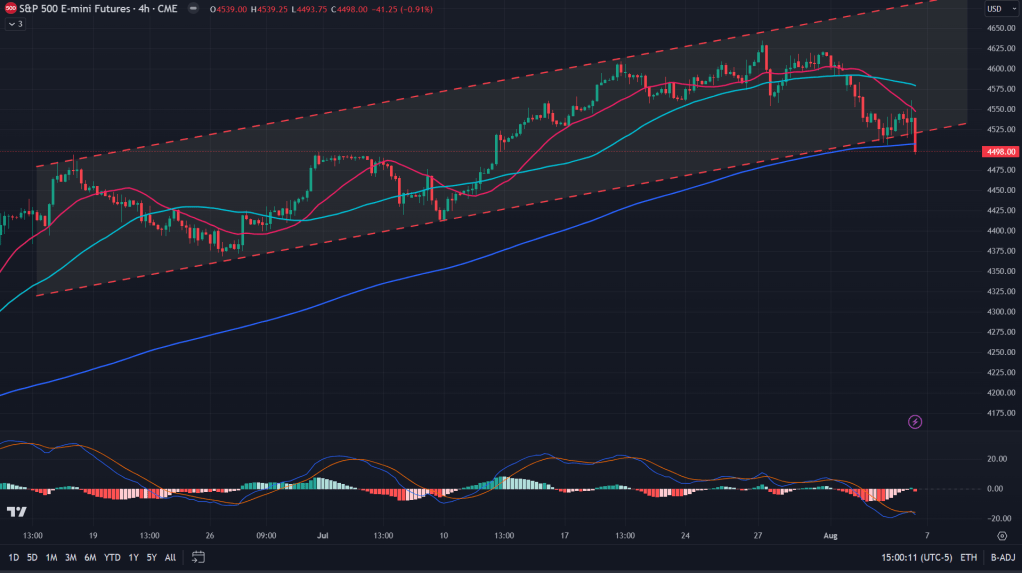
ES (4H): Why did that happen? Because in technical analysis the higher we go on the time frame, the accurate result it would deliver. 4H chart tells us, the mean reversion and continuation of the bearish trend and the breakdown of the big channel which was forming for last one odd moth.
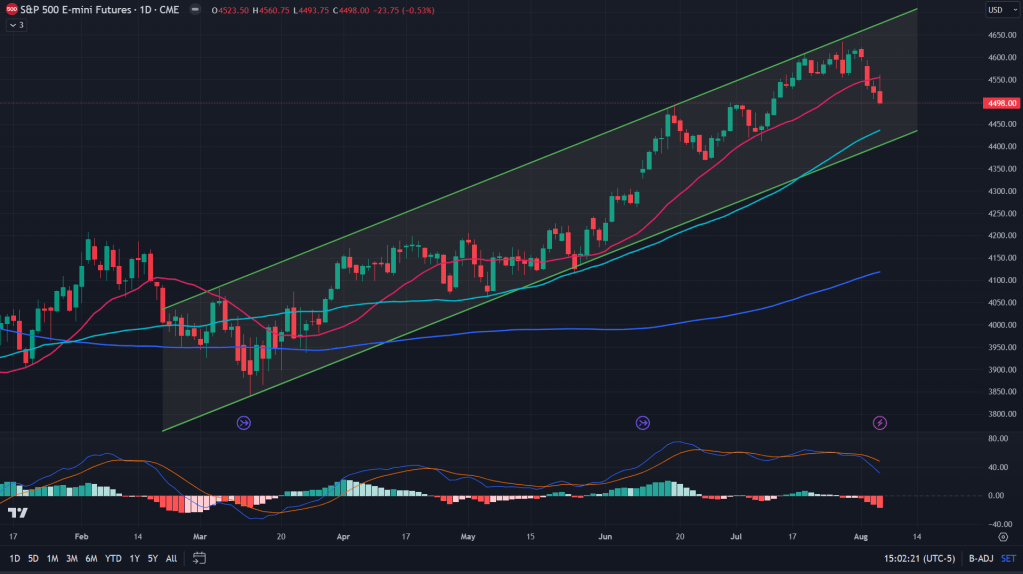
ES (Daily): Zoom out further and you get more clarity – 20MA had given up and the day’s high on Friday too was exactly at the 20MA and boom the sell-off ensued.
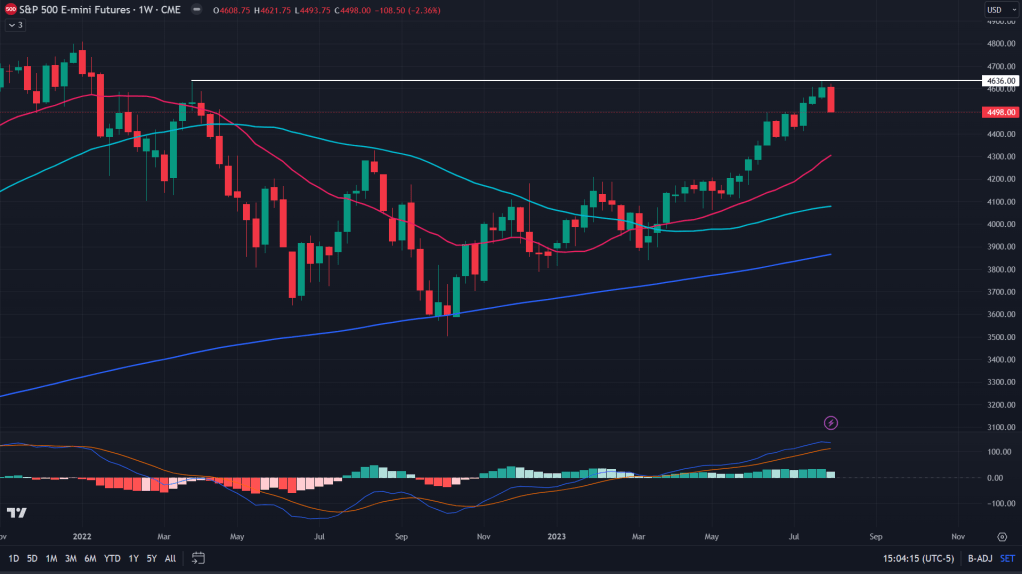
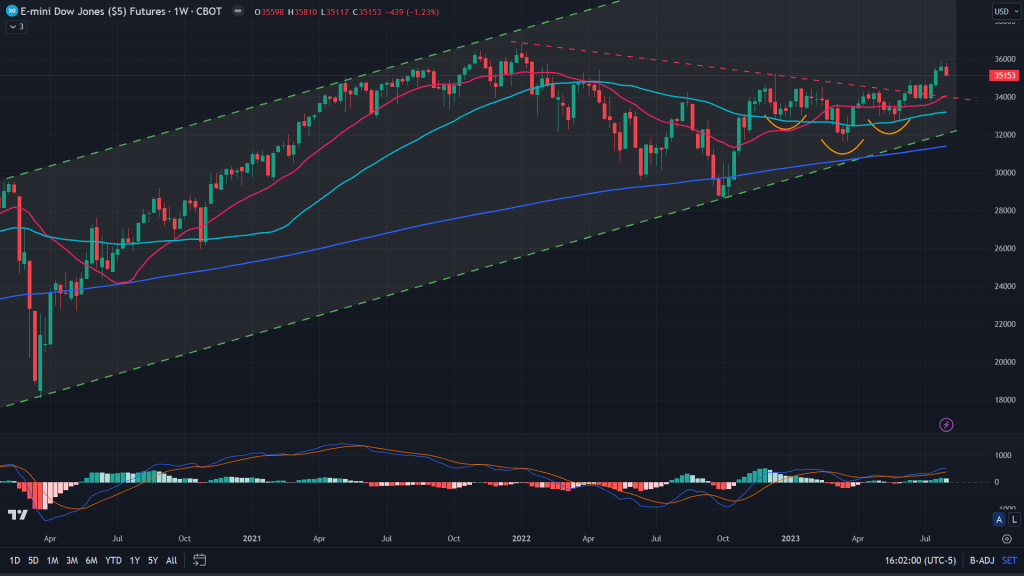
ES (Weekly): Zoom out a bit more on the weekly and whoops, we have a double top! If that wasn’t enough, that big red candle tells us the entire story and what next to expect.
NQ (4H): NQ has quite a few things going here. One, it backtested the breakdown of the last one month’s channel that it broke down of during the week, along with breaking down of the 200 MA of the 4H chart. While it did that, there’s another channel which is forming, which seems to be a bull flag so far.
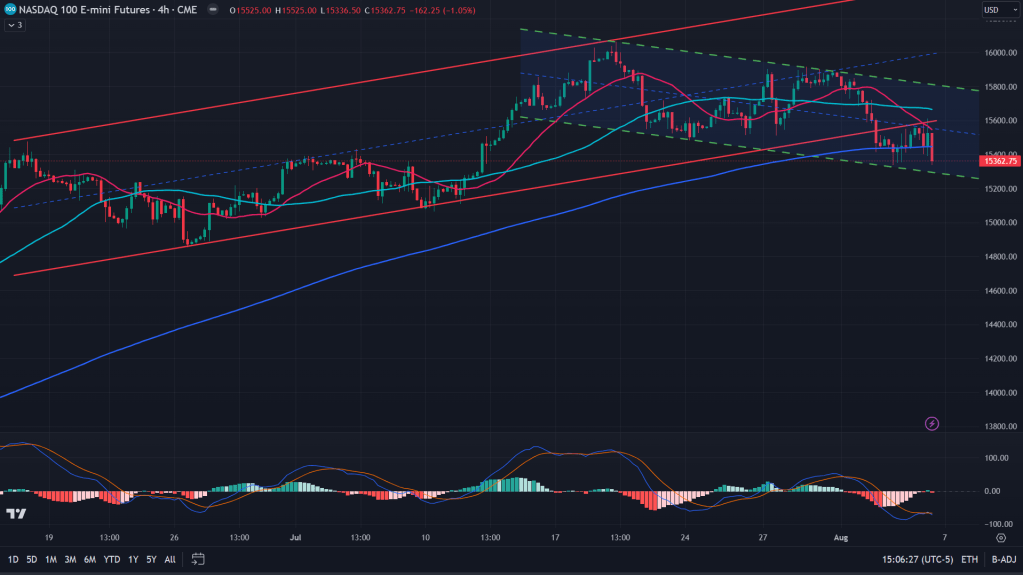
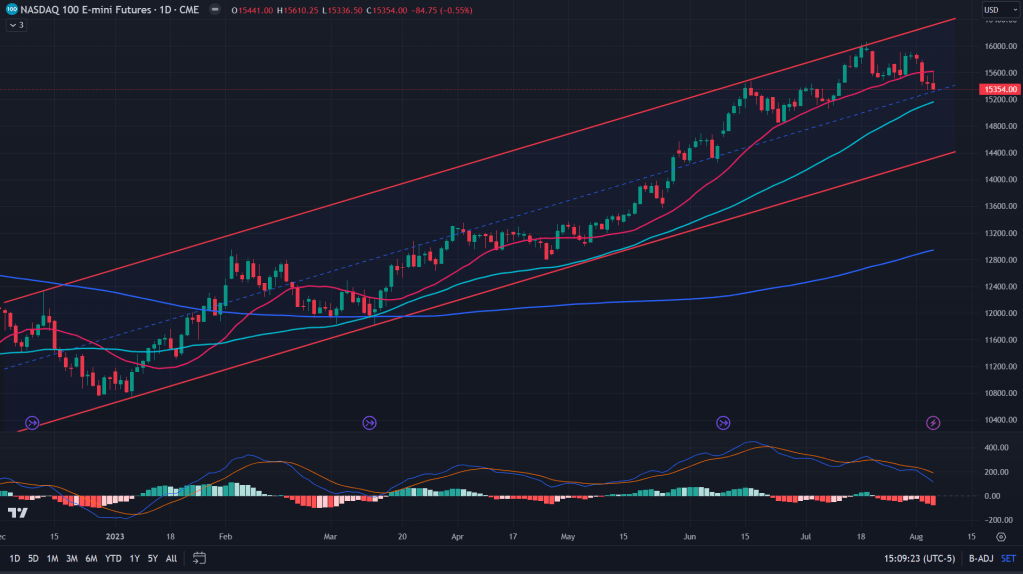
NQ (Daily): On the daily, while 20MA was given up quite early in the week, 50 MA isn’t far. Bearish sentiment continues for now with Friday’s candle being a bearish inverted hammer.
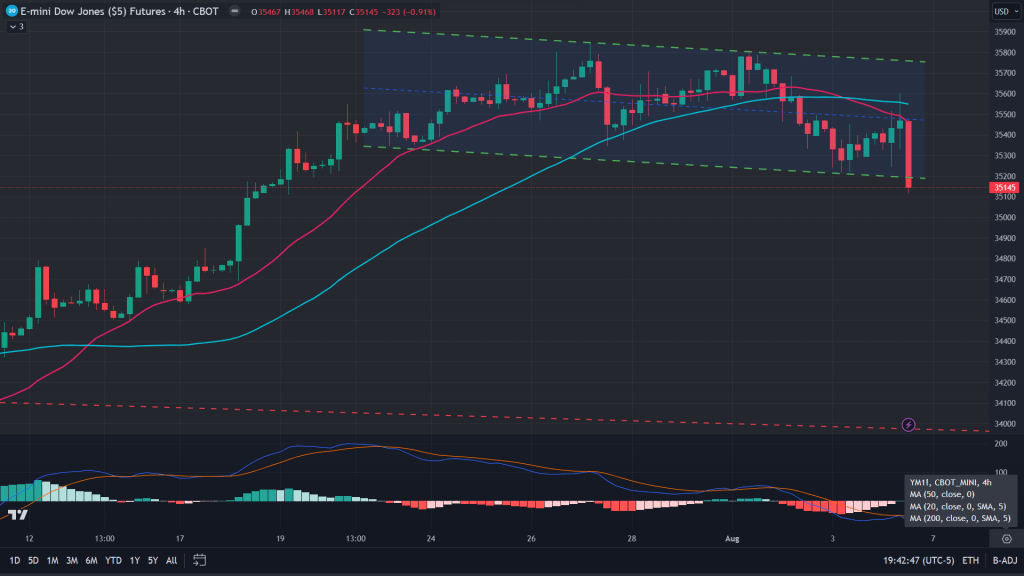
YM (4H): YM – The Dow Jones Industrial Average was supposed to be leading us to the upside with the strength that it was showing in the previous week. But nope, it is not to be. YM’s 4H chart has broken down of the channel that has been forming for the past few days and that’s not bullish!
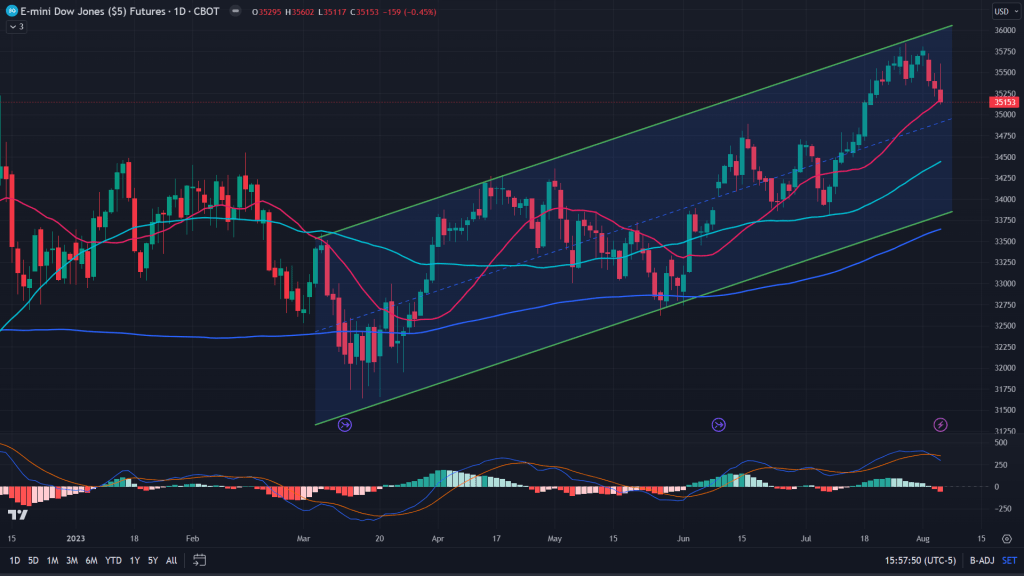
YM (Daily): Daily chart of the Dow, while just at the 20 days MA, has closed with an inverted hammer – Bearish!
YM (Weekly): That breakout of the inverse H&S that happened, probably it is the backtest of that breakout. We’ll know in the next few days.
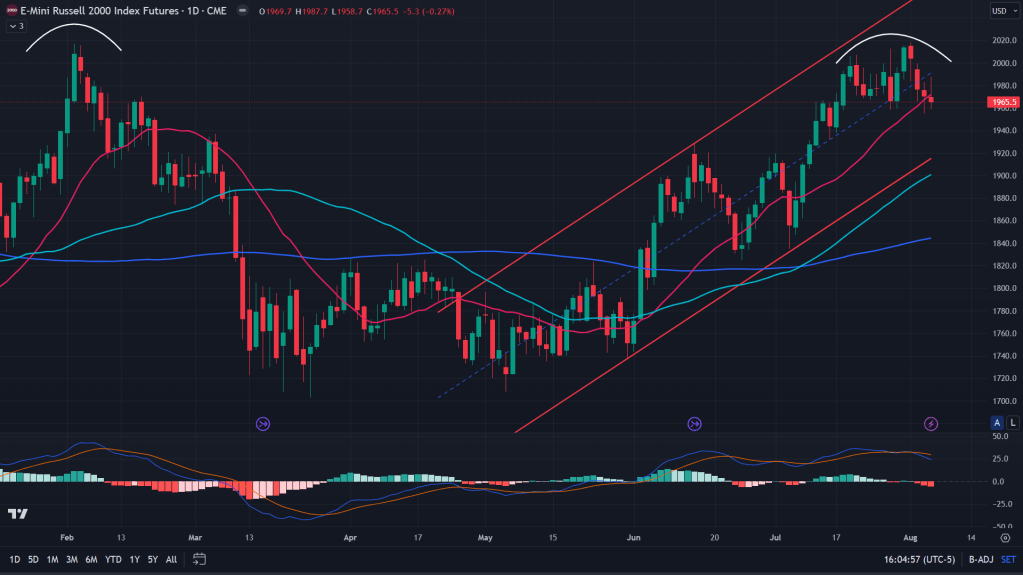
RTY (Daily): The double top in the last week and fast reversal after the top, along with 20MA breakdown is not healthy. Inverted hammer gives credence to the bearish view and we are headed towards 50MA mean reversion.
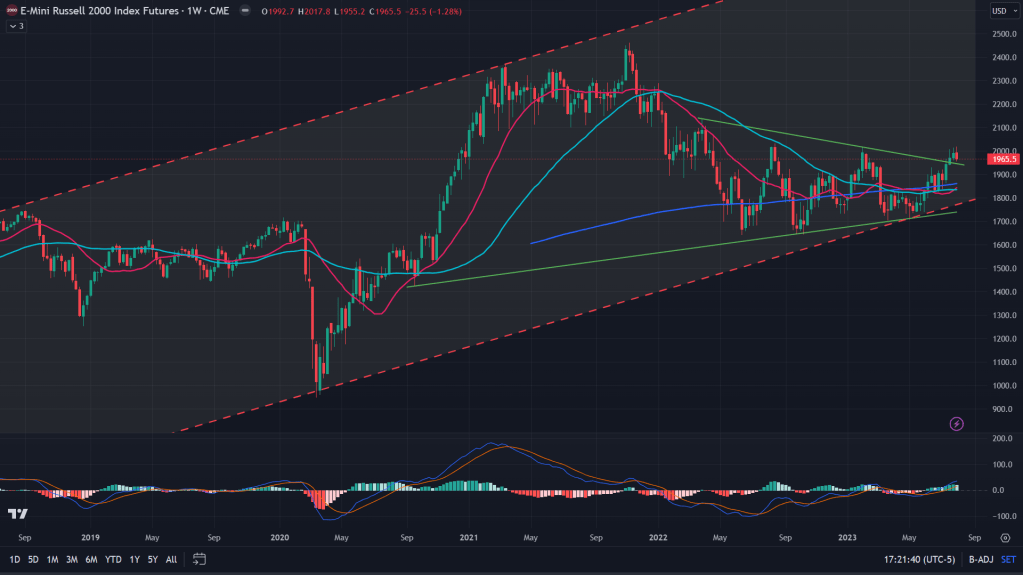
RTY (Weekly): There was a breakout of long pending trendline resistance last to last week, but that’s at the risk of failing if bulls don’t get their acts together.
Since the way market has fallen last week, I would be my technical view of the key stocks too this week.
Key stocks to watch:
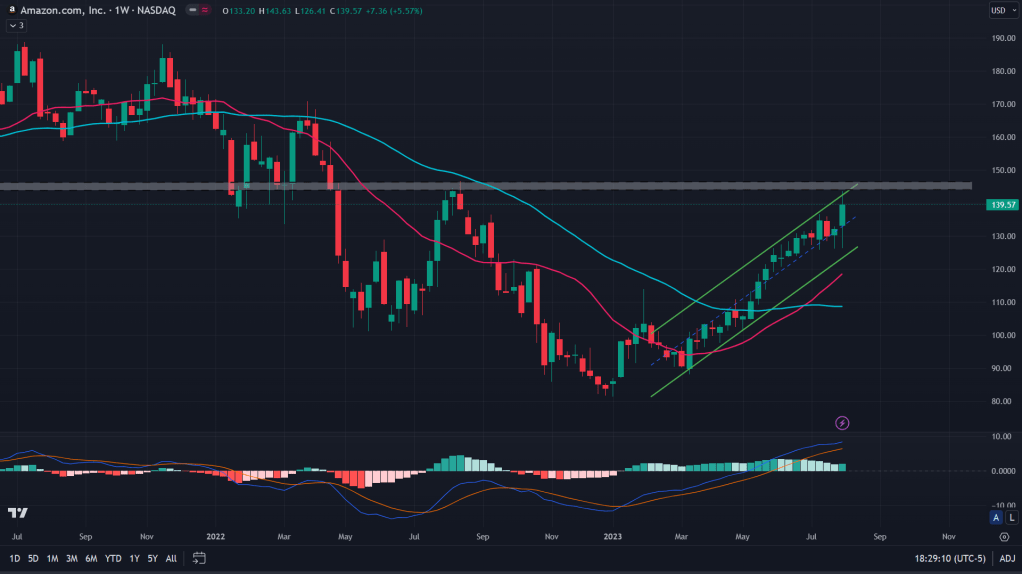
AMZN (Weekly): Weekly supply zone overhead and the stock reacted right at the upper end of that channel
TSLA (Daily): Big supply overhead, resulting into stock falling sharply and then there is this bearish H&S formation. Only solace – just stock being just above its daily 50 MA.

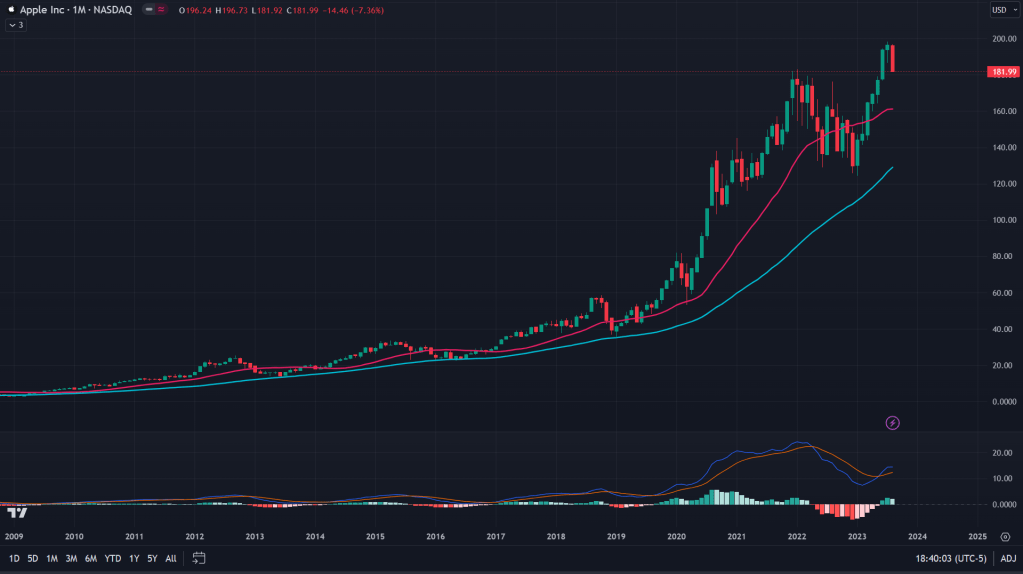
AAPL (Monthly): New high for the stock on the monthly chart but hey, where’s that high on the MACD? Not a healthy sign for the bulls.
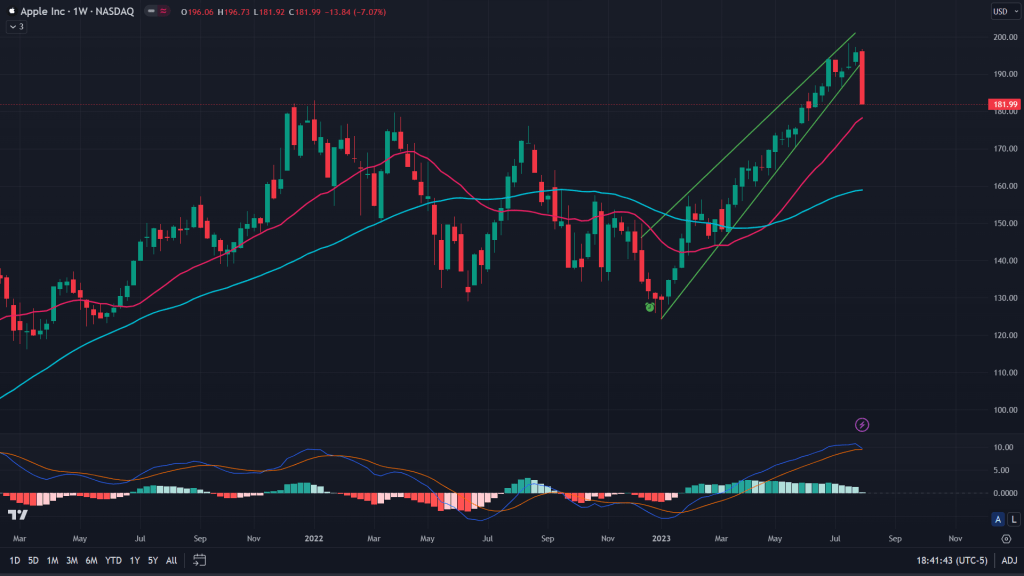
AAPL (weekly): If that wasn’t enough, rising wedge breakdown and that big red weekly candle that wiped out all the gains of the previous six weeks! No reason that can be bullish. I would sell if I was holding.
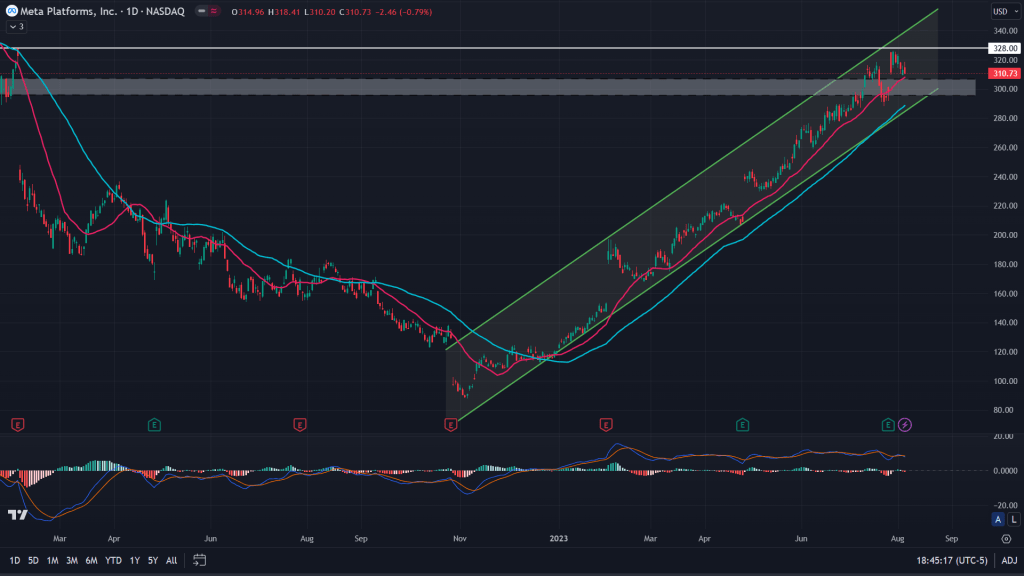
Meta (Daily): That white solid line is exactly from where the stock had a big gap down in February of last year. Couple that with channel resistance. Solace, weekly demand just under which was a supply zone earlier, along with 20MA on the daily. Negatively diverged MACD tells me, not to stay long.
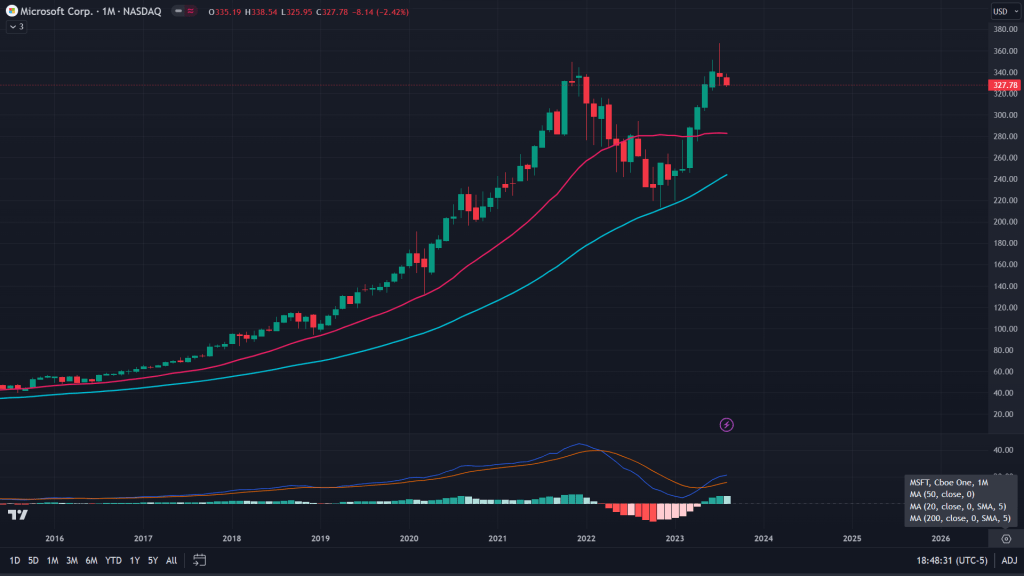
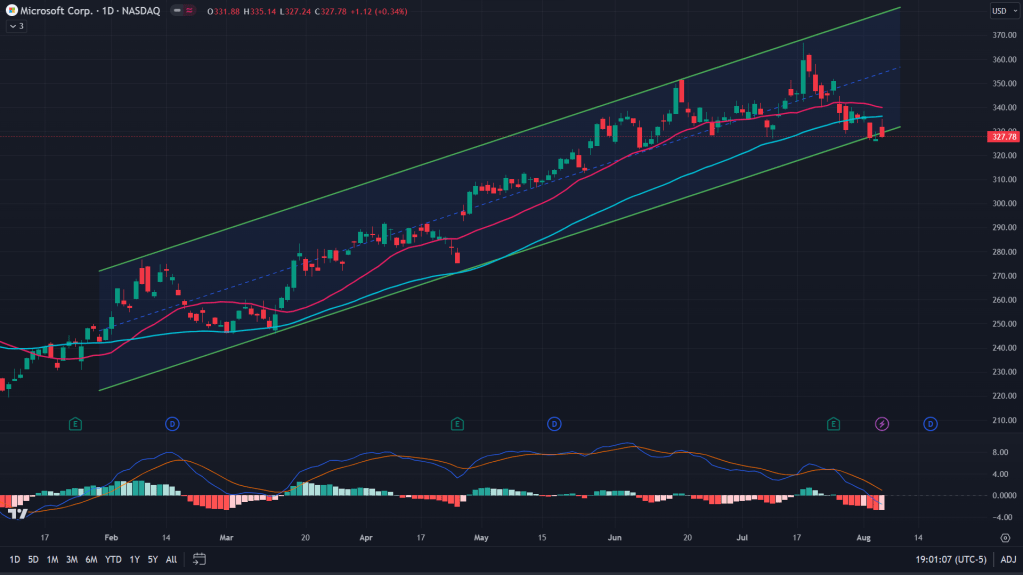
MSFT (Monthly): The two big tech behemoths have a similarity – MSFT’s chart is a replica of AAPL’s on the monthly with MACD not making a new high even as the stock made all time high. Last month’s candle was a gravestone doji at all time high. I am not holding the stock at these prices.
MSFT (Daily): Daily chart of the stock only adds further credence of the bearish view – Almost breakdown of the channel along with 20 and 50 MAs have given way for the bears.
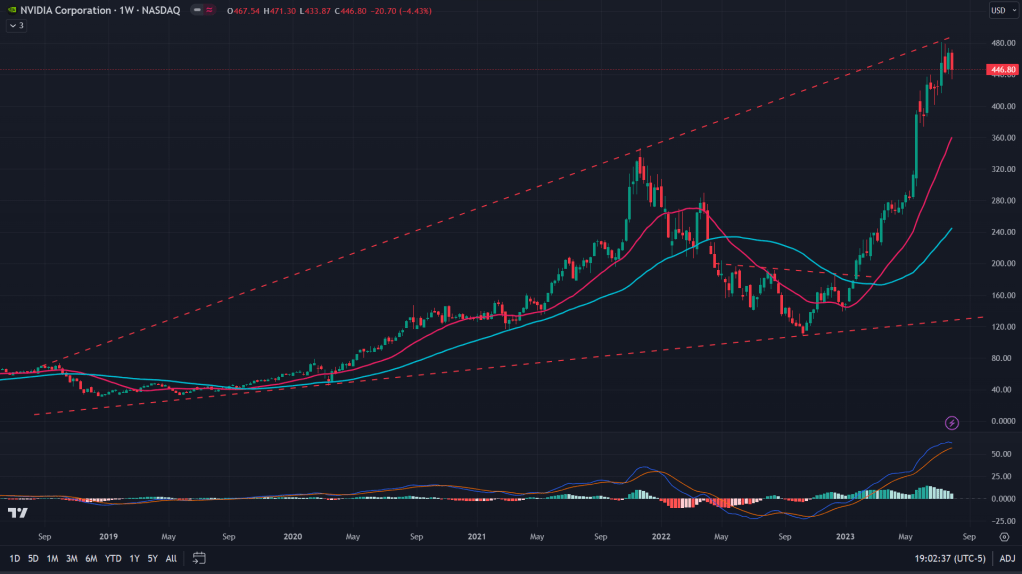
NVDA (Weekly): NVDA is at the top end of this weekly megaphone, while I wouldn’t be shorting the stock, I won’t hold my longs either.
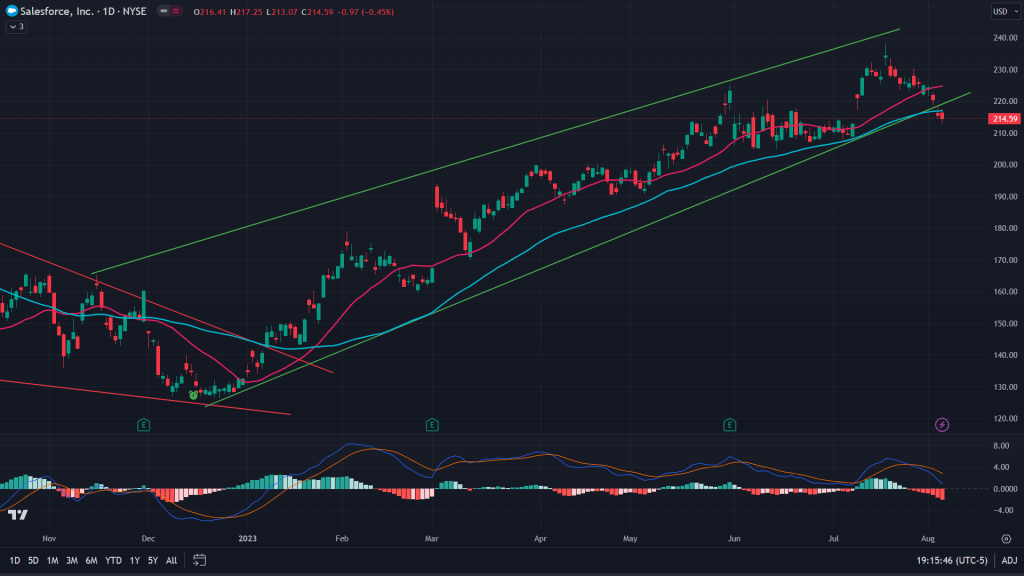
CRM (Daily): I have no problems shorting this stock – broken down of the rising wedge while 20 and 50 MAs have given up too!
Conclusion: Even as the trend may not have turned down for the key indexes, key stocks that led us all the way up, aren’t showing any healthy picture and their charts are all broken down.
I would be carrying my shorts on the ES while moving out of NQ shorts and be on the sideline while YM and RTY also react negatively.
Here’s a shameless plugin to the weekly markets update with Mukund:

Leave a comment