Hello fellow Indian investors! This one is one of those firsts of many blog posts I would be writing to share my thoughts about Indian markets. Before you scroll through, here’s what I need to mention that you must know to better understand my viewpoints.
- While I would be writing a lot about macro economics and fundamentals of individual stocks as well as broader markets, 90% of my articles would be based on technical analysis. Technical analysis is not a science wherein A + B = C. Many a times it equals D, E or even F. It is based on historical precedence and more often than not history ends up rhyming again.
- I base my analysis on primary indicators and then validate it by looking at secondary indicators of the charts. Primary indicators are candlesticks (red and green candles), trendlines (those straight lines that I manually draw), moving averages (red, green and blue curves) and all the patterns that can be drawn with the help of trendlines. Secondary indicators are MACD (Moving Averages Convergence and Divergence), RSI (Relative Strength Index), Stochastics and many more such indicators. And hence kindly be patient enough to understand what those indicators are pointing to.
- One key principle of technical analysis is that higher the time frame of the analysis, more accurate the results are. For example, if there is one bullish pattern on an hourly chart and there is another bearish pattern on the daily or weekly chart, I would rather trust the daily and weekly chart as against the hourly one for the accuracy of my result.
- One candle on the chart represents one period of that time frame. So in a monthly chart, one candle represents one month and in a daily chart, one candle represents one day. So on and so forth.
With that in mind, lets dive in and understand what we have in store for our Indian markets:
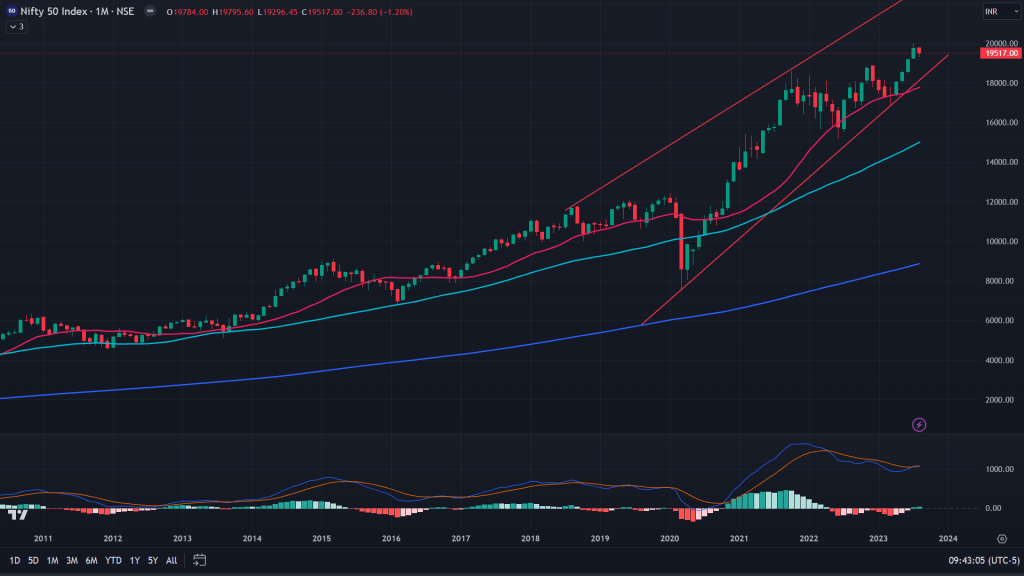
Nifty (Monthly): I have been sharing my view on Twitter on and off about Nifty and I have had this view that Nifty would be making a new high soon before it heads lower (Read this tweet dated 12th Sept, 2022). While that view has come true for the first part of it, I expect the second part of it to start unfolding in the next 4-6 months. It is forming a bearish rising wedge, which is yet to break down. The lower end of that wedge (drawn in red lines) is where it would result in a breakdown. As I explained in the notes above, its a monthly chart and may take its own sweet time to unfold and hence we must take a look at the smaller time frames to understand what is expected in the next few days.
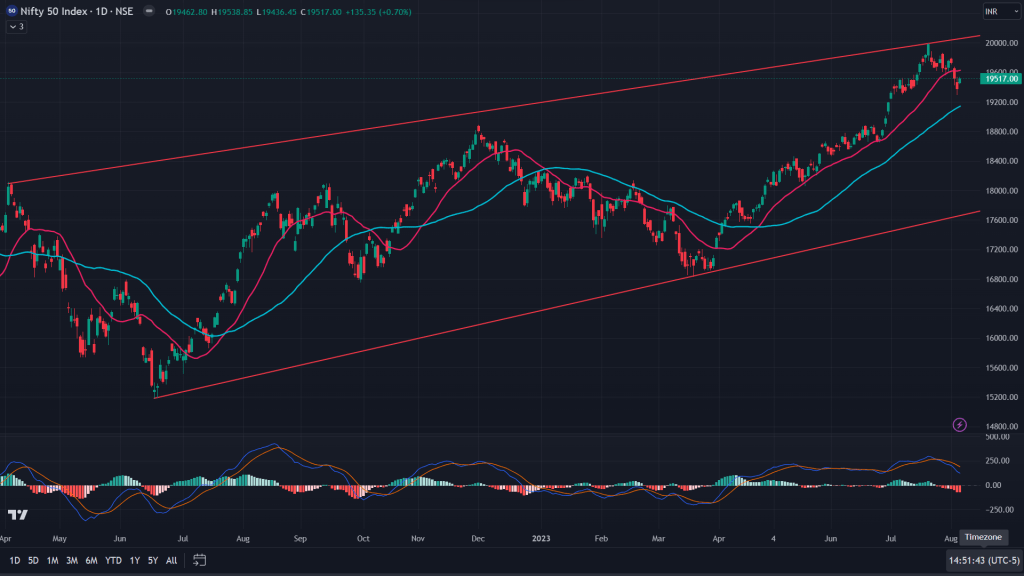
Nifty (Daily): Daily chart of Nifty is also forming a rising wedge, but the difference is that this wedge is still not complete and the price of Nifty is just above the 50 days moving average (DMA – green curve). I would expect Nifty to bounce sharply from that 50 DMA and may head towards upper end of the wedge again.
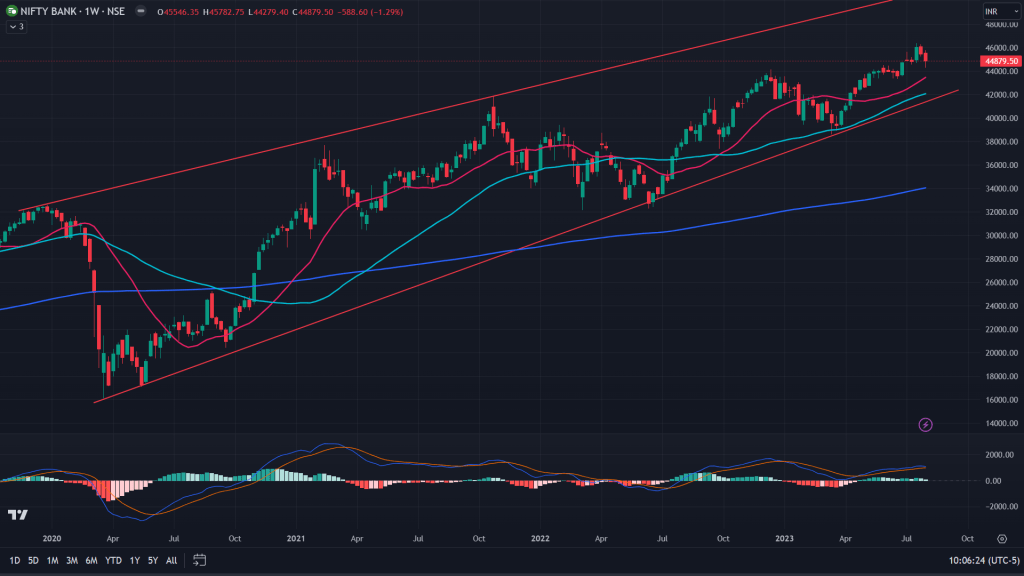
BankNifty (Weekly): Just like its larger peer, BankNifty too is forming a rising wedge on the weekly chart. The key part – The wedge is towards end of its completion along with negatively diverged MACD (lower part of the chart). What is MACD? MACD depicts momentum of traders/investors in the market. So what does negative divergence mean? Negative MACD divergence mean here that while BankNifty made new high in the past many weeks all along, MACD made lower highs. So the curve of BankNifty moved higher, but traders’ and investors’ momentum has been waning with each such new high. Thats a sign of things to come – In this case, we are headed of lower days ahead and we should use these higher prices to book out of our longs.
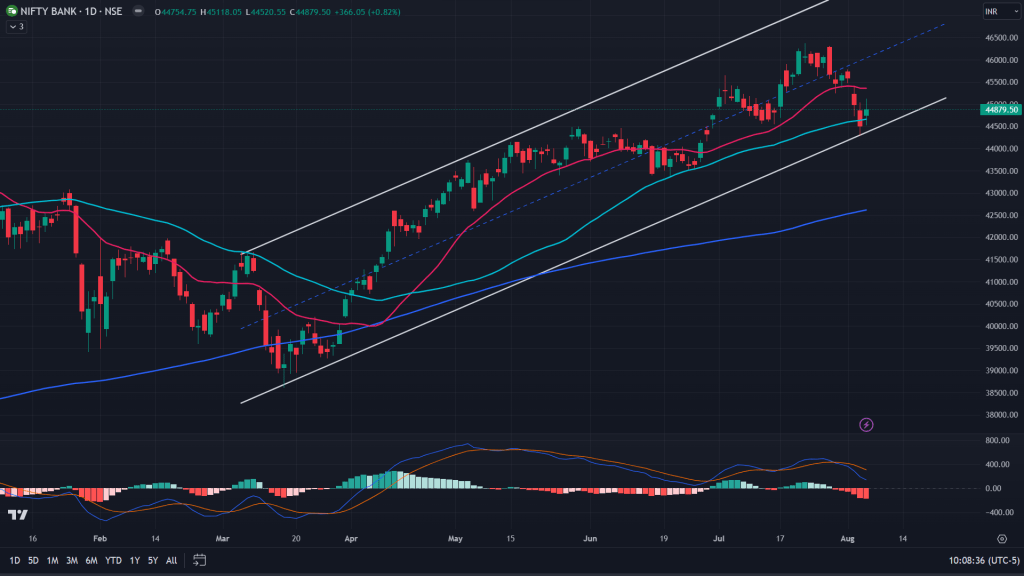
BankNifty (Daily): The daily chart of BankNifty is at a critical juncture – Right above the 50 days moving average and lower end of this channel which has been forming since March lows. I would expect Friday’s bounce to sustain for now, before it gives up.
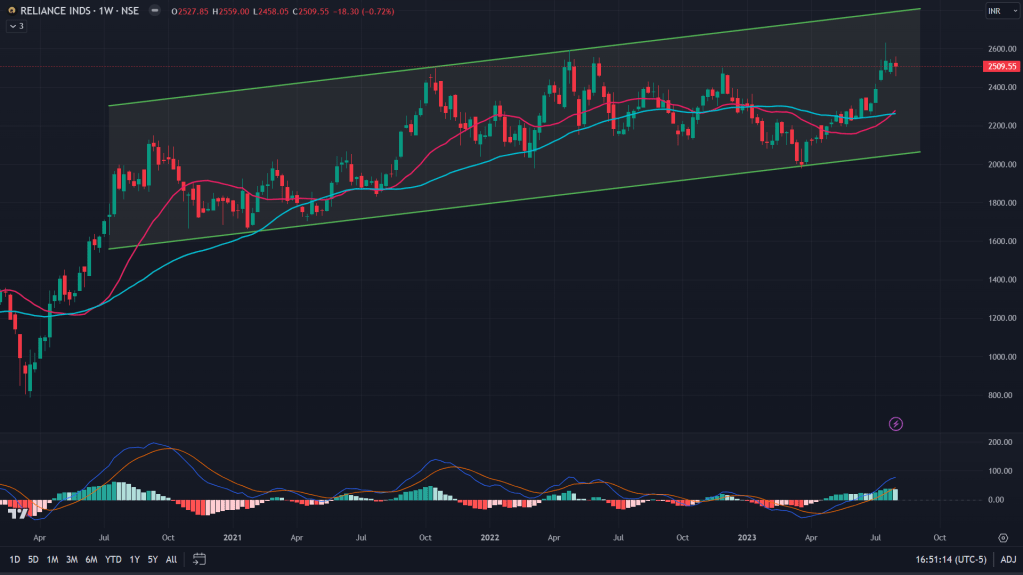
Reliance Industries (Weekly): The biggest heavyweight of Indian stocks – RIL has been in formation of this channel (in green) since 2021. While the stock has been continuing to form higher high all this time, momentum has been waning all the while, as seen as negatively diverged MACD. I wouldn’t be holding the stock for a long period of time and newer highs I would use to exit my longs.
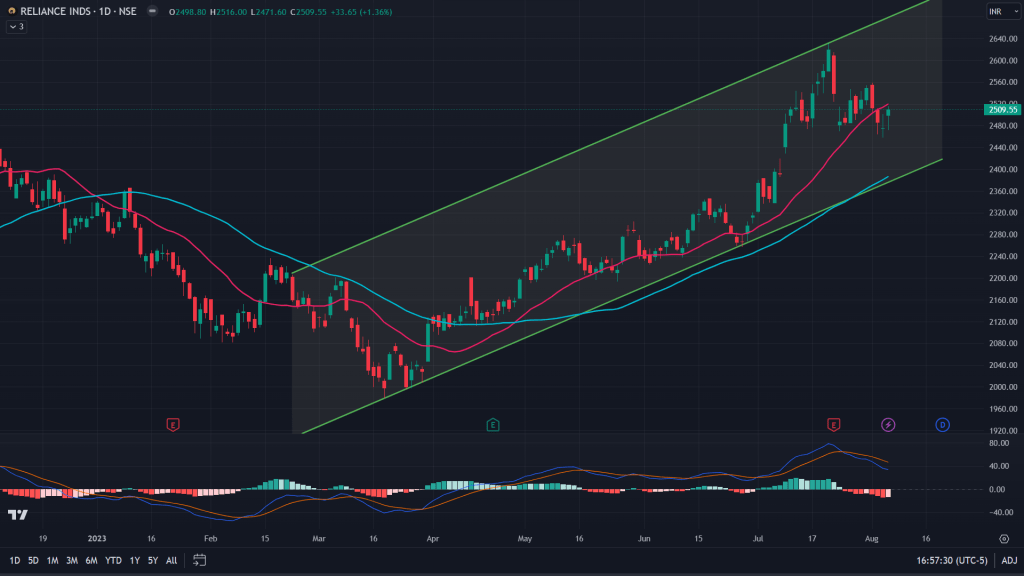
Reliance Industries (Daily chart): On the daily chart, the stock has given up on its 20MA after retracting from upper end of the channel and I would expect the stock to head towards 50 days MA before moving higher again.
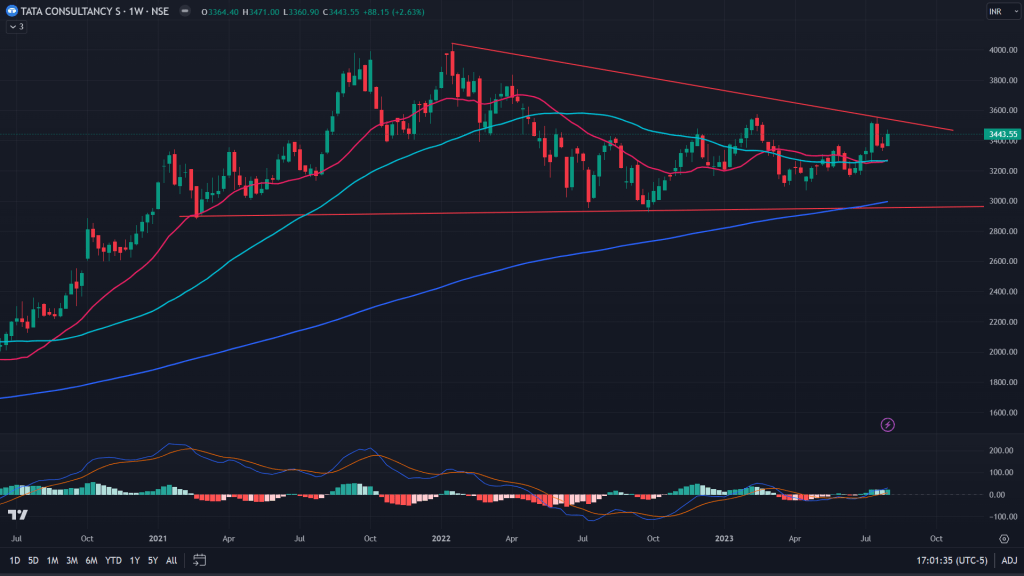
TCS (Weekly): The IT behemoth of Indian stock markets has been forming descending triangle on the weekly charts. A descending triangle is a bearish pattern wherein a stock stops making new highs while the ranges in which it trades, keeps getting narrower to the right. Indicating bulls are not comfortable holding the stock and are exiting their positions at every bounce. At some point, the stock falls past lower end of the triangle, which is near horizontal line (solid red line in this case).
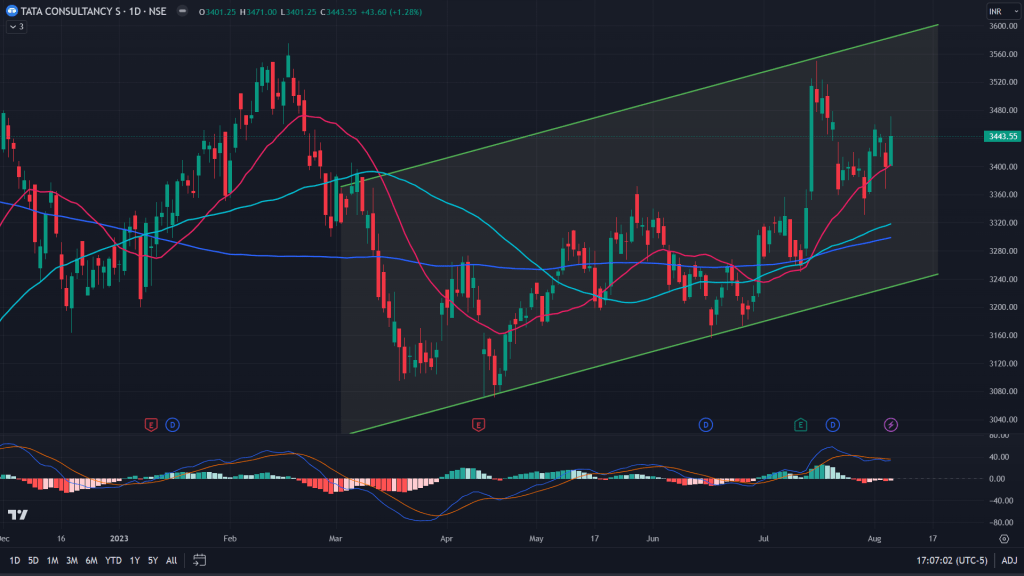
TCS (Daily): On the daily chart, however, the stock has been stuck in this channel for the past few months and I would expect one more attempt at reaching upper end of the channel in the next few days.
Conclusion: While there are many more stocks to cover, one blog post can cover only so much and I would come up with more names and more deeper analysis in the coming days. For now, I would like to conclude that:
- In the immediate term, for the next week or so, Nifty is headed lower towards its 50 MA, which is placed at 18,230.
- BankNifty is at a critical juncture with daily 50 MA and lower end of the channel right under. I would expect a bounce from here before trying to head back lower again.
- Finally to conclude: Do not believe in predictions in technical analysis and rather trust the price action because predictions would create biases while price action would give you more clarity.

Leave a comment