Last week was horrendous from bulls’ point of view and was horrible for me as well because I had carried YM longs, though made some money during first part of the week but lost some during the end of the week when markets didn’t spare any bull. Inspite of that, it’s little disappointing that I didn’t actually trade my own view based on the weekly chart. Another week and another learning that is! Lets now do a deep dive into what’s in store for us:
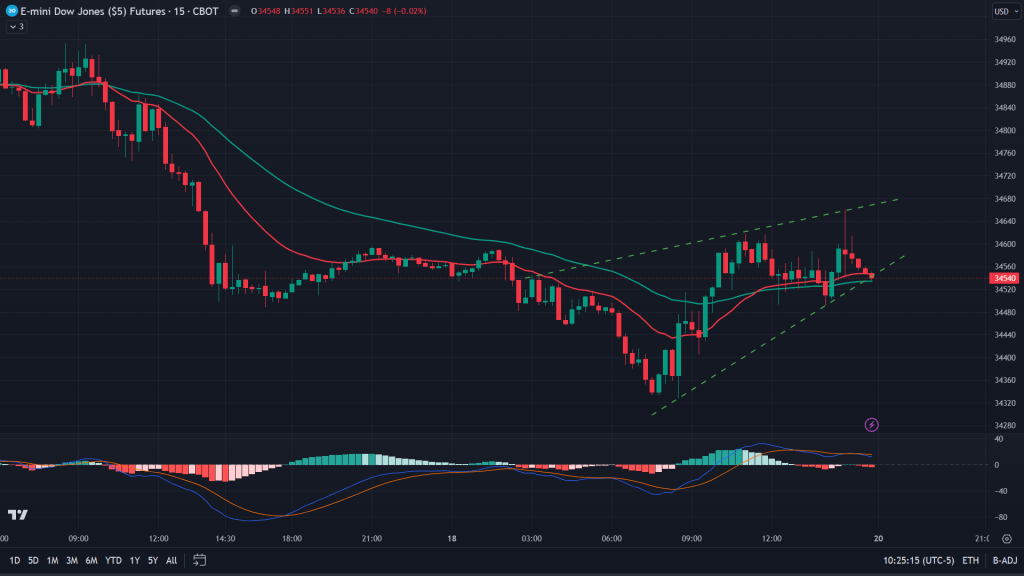
ES (15 mins): That falling wedge breakout is the reason why we saw that bounce during later part of the day and forming a bullish inverse H&S in the process. But as I have been saying time and again, I prefer not giving too much credit to lower time frame breakouts/breakdowns unless there is similar confirmation on the higher time frames. Lets see what we get there.
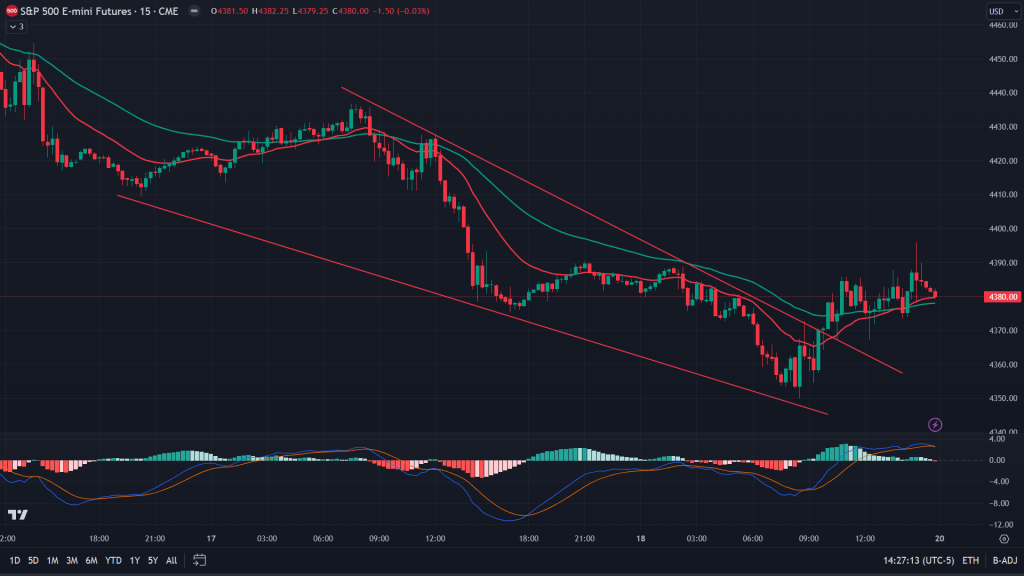
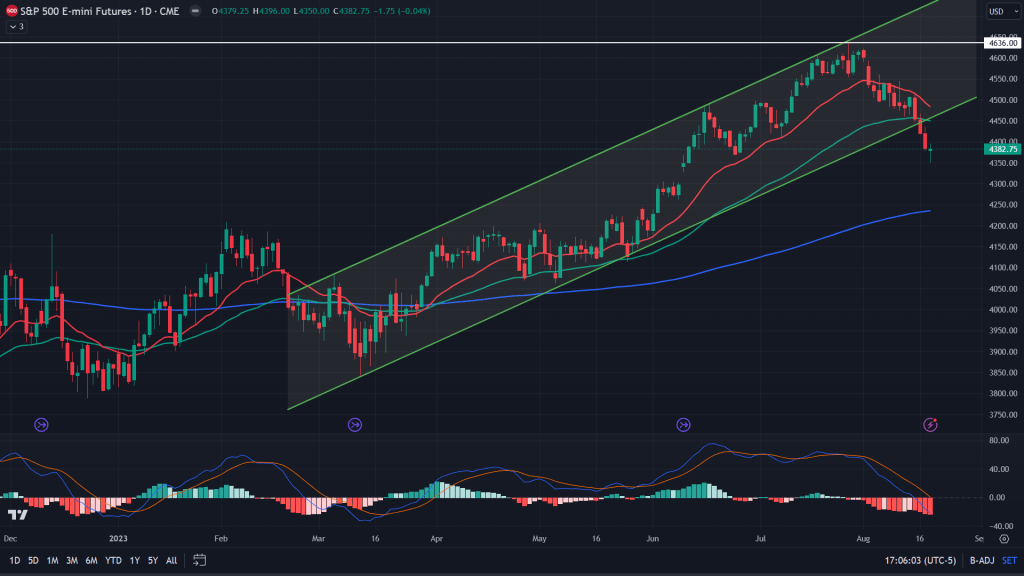
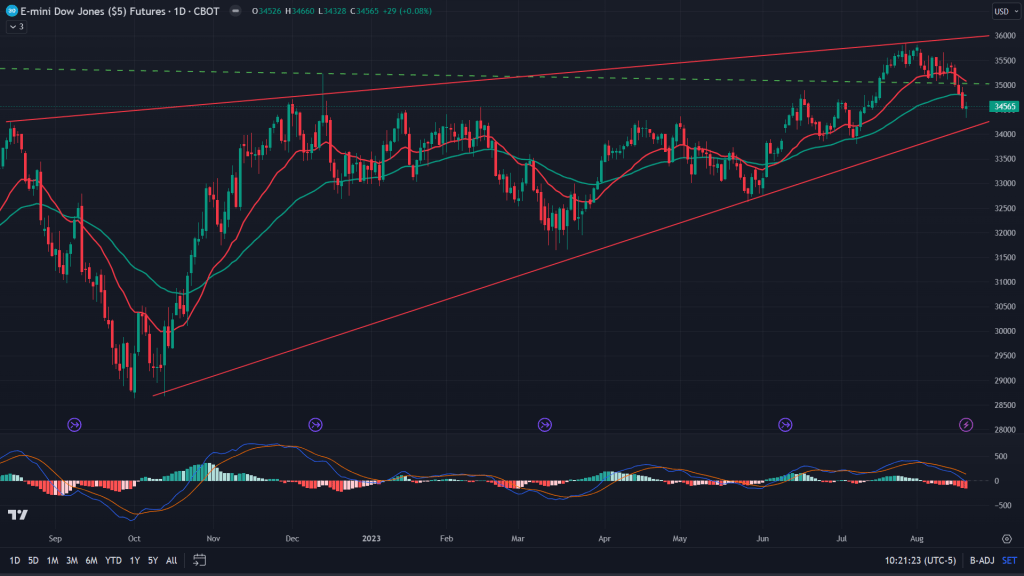
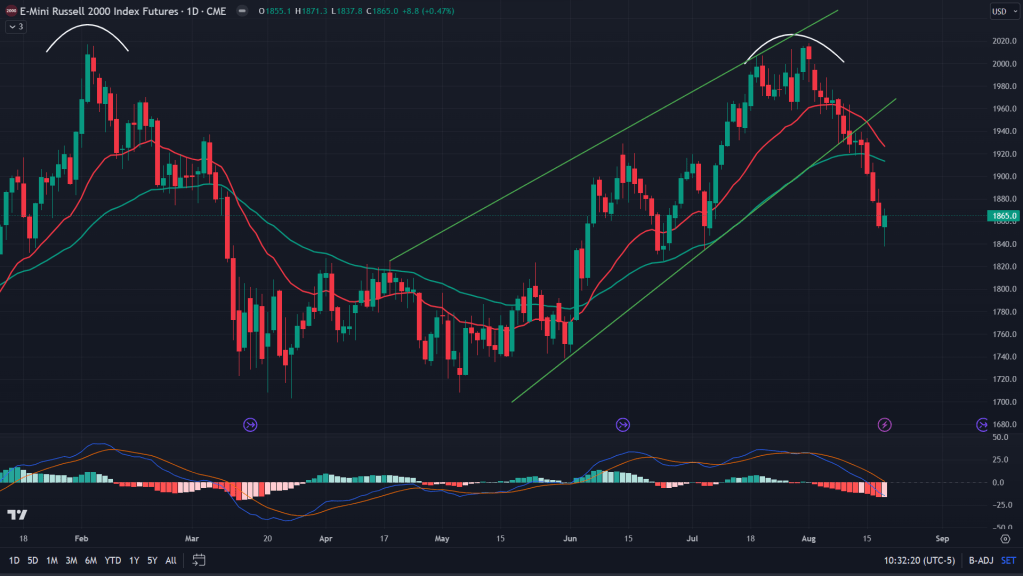
ES (Daily): Markets were in complete bears’ control Tuesday onwards once it broke down of the 50 EMA. Although bulls did hope to save the day with the help of that lower end of the channel on Wednesday, but it didn’t go as per the plan and continued to bleed to break down of the months long channel.
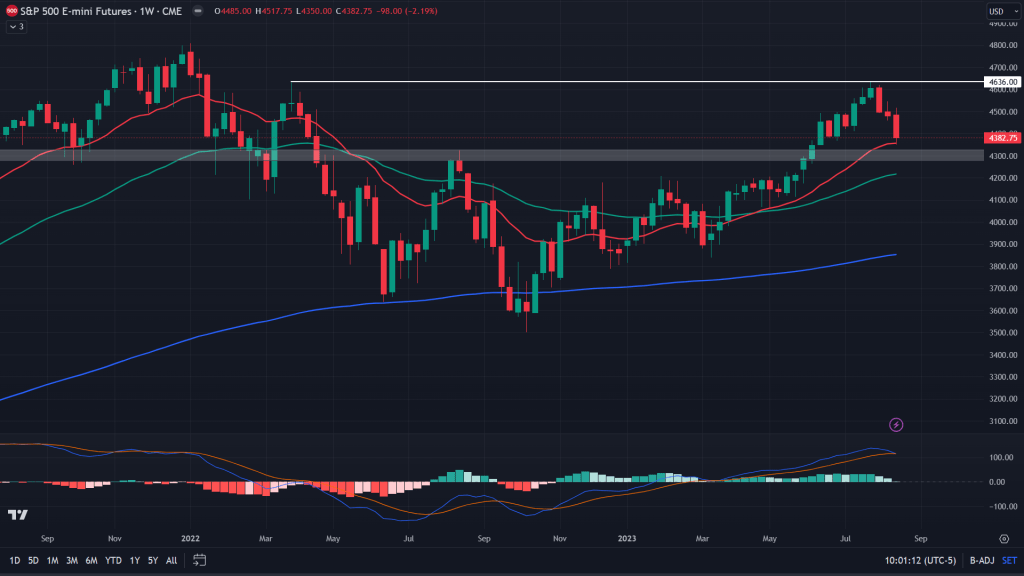
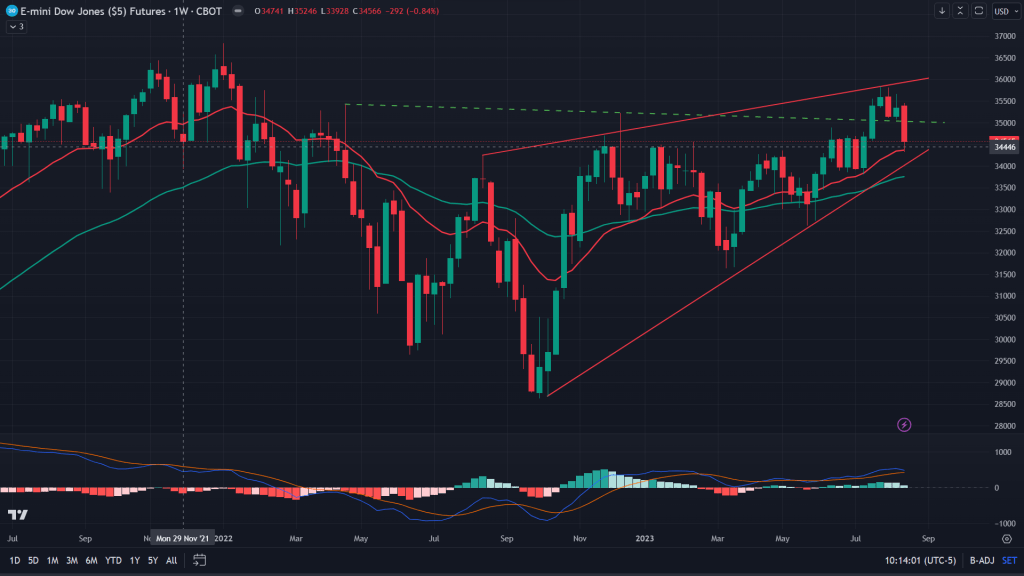
ES (Weekly): Key chart is the weekly one – After that double top we came down all the way to the 20 EMA on the weekly and onto the demand zone just down under. Very critical from bulls point of view and probably one of those last few hopeful zones before they throw in the towels.
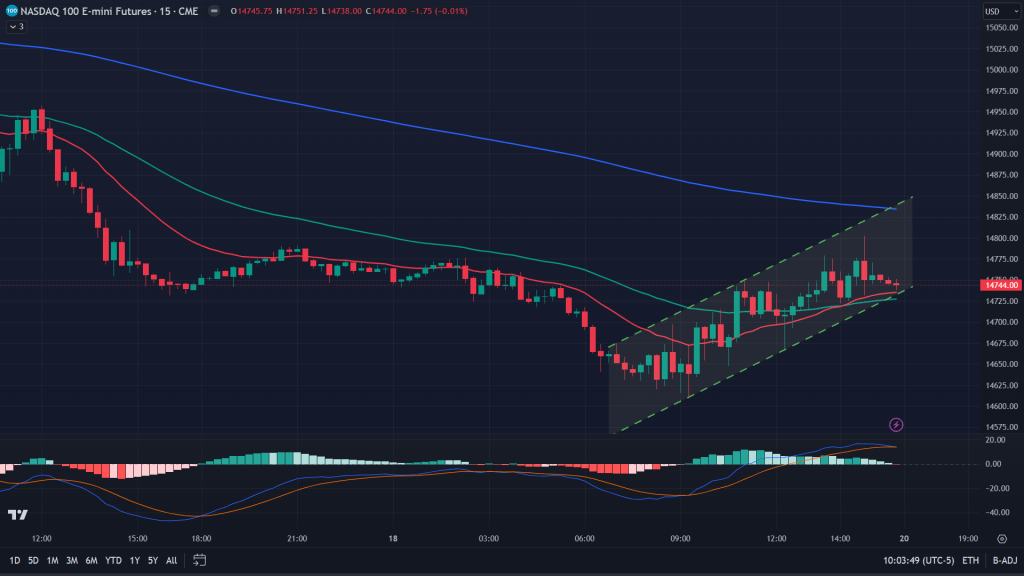
NQ (15 mins): Not so good news for the bulls on the 15 minute charts – formation of a bear flag. Lets get better understanding from higher time frames and see if there is any hope of a respite.
NQ (1H): Just like the ES, even NQ had a falling wedge breakout that resulted into the bounce during later half of the day. What next? Lets zoom out further:
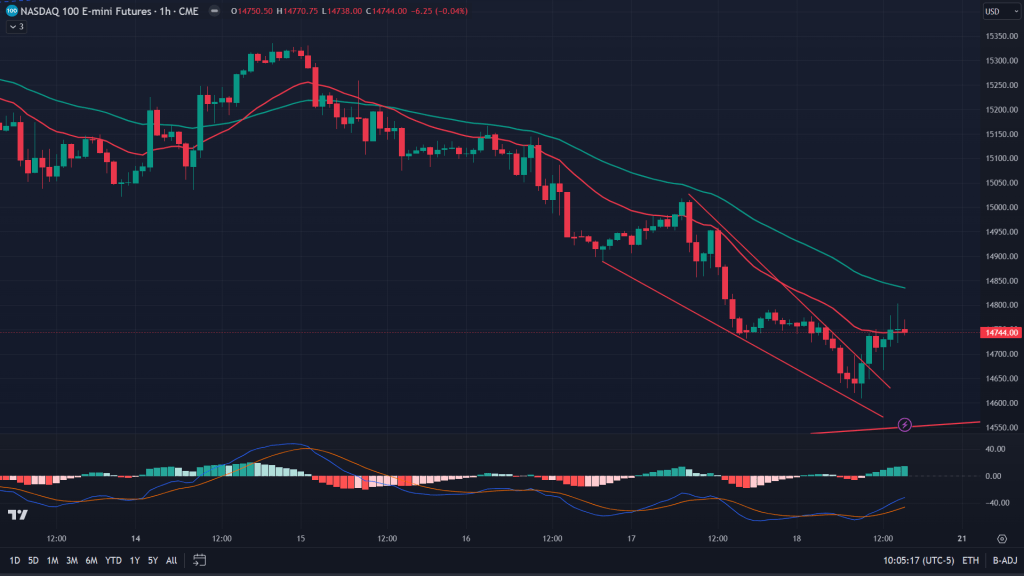
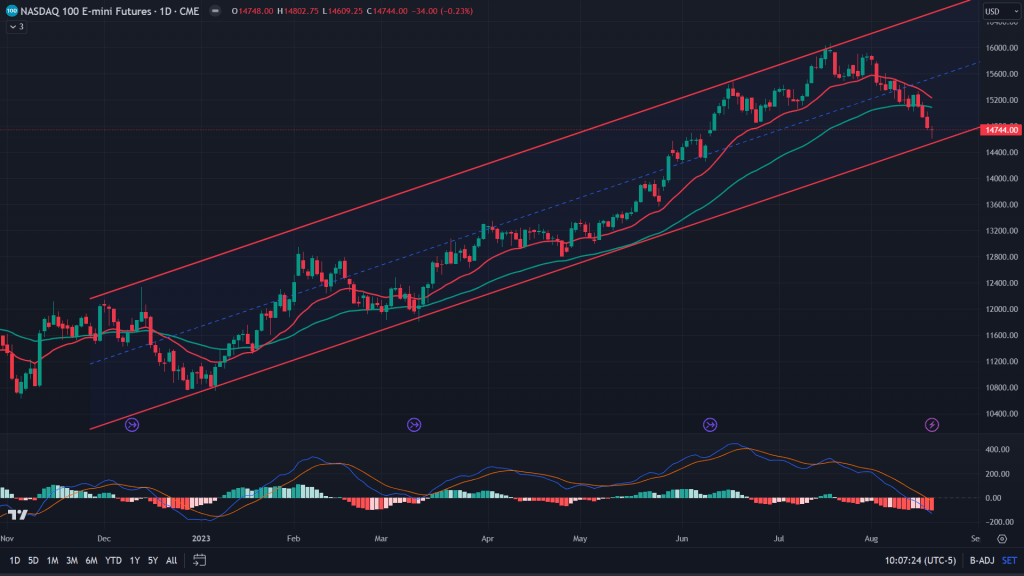
NQ (Daily): Bigger reason of that bounce was not just the falling wedge, but the lower end of this channel that has been forming all through this year. Some hopes for the bulls to try and bounce from here.
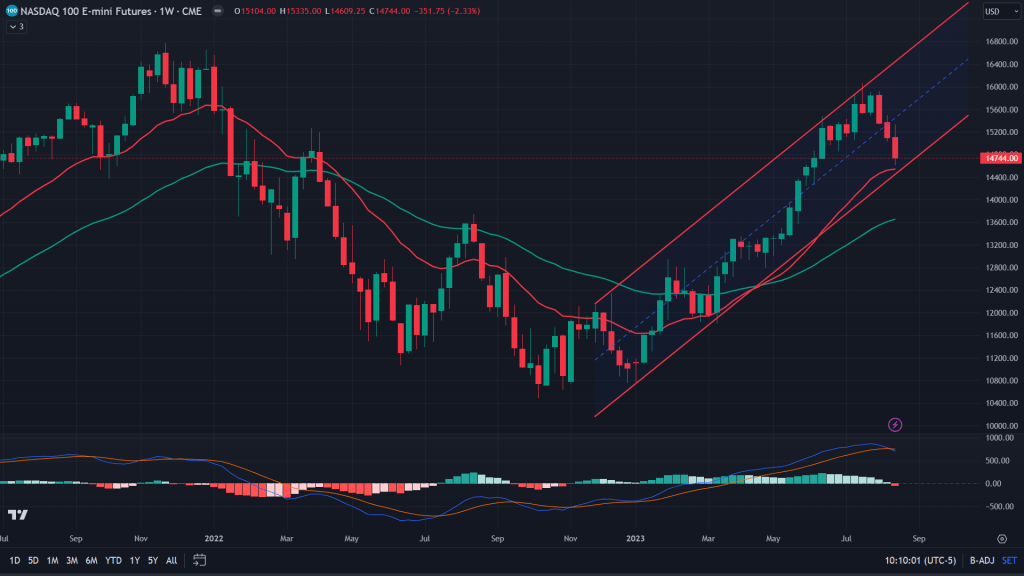
NQ (Weekly): While that channel support was a good enough reason to try a bounce, 20EMA on the weekly adds credence to the hopes. Next week is more critical from this very perspective if this so called bull market has to survive for the rest of the year.
YM (15 mins): The Dow Jones futures, did have a sharper bounce and it indeed gave a breakout of the 15 mins inverse H&S too, but only to fail at the end of the day on Friday. Not a healthy picture.
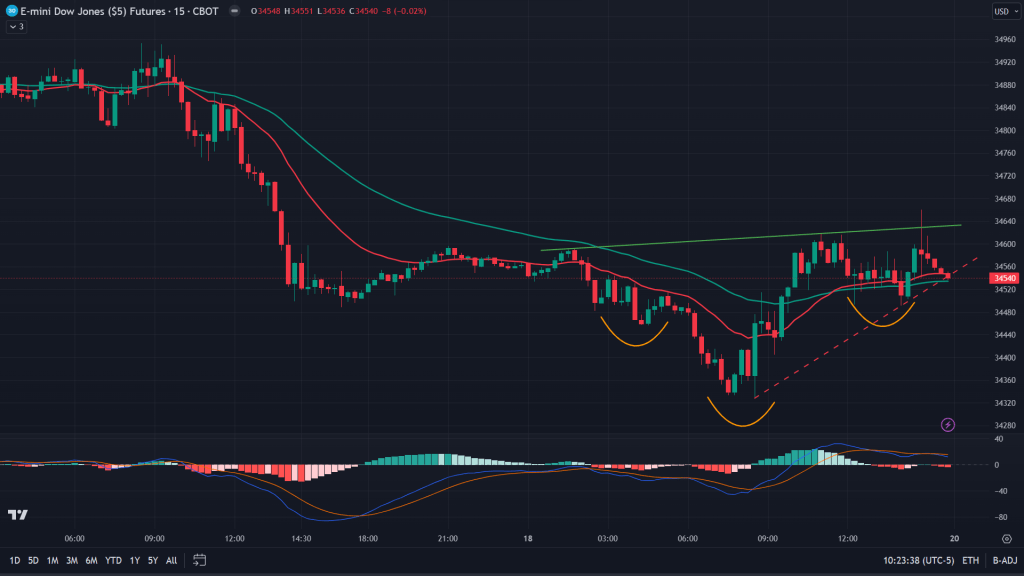
YM (15 mins) – Alternative view: Now that inverse H&S has failed after the breakout, alternatively it looks like forming a rising wedge on the 15 minute candles – again, not a bullish sign!
YM (Daily): Adding salt to the wound is the fact that it has broken down off 20 as well as 50 EMAs (bulls tried all they could but failed) and now sitting just above the lower end of this rising wedge that has been forming since last 1 year – Not a healthy sign!
YM (Weekly): Along with lower end of the wedge, bulls get respite with 20EMA as a crucial support, although big failure is reversal of that big breakout (green dashed line). I would be very cautious of my longs here.
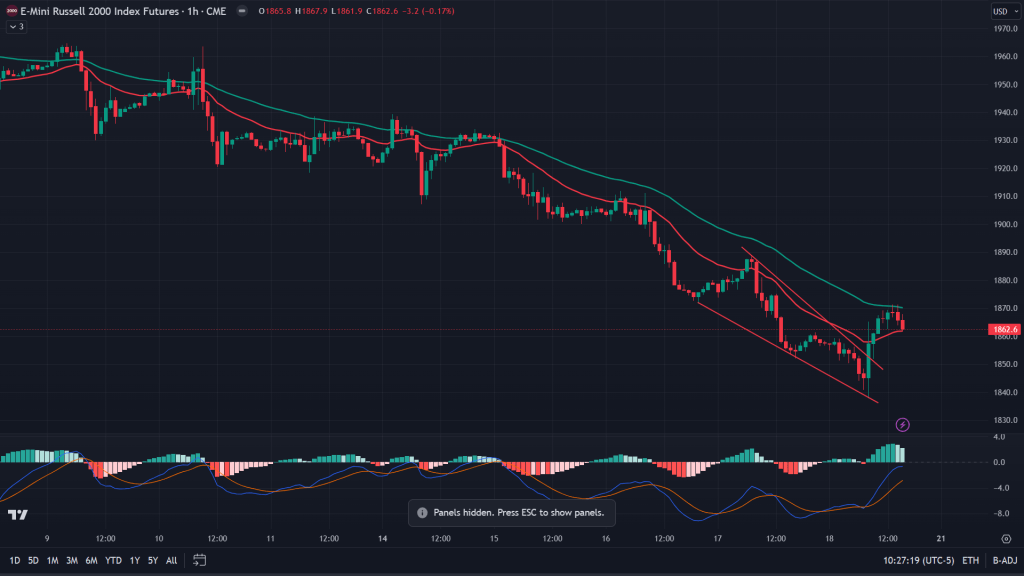
RTY (1H): Yet another breakout on a smaller time frame that now seems to be reversing. This falling wedge breakout on the hourly has kind of reversed from the 50 EMA of the hourly. Whether it manages to create a higher low and bounce back above 50 EMA of the hourly is something to be seen and would depend more on the daily and weekly charts.
RTY (Daily): After the double top, RTY fell as sharply as it rose preceding the double top – A big danger sign for the bulls for the bigger things lying ahead. Although there does seem to be a double bottom in play, but I won’t hold my breath for it to hold.
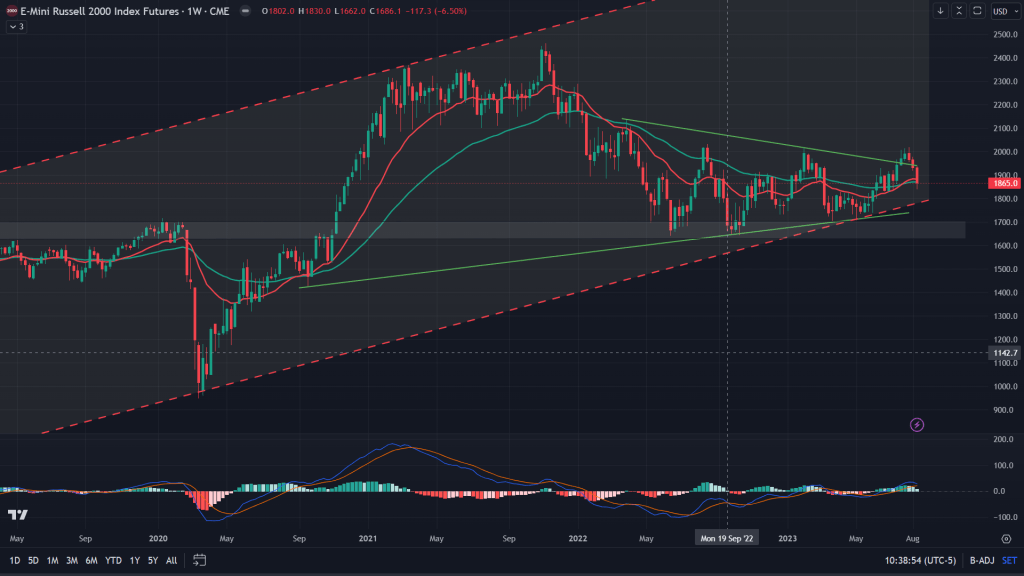
RTY (Weekly): That failed breakout on the weekly has now landed itself on the verge of breaking down of this long-term channel. Although for now it is sitting right at the juncture of 20 and 50 EMAs of the weekly and other supports in the form of lower end of the channel and trendline support right underneath.
Conclusion: If last week things were broken, now it is all the more shaken. Apart from the 20 EMA of the weekly and supports in the form of lower end of the wedges and channels – which are bearish if and when breaks down, I find no reason to be heavily bullish. At best one can do some nibbling in with very tight stops but get out at a slight sign of a panic. Next few days and couple of weeks would be far more crucial than ever.

Leave a comment