After the NFP data on Friday, which seemed to be indicating rise in unemployment rate even as the number of employees being hired met market expectations, there was a bounce that got sold off hard. Usually such sell-offs, especially after a good news, isn’t a healthy sign. So, lets see what are we getting technically:
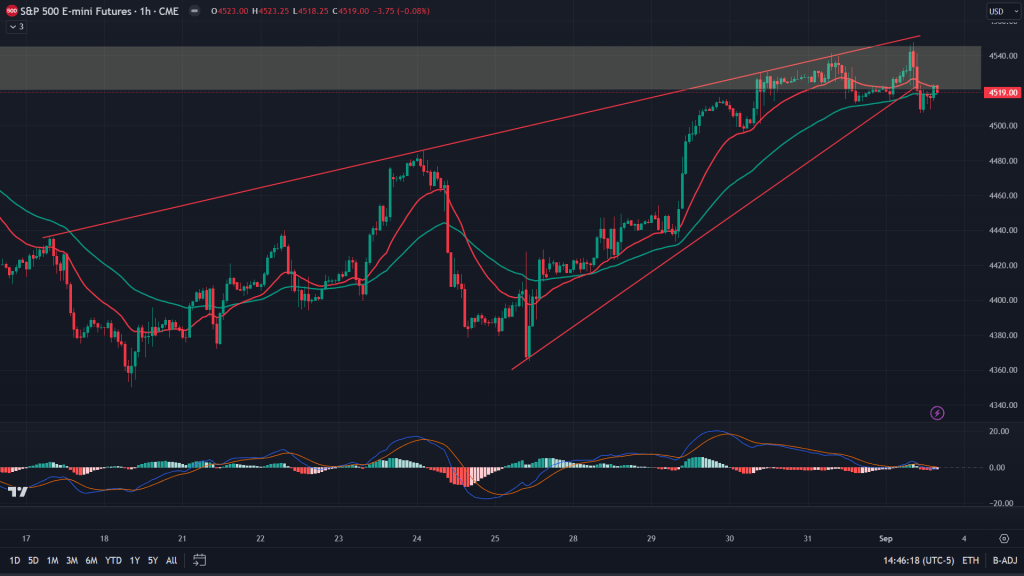
ES (1H): ES broke down of this rising wedge, rallied back again only to backtest the breakdown and then fall again. It all happened while ES was on course to try and cross past the supply zone (greyed area), but it all looks futile now.
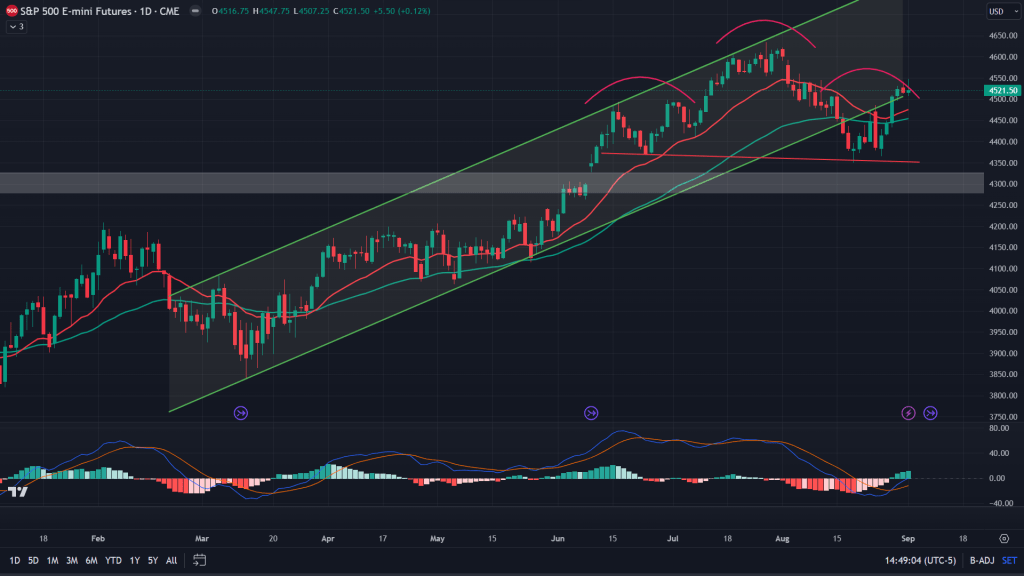
ES (Daily): Once we zoom out a bit towards daily chart, we talked about that bearish head and shoulders formation wherein the right shoulder is still forming. It is likely to have formed now with the inverted hammer close on Friday.
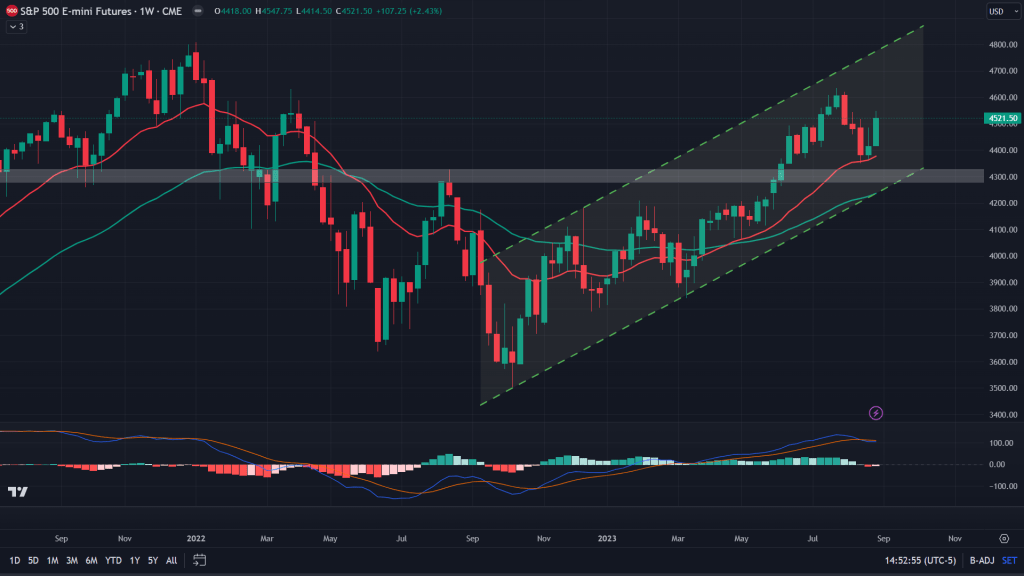
ES (Weekly): Bears can’t take it lightly though, with such a massive green weekly candle, off the 20 weeks MA isn’t easy to break down. If there isn’t another attempt to test the 20 weeks MA in the coming week, bears would have lesser chance to avert bulls from making an attempt for a new high.
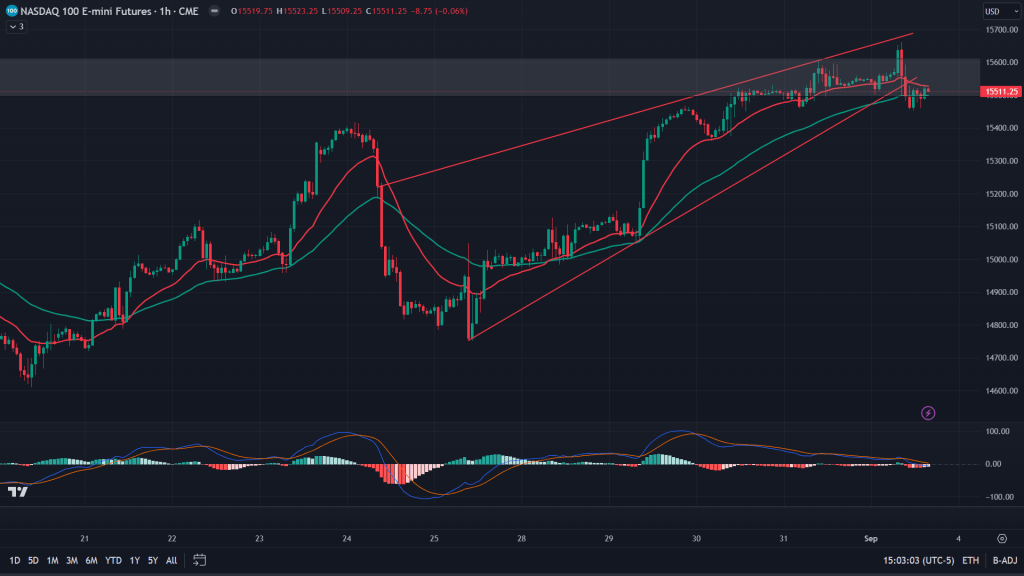
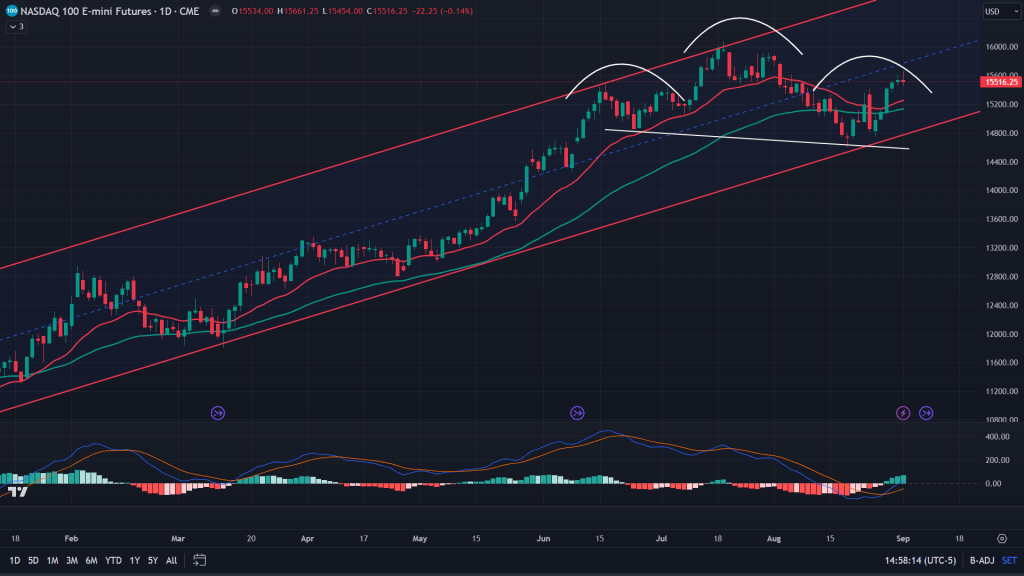
NQ (1H): Just like ES, even NQ has this rising wedge breakdown on 1H, after consolidating inside that supply zone for couple of days.
NQ (Daily): Daily chart of NQ too is similar to that of the ES, forming that right shoulder of the bearish H&S and forming a gravestone doji like candle. This gives enough credence to the bears to continue their onslaught.
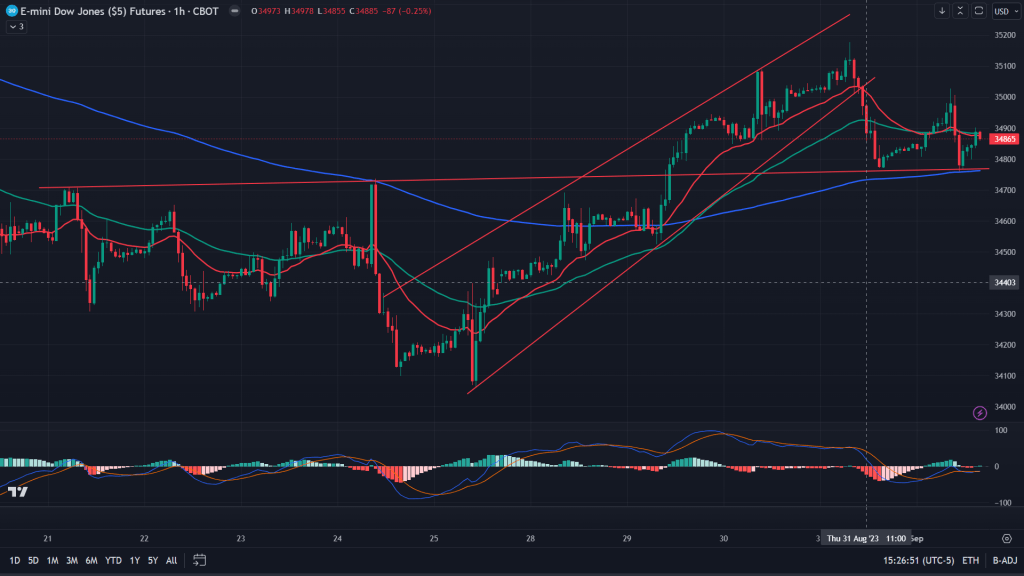
YM (1H): Down Jones Industrial Average’s future index, while it was the leader that led to the upside, it seems to be leading us to the downside this time too. YM broke down of this rising wedge much before ES and NQ did so.
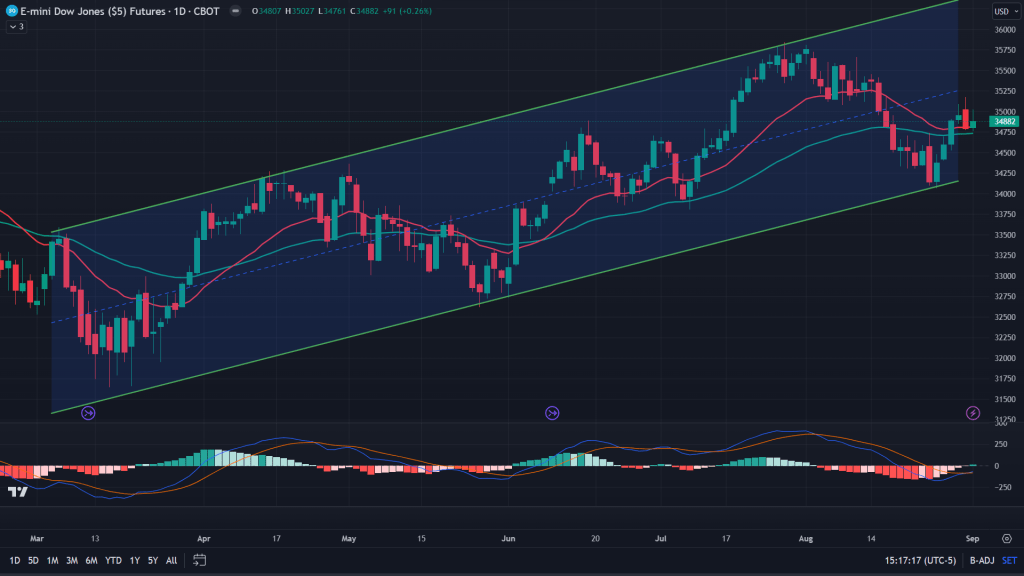
YM (Daily): When we move to the daily chart, the formation of inverted hammer adds folly to the burning fire for the bears to continue being bearish.
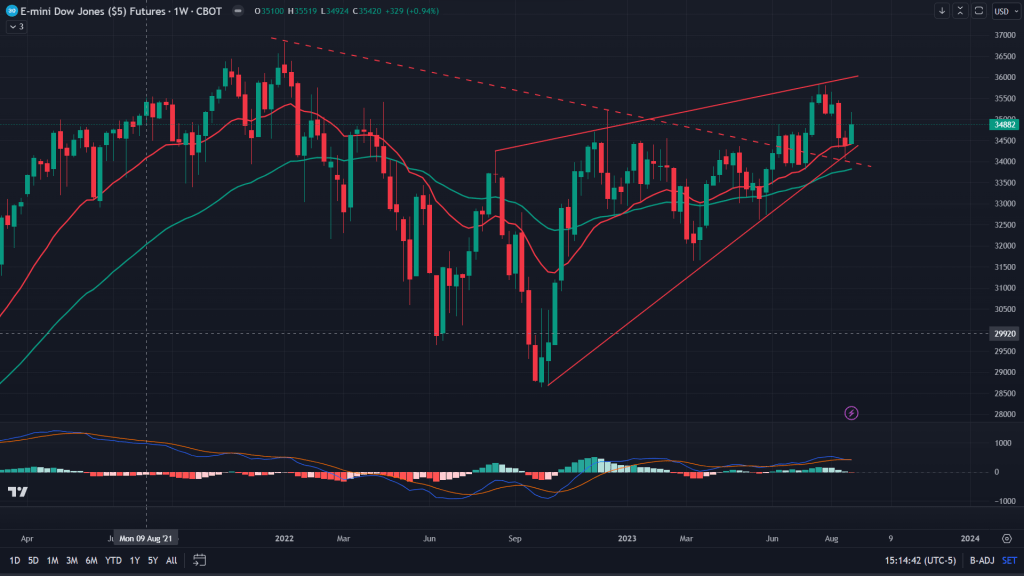
YM (Weekly): On the weekly though, it did bounce off the 20 weeks MA, this rising wedge is a sign of concern for the bulls. What’s going for them? Support in the form of trendline that it broke out of at the start of July. It can be said that the recent fall was a backtest of that trendline breakout. It’s a big tug-of-war for the industrial stocks’ bulls and the bears.
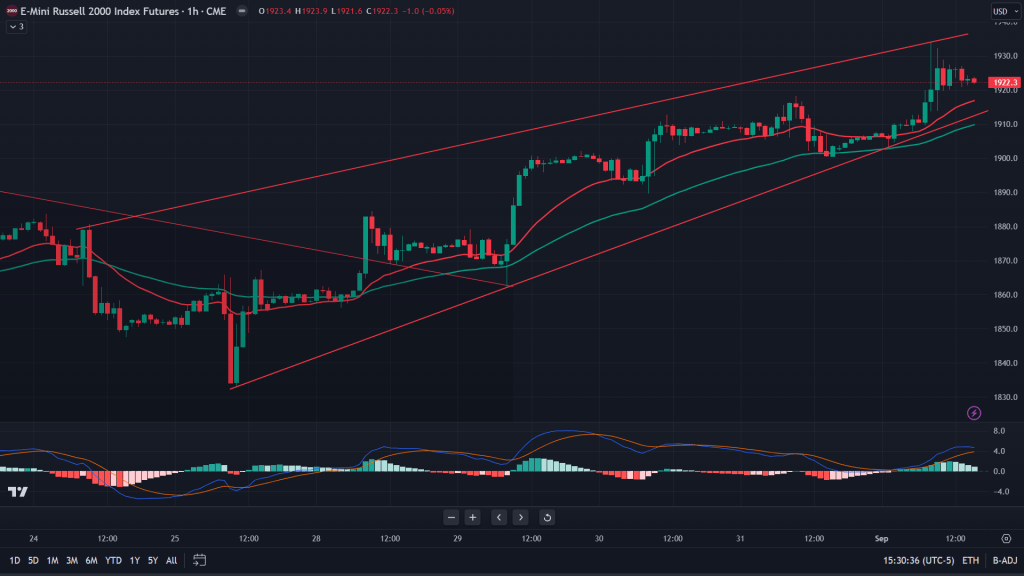
RTY (1H): Small caps, always late to the party but when the small caps signal a rally or a crash, you want to take a note. Even as ES and NQ have broken down of their rising wedges on the hourly, RTY is still waiting for its turn. You can’t be overtly bearish until RTY participates. But I wouldn’t hold my breath on doubting the breakdown.
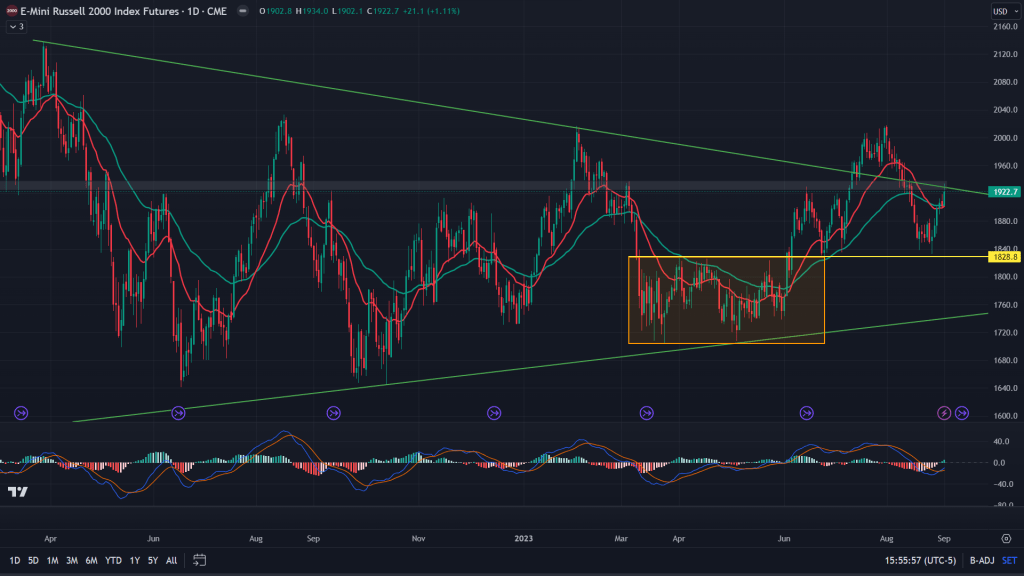
RTY (Daily): That failed breakout of the trendline has now been backtested. If that’s not enough, there is a supply zone that lingers overhead. If (and when) that 1H rising wedge breaks down, that would spell trouble for the bulls. But the bounce that we saw has enough strength for the bulls – it was the consolidation zone of March-June, which resulted into a powerful rally in RTY once it broke out.
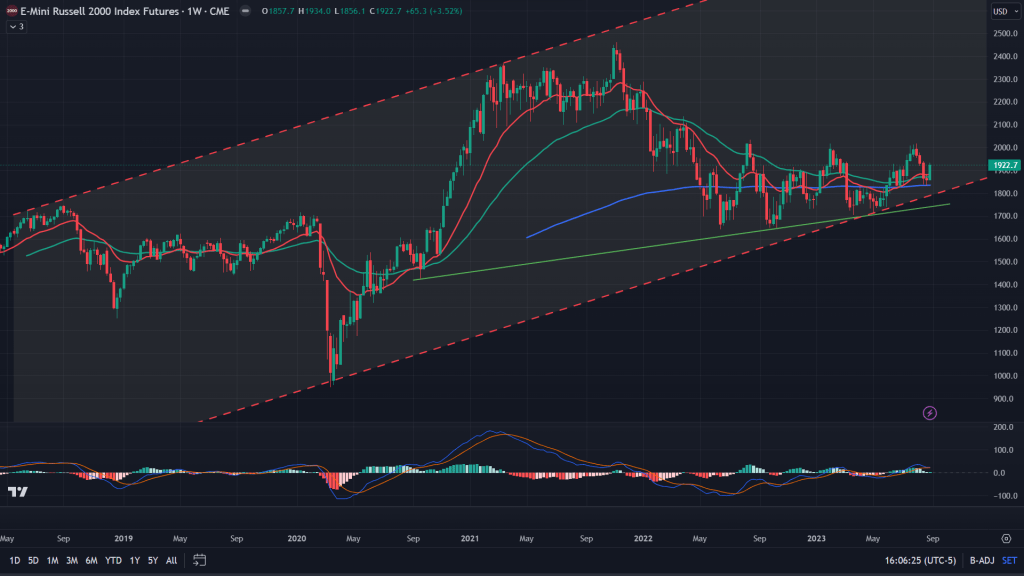
RTY (Weekly): Why we bounced last week? It was the trifecta of 20, 50 and 200 EMAs. Bears can’t easily get past that unless there is enough meat in the hands of the bears. Even if they get past those EMAs, there are two key supports too – support from the channel and trendline from Sept 2020 lows.
Conclusion: While lower time frames are all bearish, weeklies haven’t given conclusive bearish signals. So, if one is holding the shorts, or initiating a new one, ensure to get out of them quickly unless there is a confirmation to continue the bearish bets on the weekly charts.

Leave a comment