It has been quite some time since I last wrote about Indian stocks and quite a few things have happened since. So, lets take a quick deep dive into the Indian markets and what do we have in store. Starting with Nifty:
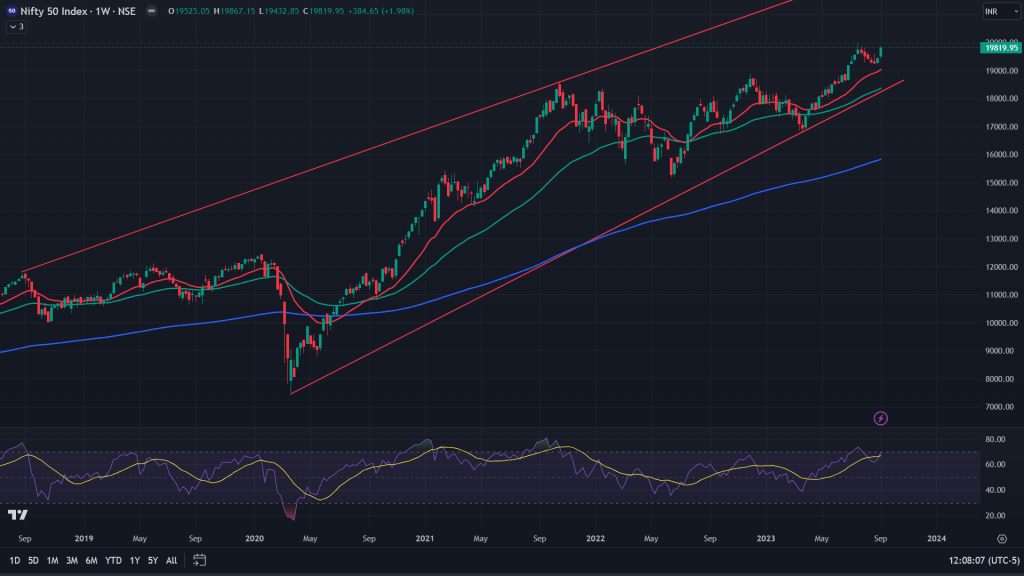
Nifty (Weekly Chart): For those unaware, a weekly chart represents one weak in each candle (red/green) and represents long term view of the market. Nifty has been forming a bearish rising wedge on the weekly chart. What does it mean? It means the ranges are getting narrower as and how it makes newer highs. After a point it stops making newer high closer to the upper end of the wedge and then breaks down below the lower end of the wedge. Once it breaks down, the downside is usually sharper and deeper. While, Nifty is on its course to new high, it is still far away to break down off this rising wedge. Bulls are safe as long as it is within this rising wedge. But for a near-term look, let’s take a look at the daily chart and see what that shows.
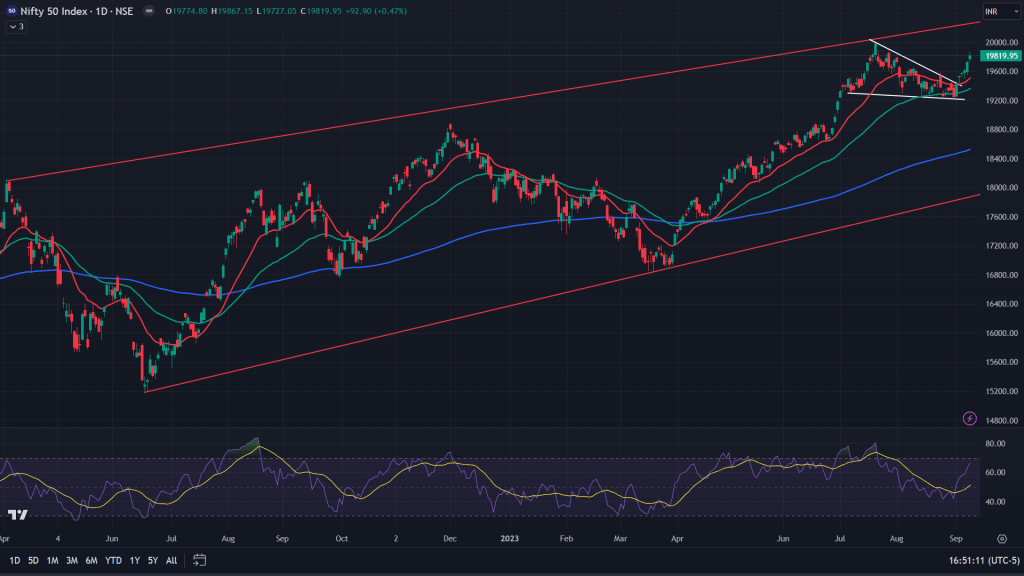
Nifty (Daily chart): Not just the weekly chart, but even daily chart of the Nifty has been forming a rising wedge (red lines). Although it is still far off from breakdown point and in near term it has given a breakout of a smaller falling wedge (white lines), which should be targeting new highs and probably towards higher end of the bigger rising wedge which would take it above 20,000.
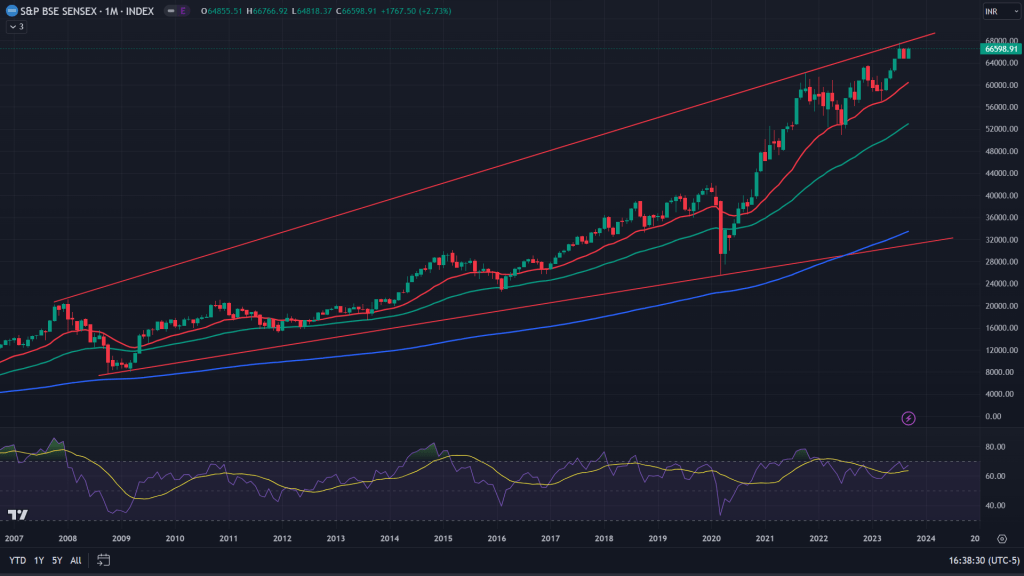
Sensex (Monthly Chart): Monthly chart of the Sensex has formed a megaphone – which is a very bearish sign and usually ends up connecting towards the lower end of the pattern from its upper end. But as I said, its a monthly chart, each candle would take one full month to complete and it is still months and probably years away before lower end of the megaphone is seen. One key point worth noting here though – While Sensex price has been making new highs, RSI has not been making any new highs – negative divergence and that is a sign to start getting out of the long positions. Let’s take a look at weekly and daily charts to get more closer view.
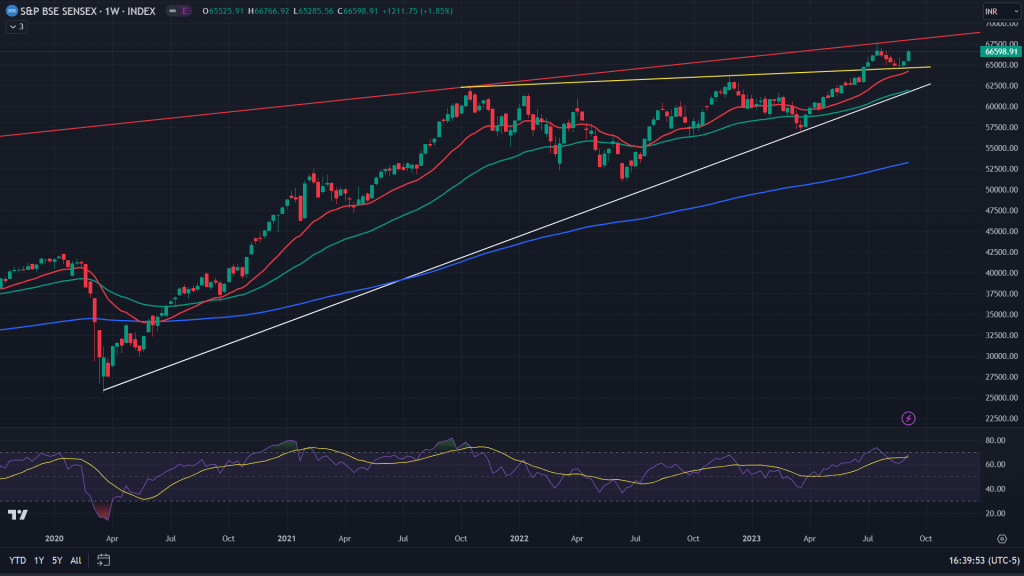
Sensex (Weekly chart): Sensex, just like Nifty, continued to consolidate below that yellow trendline for more than a year. Once it broke out, it reached towards upper end of that megaphone line and retraced towards the same yellow trendline – usually called as backtest, and now rallying again towards upper end of the megaphone. I would expect it to retrace again from there as RSI is diverged negatively here too on the weekly charts.
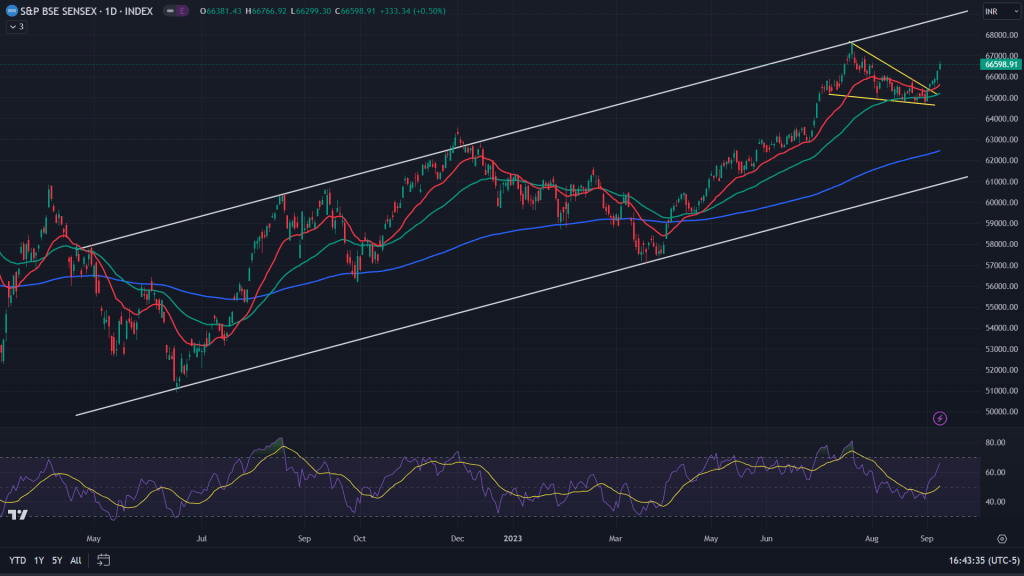
Sensex (Daily chart): On the daily chart, just like Nifty, even Sensex has broken out of a smaller falling wedge that resulted into the index closing in on the new high. Having said that, the price would be capped by the upper end of this white channel that has long been forming. 68,000 is where I would expect it to start retracing again. RSI diverged negatively here too.
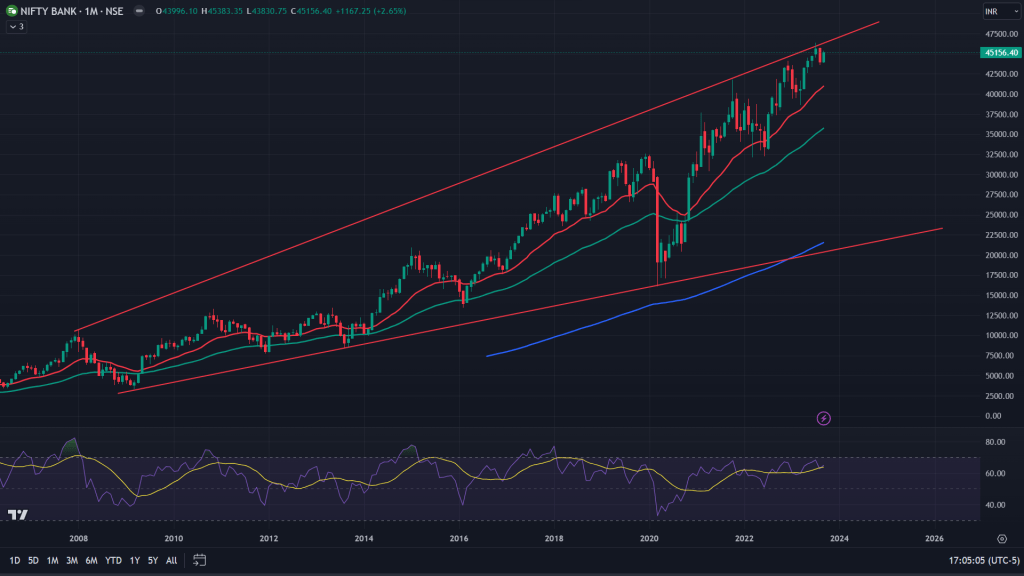
BankNifty (Monthly Chart): Similar to Sensex, even Banknifty has formed a megaphone on the monthly chart, which is a bearish sign. But since its a monthly chart, we can not conclude anything in the immediate term unless we see the weekly and the daily chart.
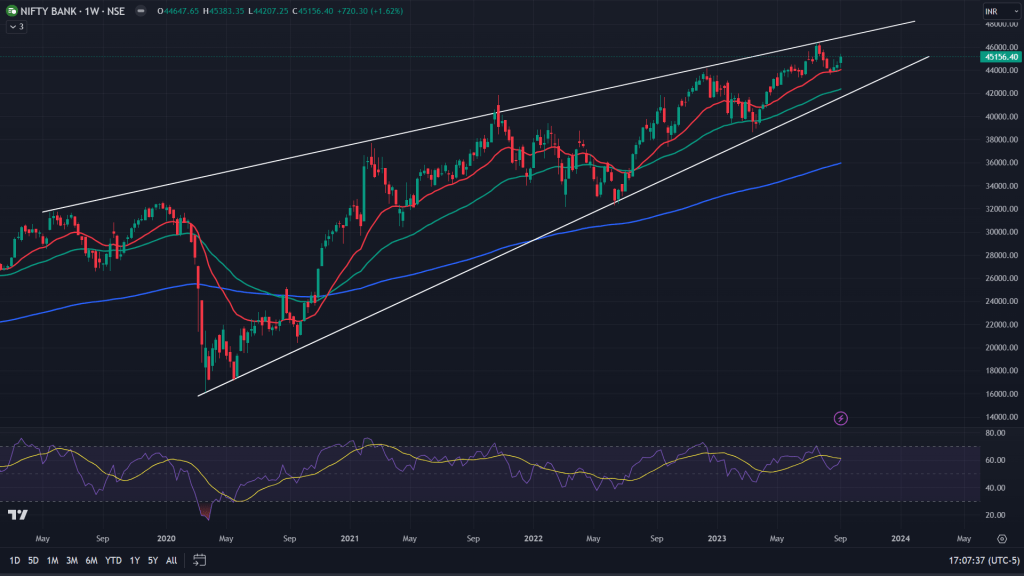
BankNifty (Weekly Chart): Weekly chart of the bank index is showing all the signs of topping out and I won’t be surprised if in the next 2-4 weeks we see a correction in banking stocks after attempting for a new high.
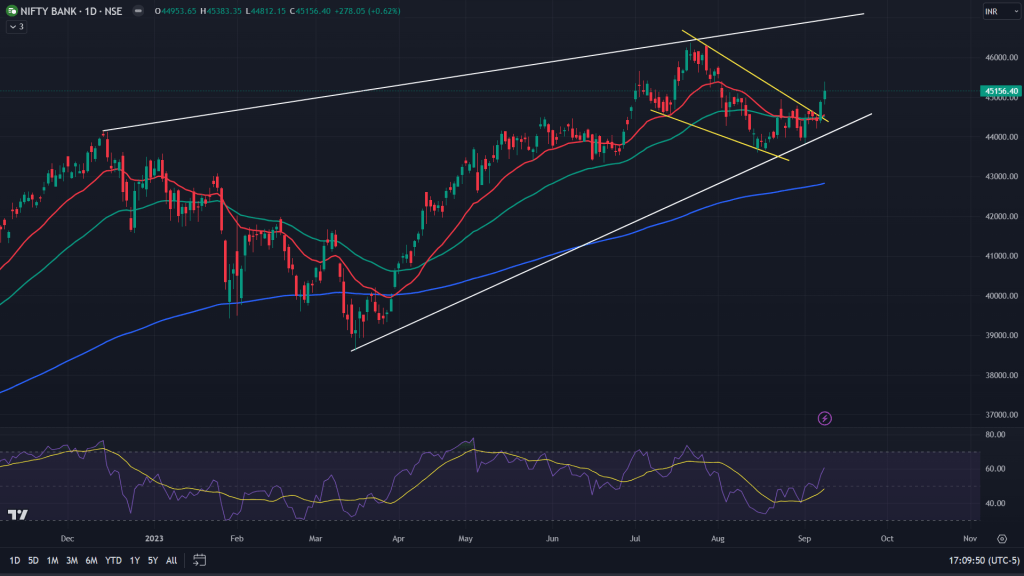
BankNifty (Daily Chart): On the daily chart, while there is a medium term rising wedge forming, there is also a short tern breakout that has happened which should target towards a new high after the backtest of the breakout. Backtest if key here.
Conclusion: Nifty as well as Sensex seems to be headed towards new highs (20,000 for Nifty and 68,000 for Sensex). I would trim my positions there before looking for a new direction as not just RSI but even MACD is diverged negatively on both the key indexes and thats a sign to get out of the long positions. While BankNifty is on the verge of a heading towards a bigger correction and I would use any opportunity to trim my longs in banking names.

Leave a comment