During my last post on Indian markets, I majorly focused on the key indexes. This post is all about key stocks that are showing some strength or weakness. Let’s take a quick dive in:
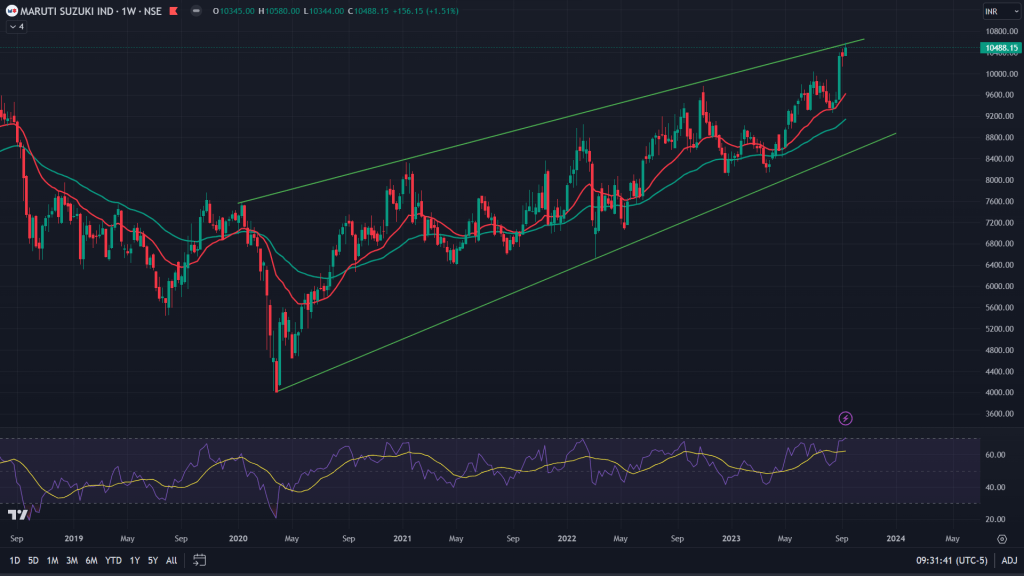
Maruti Suzuki (weekly chart): Maruti Suzuki, India’s largest automaker has been rallying ever since that covid low and has been forming a rising wedge – a pattern wherein the range of the stock price narrows as it moves up – a sign that the bulls are losing control as the stock moves up. The stock is currently sitting at the top end of this rising wedge and I would expect the stock to try and re-visit the lower end of the wedge again and probably break down. For now, lets focus on the lower end of the wedge as our possible target, which would be closer to 9,000 Rs.
Risk to this call: There have been many instances wherein a wedge turns into a channel. If this rising wedge also repeats the same pattern, then there is also a chance that upper range of this wedge would shift into the channel like formation. Although, I wouldn’t bet on this happening at the moment.
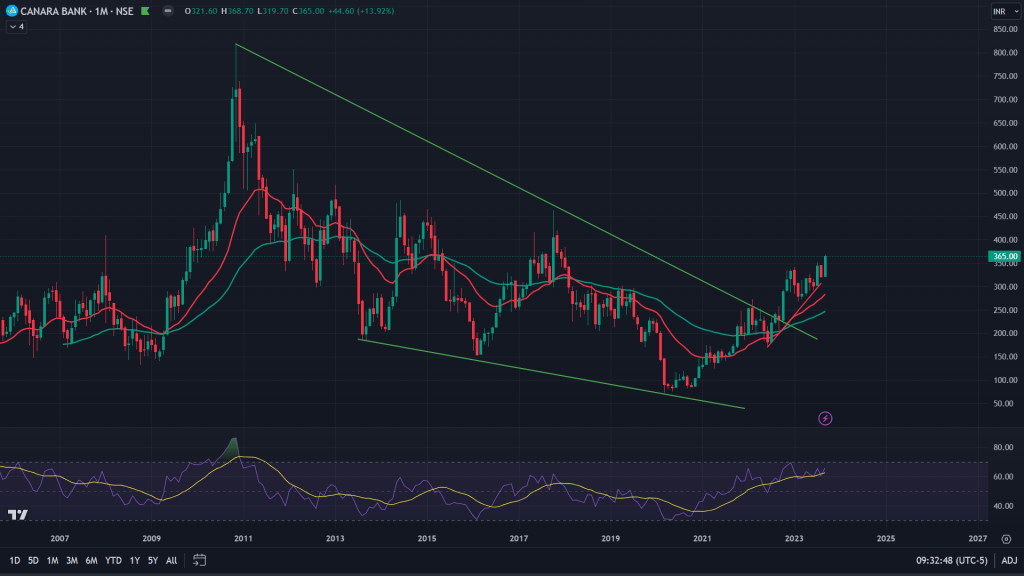
CanBank (Monthly chart): Canara Bank’s stock price is one to look forward to, especially when it has been rising after this monthly chart breakout of falling wedge. While the weekly chart of the stock shows there is a possibility of a pause after hitting 390, the monthly shows supply zone around 460.
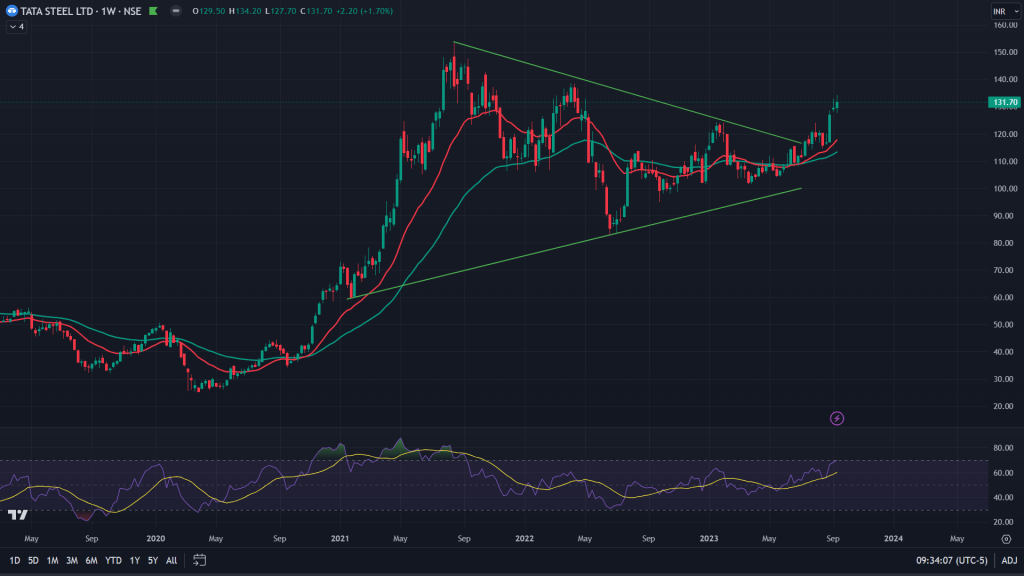
Tata Steel (Weekly chart): This chart is a brilliant example of a consolidation and breakout. In the immediate term, 138 and 142 are the key areas to watch. If it can sustain past these 2 key levels, then all time highs of 153 can be eyed for.
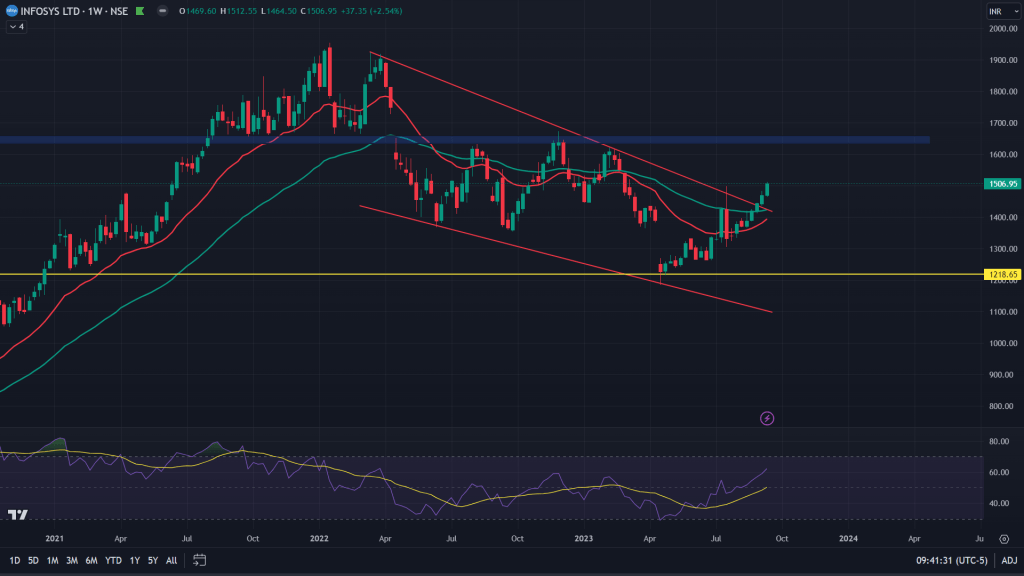
Infy (weekly chart): Another great example of a falling wedge breakout. Recent rally in the stock is driven by this breakout and I would expect the stock to head towards that supply zone of 1630-1660.
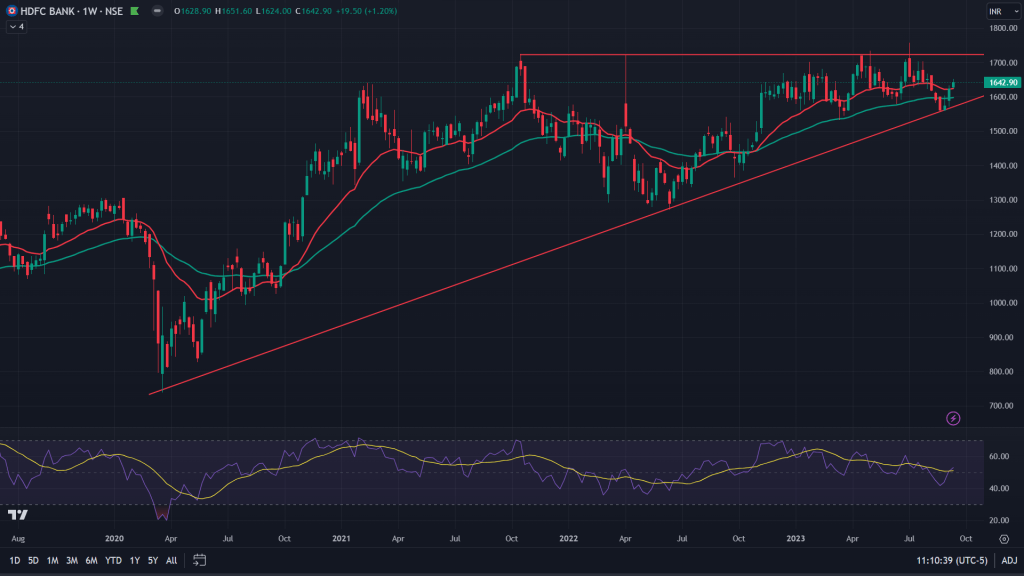
HDFC Bank (Weekly Chart): Darling of investors and traders alike, many have been frustrated with a lackluster performance of the stock over the past 2 years. Probably that time is about to end. I would expect the stock to head towards higher end of this ascending triangle for now, which is at 1720 and then try and attempt a breakout.
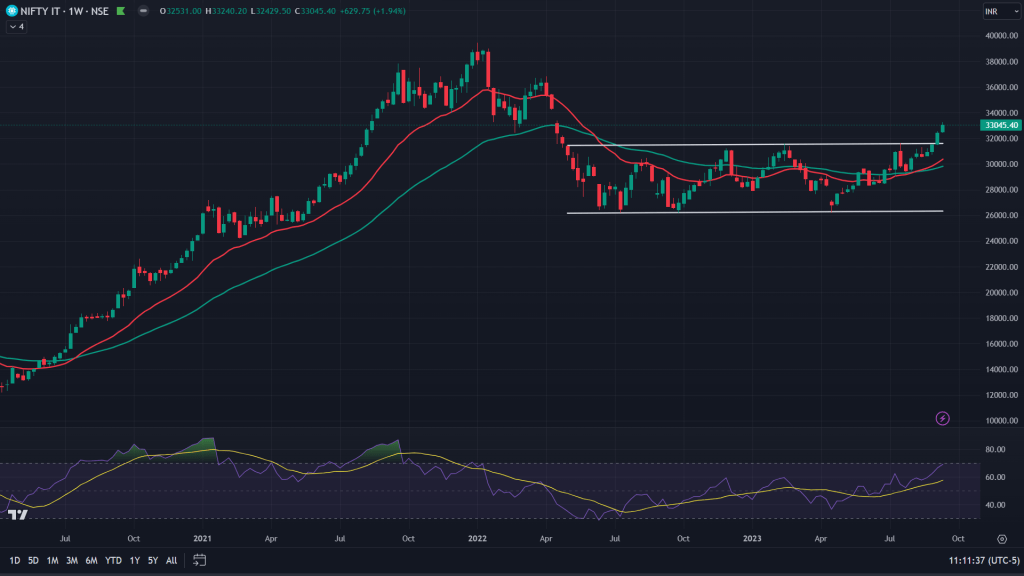
CNX IT (Weekly chart): CNX IT index has been consolidating for more than a year and has finally broken out to the upside. First step on the upside would be at 34,450, if manages to clear past that, then 36,770 should be seen.
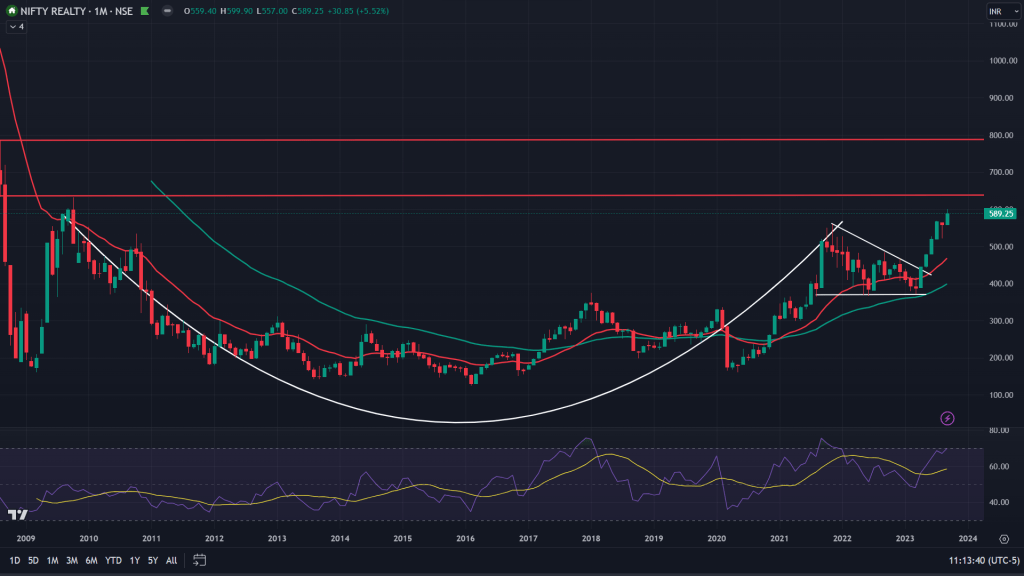
Nifty Realty (Monthly Chart): Clear text book example of a Cup and Handle breakout. While immediate target range would be at 633, I won’t be surprised if it heads towards the upper range of 780-90 as well. One key point worth mentioning though – This consolidation has been for more than a a decade and hence the breakout too won’t be shallow one. I would expect this rally in realty index to last longer and beyond those target rages.
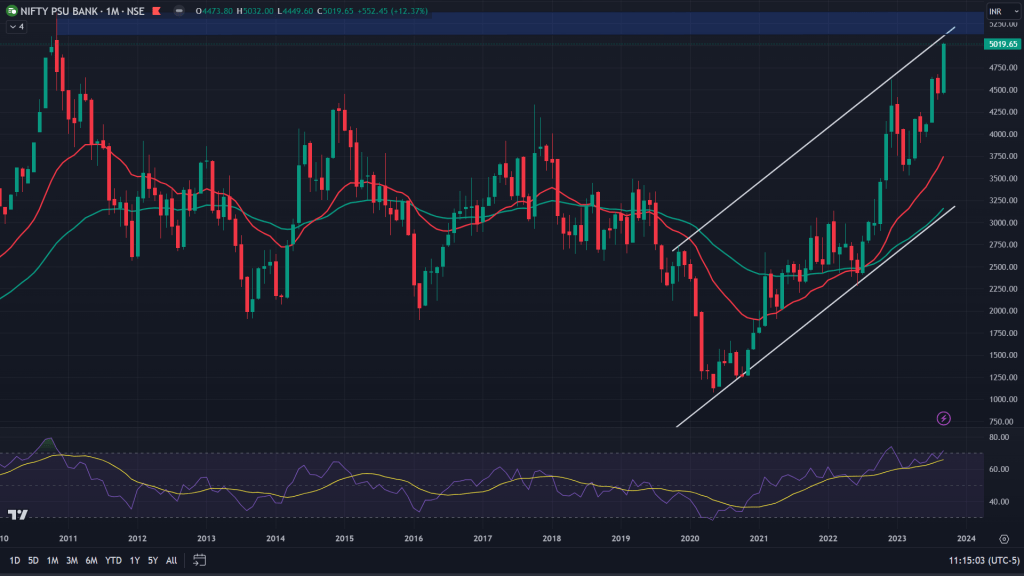
CNX PSU Banks (Monthly Chart) – Strong but risky (Monthly chart): While PSU Bank index is strong as of now, but I would be cautious to hold my long positions here as the index approaches all time high range 5375. I would book my longs there and wait for the price to settle down before taking a new position.
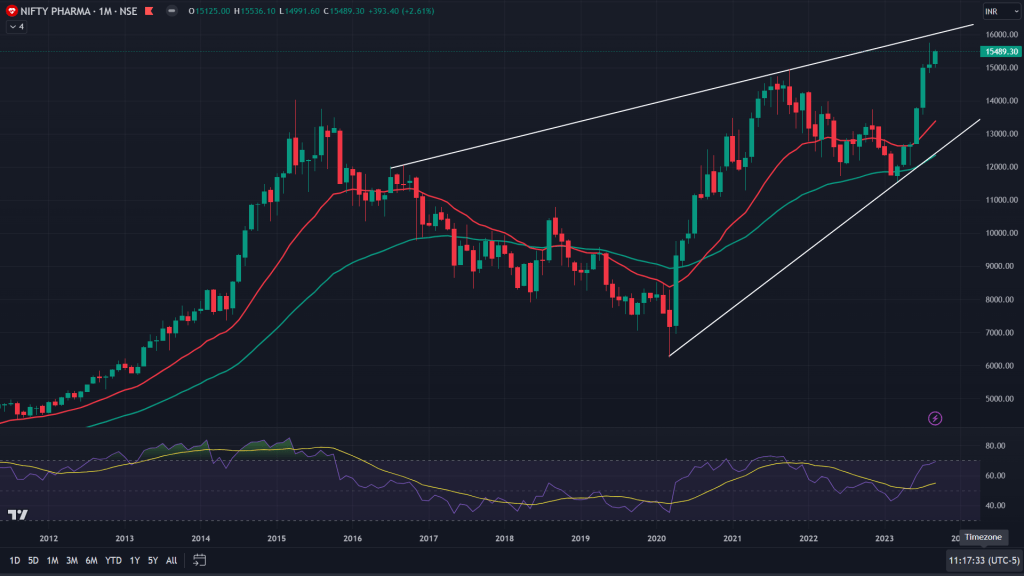
Nifty Pharma (Monthly Chart): Just like PSU Banks, even Pharma stocks have been quite strong for a long time, but a quick look at the chart tells me this rally is about to fizzle out as it reaches upper end of this rising wedge on the monthly chart.

Leave a comment