Hear me out – what do you do when you see that there’s a breakout and then you jumped right into it, it tip toed a bit and then kaboom! That’s what this week was all about, especially the last 2 days of the week. Major part of the week was choppy as it gets, before and after CPI data of Wednesday. Let’s take a deeper look at all that happened and what’s next?
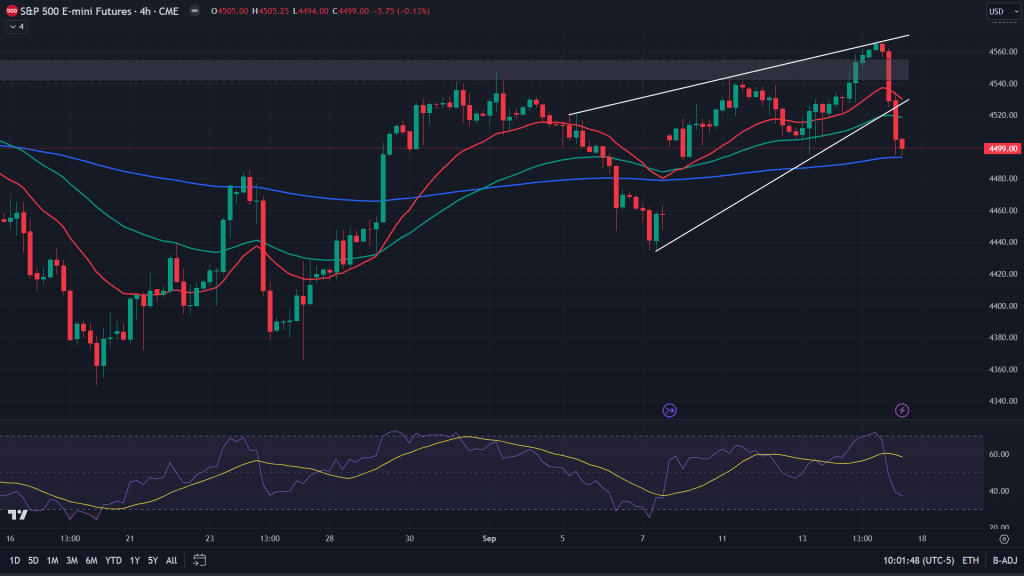
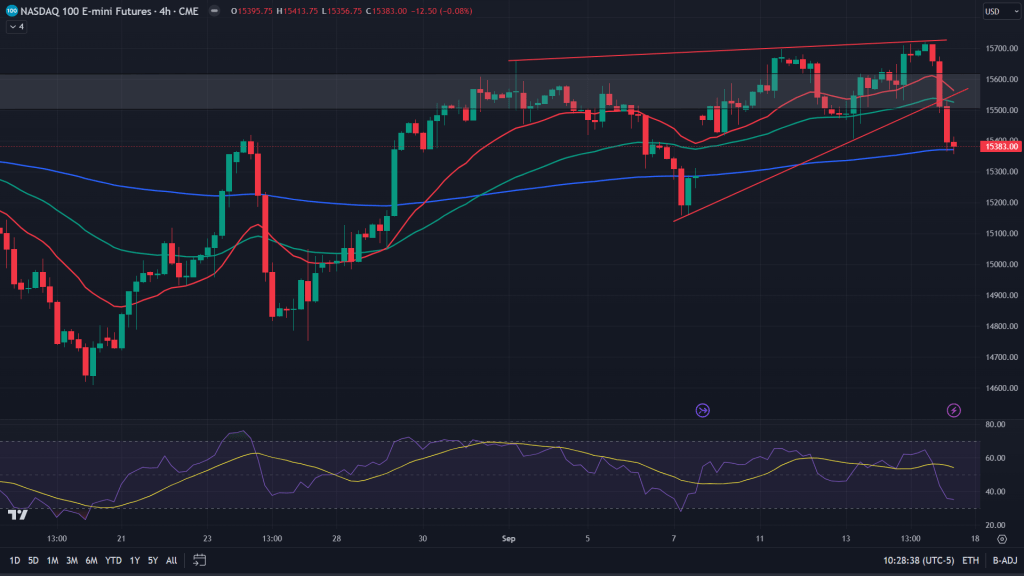
ES (4H): ES had this inverse H&S forming all through last couple weeks on the 4H charts, which indeed broke out on Thursday when futures opened after RTH. It pierced right into the 4H supply zone 4540-4555, by Friday morning it continued to pierce through and then by the time markets opened it had given up the supply zone breakout. If that wasn’t enough it continued to fall and the backtest (of inverse H&S) that was supposed to bounce, didn’t yield a bounce either. All it did was continued to sell. All day long. That’s just one part of the story – a breakout that failed.
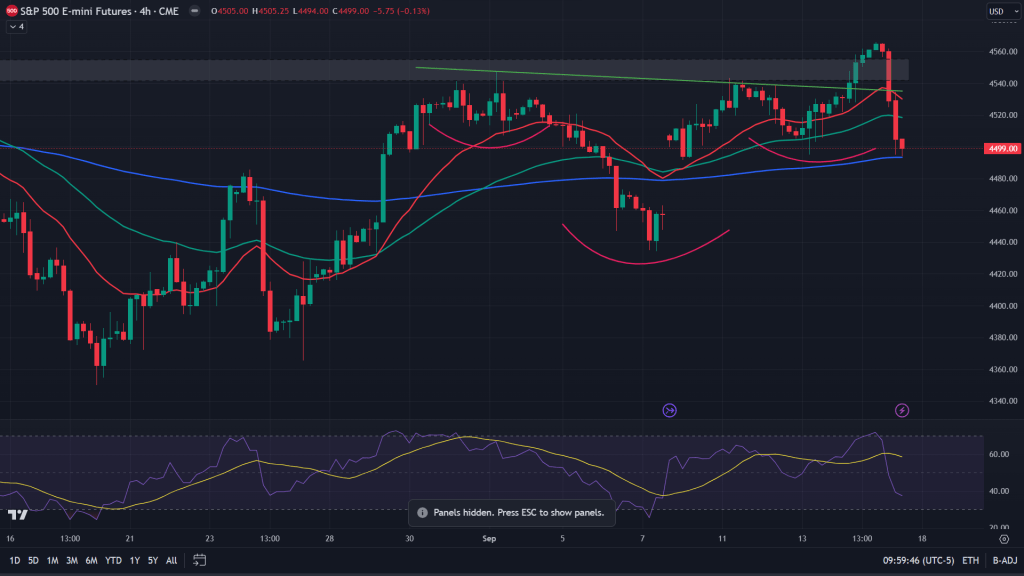
Failed breakout resulted in a breakdown: Another part of the story goes like this – That high after that supply zone crossover was exactly at upper end of the rising wedge on 4H chart. It was touch and go the very moment. The more it fell, the harder it got for the bulls to hold on and in the end – it was a breakdown of this very rising wedge.
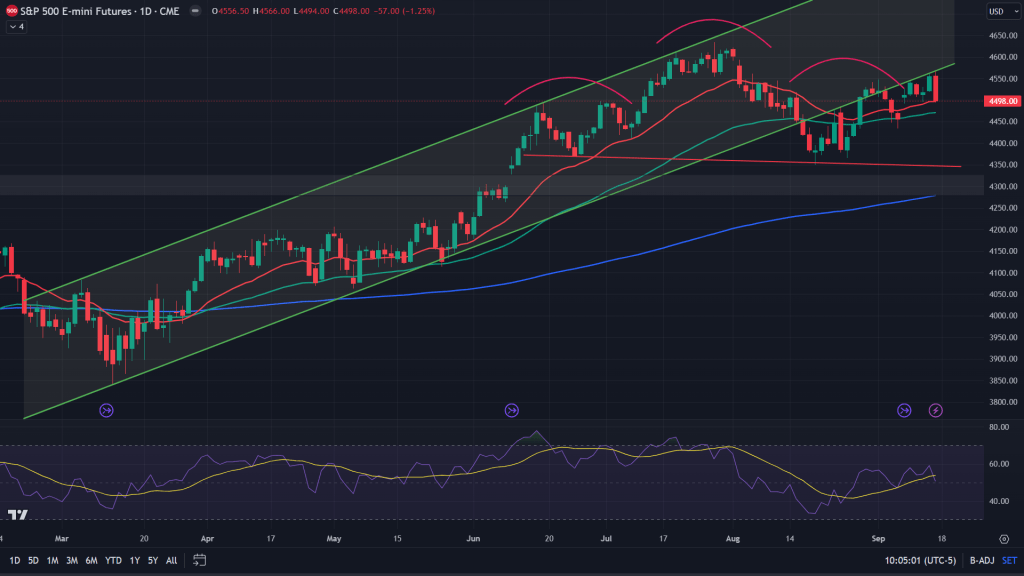
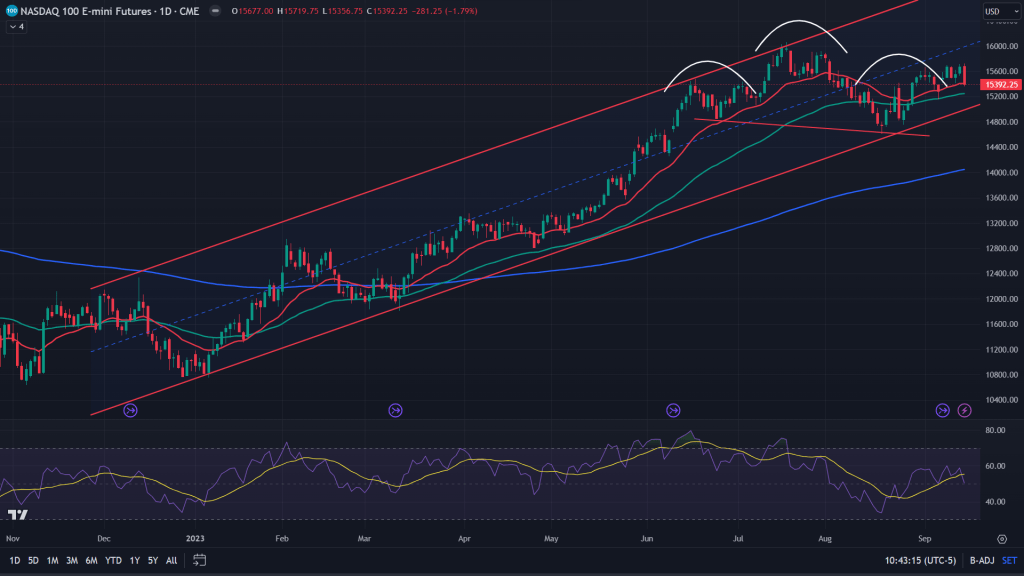
ES (Daily): When we zoom out into the daily chart, last whole week’s moves were all about an effort to enter the channel that it broke down few weeks ago. Then what happened today was a bearish engulfing candle close along with continuation of that bearish H&S that still hasn’t got invalidated.
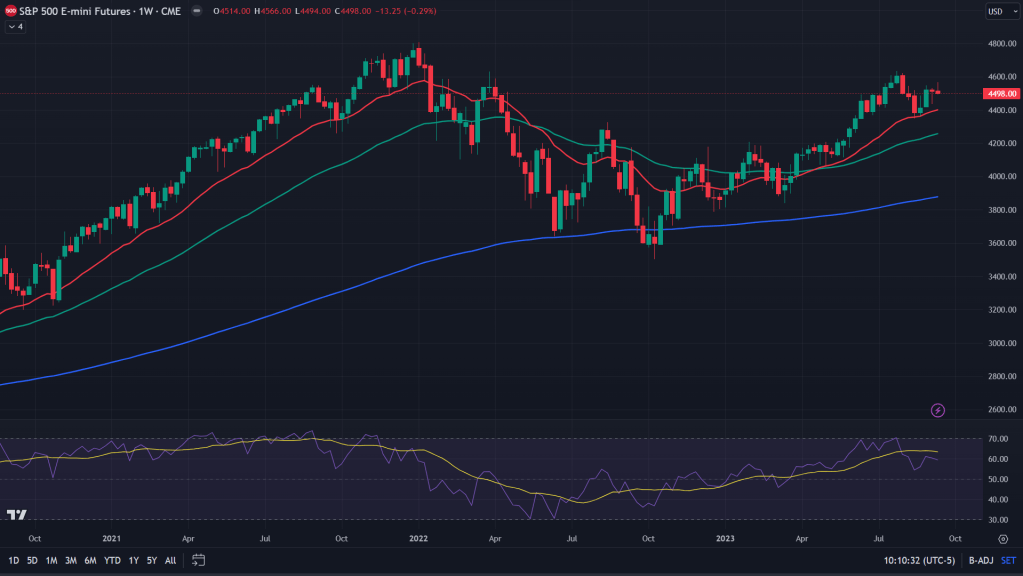
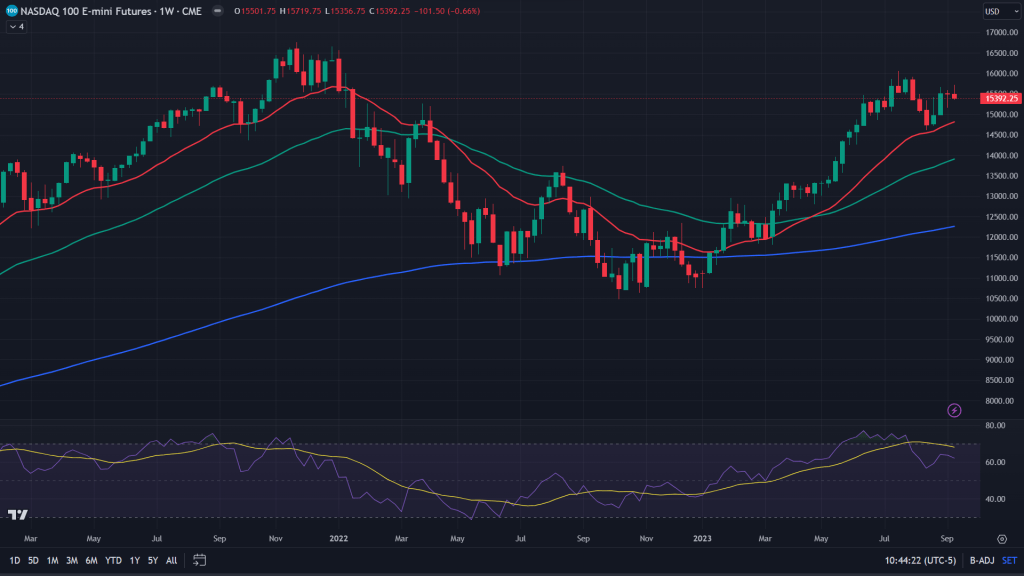
ES (Weekly): Zoom out further and what we get is a bearish inverted hammer candle on the weekly.
NQ 4H: Same story with the NQ too just slightly different.. it reached to the break out of that inverse H&S after piercing through the 4H supply zone but couldn’t really hold on and then the crash.
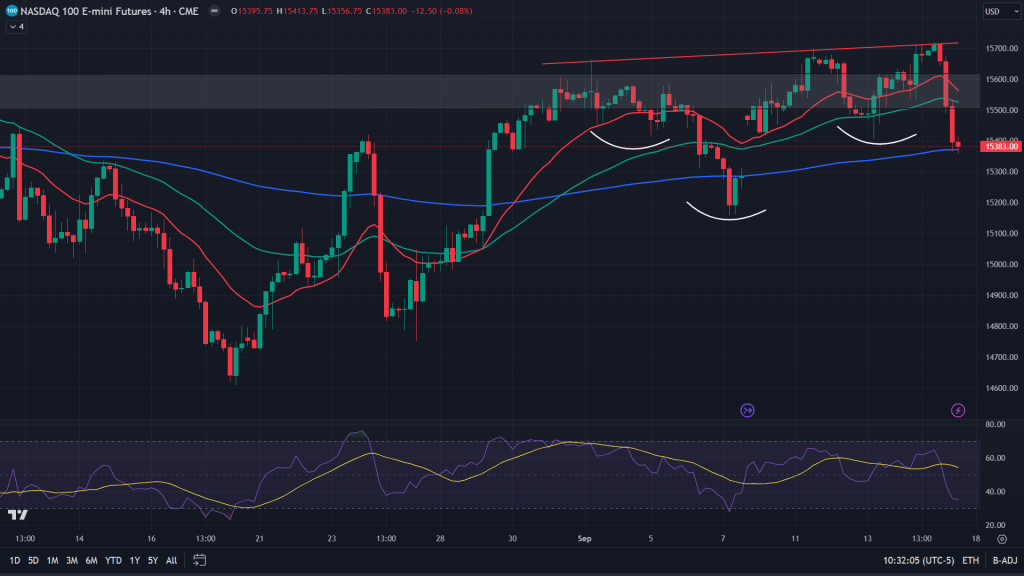
NQ (4H): That crash resulted into a rising wedge breakdown. Not healthy from any perspective.
NQ (Daily): What it does is, keeps H&S in play still and with bearish engulfing candle of the Friday, all possibility of further pain down the road just as it closes at 20EMA.
NQ (Weekly): Adding salt to the injury is inverted hammer candle close on the weekly.
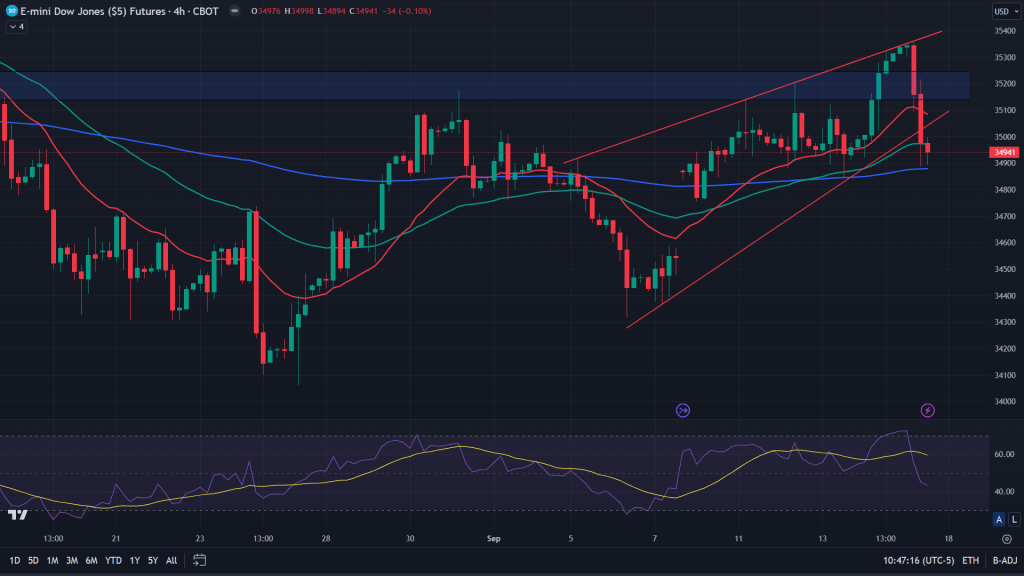
YM 4H: Same story rinse repeated here. Inverse H&S, broke out and crossed past the supply zone, only to give back all of that and some more!
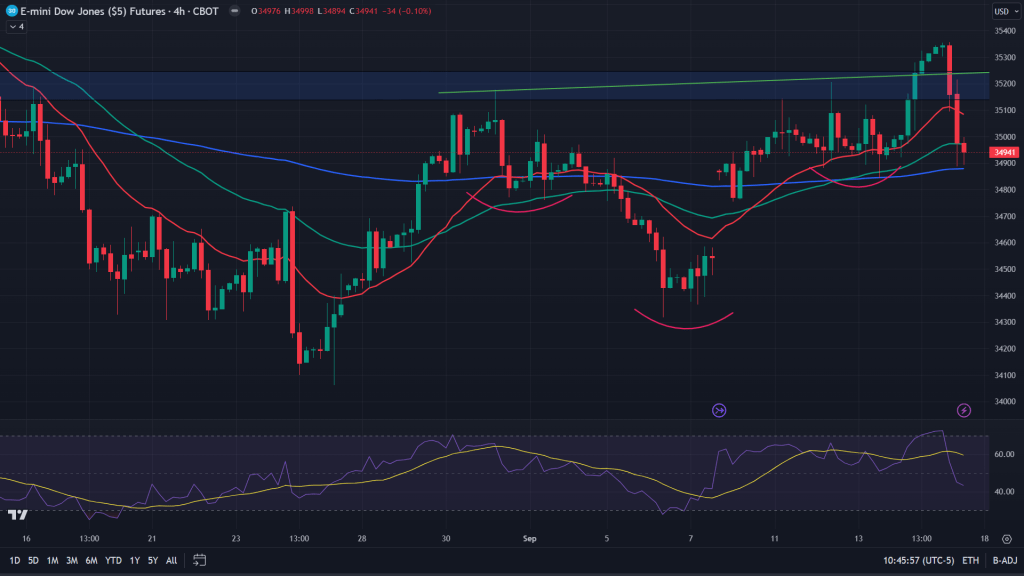
YM 4H: Resulting in a breakdown of that rising wedge.
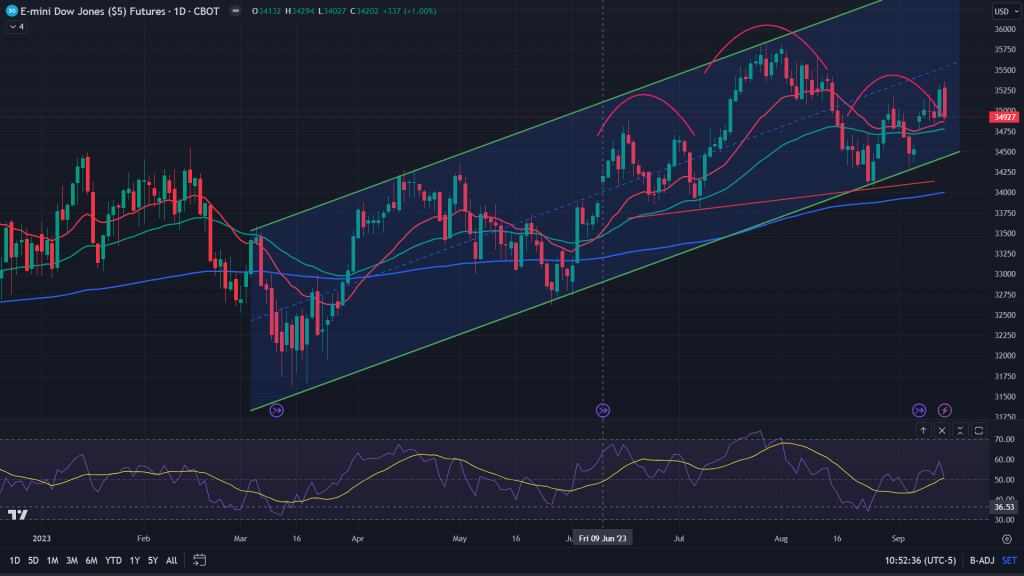
YM (Daily): That keeps alive the risk of H&S breakdown along with bearish engulfing candle close of the daily.
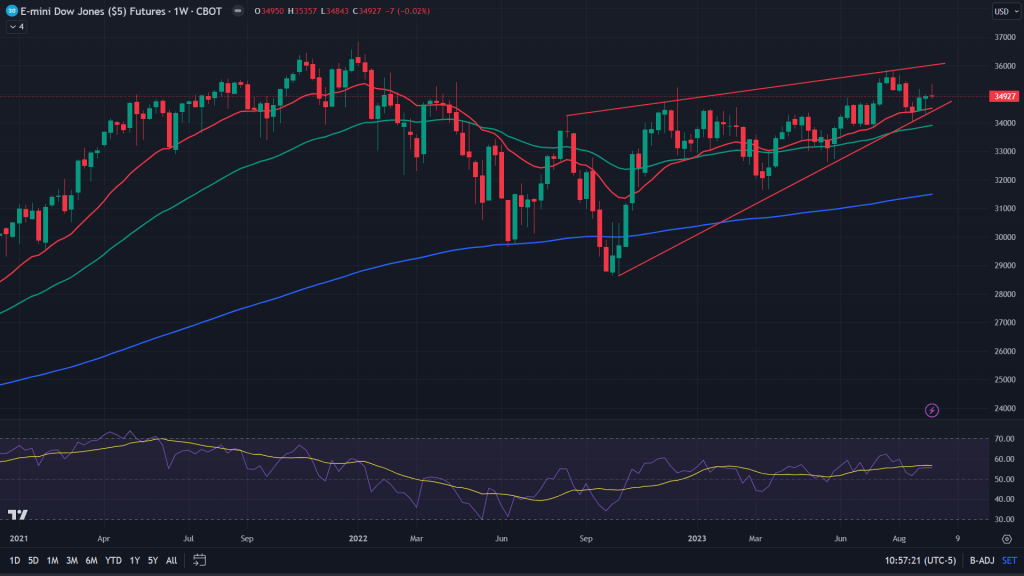
YM (Weekly): Go to the weekly chart and we see the possibility of weekly rising wedge breakdown even further accelerated as the weekly candle close on the YM was a bearish gravestone doji. Not at all a healthy picture from any angle.
RTY 4H: During the week, I had tweeted this tweet that talked about RTY being weakest link amongst all the indexes and you can clearly see why. While all the other indexes made inverted H&S and were giving bullish tone all through last 2 weeks, RTY barely managed to hold up. Rather what it did was formed another H&S on the 4H chart within that bigger H&S on the daily. I wouldn’t want to hold my longs on the smallcaps any more!
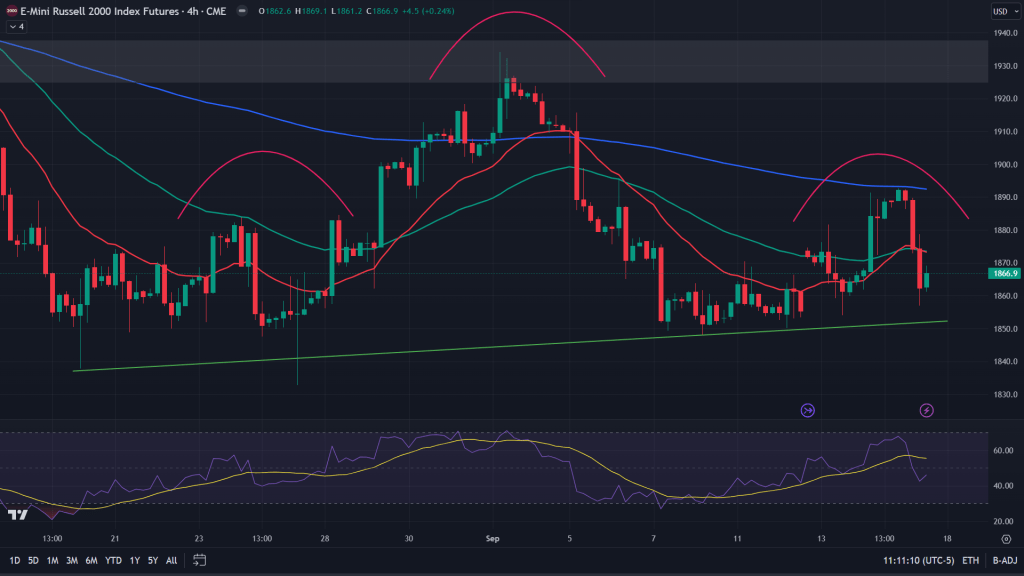
RTY (Daily): Yes here’s that H&S on the daily that hasn’t given up at all but has given up on 20, 50 and 200 EMAs.
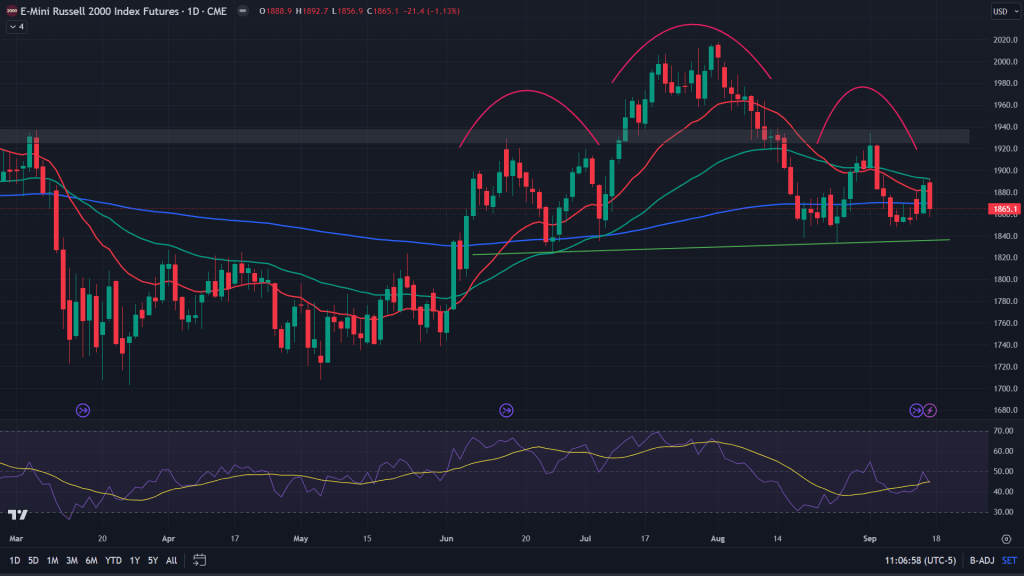
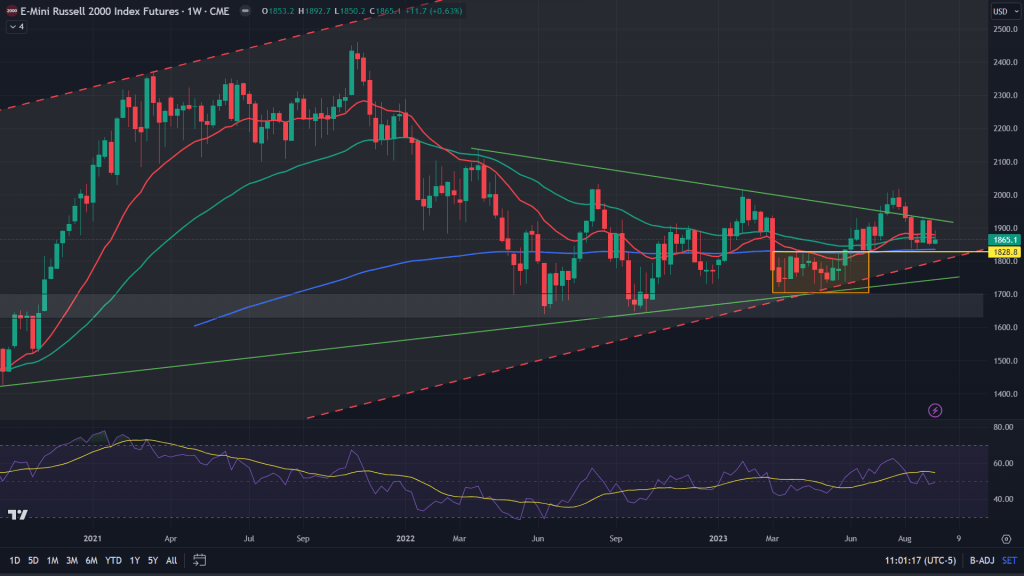
RTY (Weekly): If last week’s bearish engulfing candle wasn’t enough, what followed this week was the bearish inverted hammer. Tell me why should it be bullish?
Conclusion: FOMC next week! This is critical because it comes after last week’s CPI and recent gains in the energy prices. Add to that, what we saw on Friday and what the charts are showing, next week doesn’t look good from the bulls’ perspective. I would add some IWM puts to my kitty as small caps look way too weak and would add on to my existing YM shorts.

Leave a comment