Last couple of weeks have been quite an eventful ones for the bears. We have been prepared for it and have capitalised the bearish onslaught quite well. While the markets continue to be in the grip of bears, lets see if we have anything for the bulls in the coming week.
Since, many of my readers are retail traders who don’t know meaning of some of those terminologies that I often use, I’m writing certain legends for an easy explanation:
| Terminologies | Significance/Meaning |
| ES | S&P 500 Futures |
| NQ | Nasdaq 100 Futures |
| YM | Dow Jones Industrial Average Futures |
| RTY | Russell 2000 Index Futures |
| Bull Flag | Bullish: A downward sloping channel like formation that forms after a bull rally and ends up breaking to the upside. |
| Bear Flag | Bearish: An upward sloping channel like formation that forms after a bearish move and ends up breaking to the downside. |
| Rising wedge | Bearish: A formation of two lines that converge on the upside wherein the range between the two lines keeps getting narrower to the upside and then ends up breaking to the downside. |
| Falling wedge | Bullish: A formation of two lines that converge on the downside wherein the range between the two lines keeps getting narrower to the downside and then ends up breaking upwards. |
| Cup and Handle | Bullish: Cup and Handle as a formation is a bullish formation wherein for a long period of time, a stock/index forms a curvy formation wherein the right end where the cup ends, doesn’t rise beyond the left end of the cup. After which there is a channel/pendant/base like formation that consolidates for some time before finally breaking out to the upside. |
| Head & Shoulders (H&S) | Bearish: A formation wherein the two pivotal highs are slightly lower than the middle pivotal high. Those two lower pivotal highs also form a trendline support – known as neckline of the H&S, which eventually breaks down to the downside. |
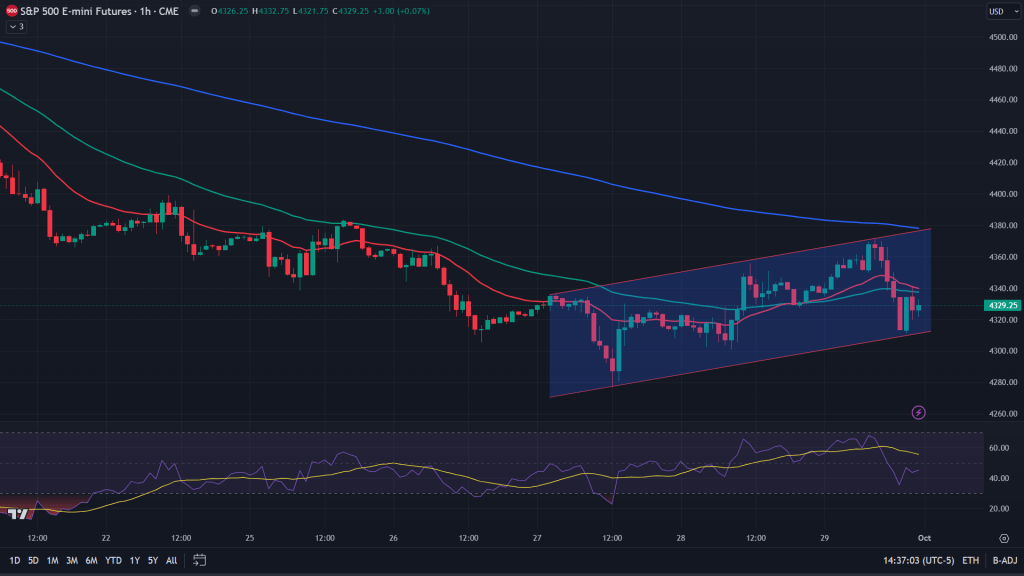
ES (1H): While ES continues to go down in a channel like formation on the daily chart, on Friday, it has formed a bear flag on the hourly chart which is on the verge of a breakdown.
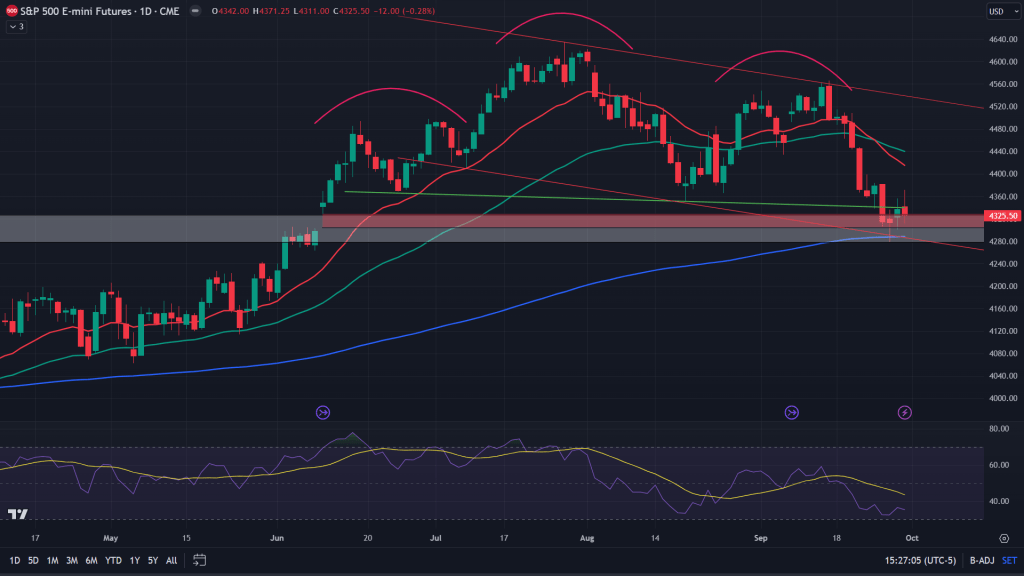
ES (Daily): That Head and Shoulders finally broke down, along with filling that unfilled gap that has long been there. While that gap (red horizontal area) has been filled, the bounce towards the end of the week has been driven by two key things – 200 days EMA and demand zone of 4280-4326.
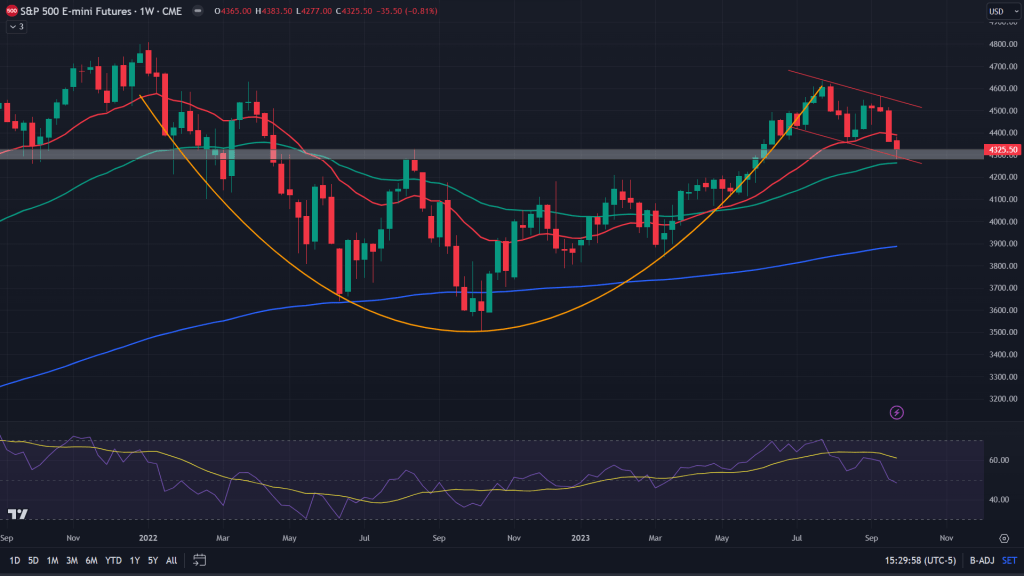
ES (Weekly): I had posted this chart last week on Twitter (See here), this is not my base case given the macro economic picture around us. Because this pattern is extremely bullish when it breaks out. For markets to be so bullish, the macroeconomic environment has to be supportive, which isn’t the case at this point. But, I wonder if macroeconomic developments have ever preceded such a rally? I doubt that has ever been the case. Keeping that in mind, I would still keep my eyes and ears on this chart and keep posting it until it is invalidated. For this chart to get invalidated, ES must close below its 50 weeks EMA, currently at 4263.
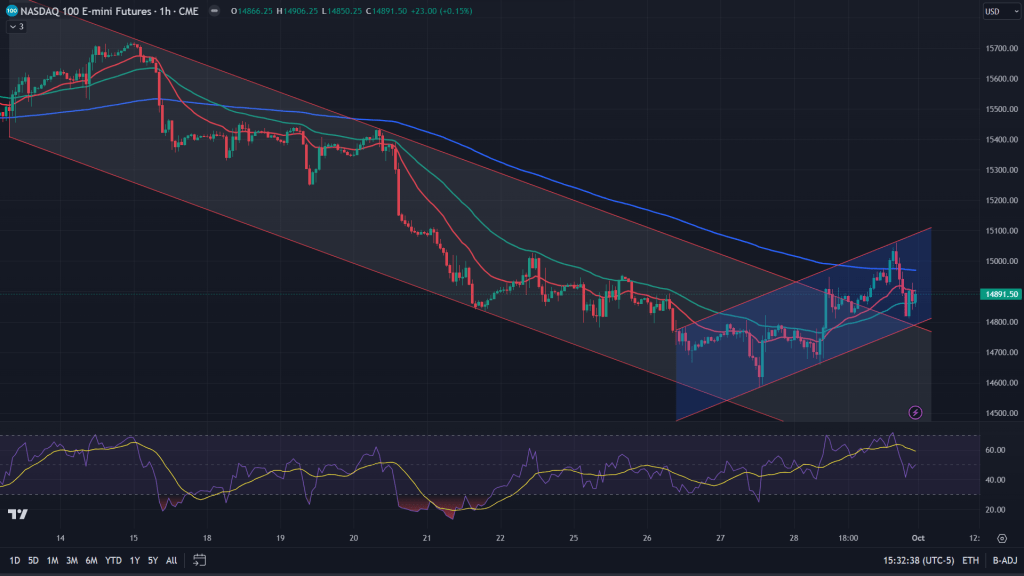
NQ (1H): While NQ has been falling in the channel, it broke out of this channel on Friday and backtested too. While doing that, it is forming a bear flag too. Remains to be seen if it continues to rally further up or comes back down.
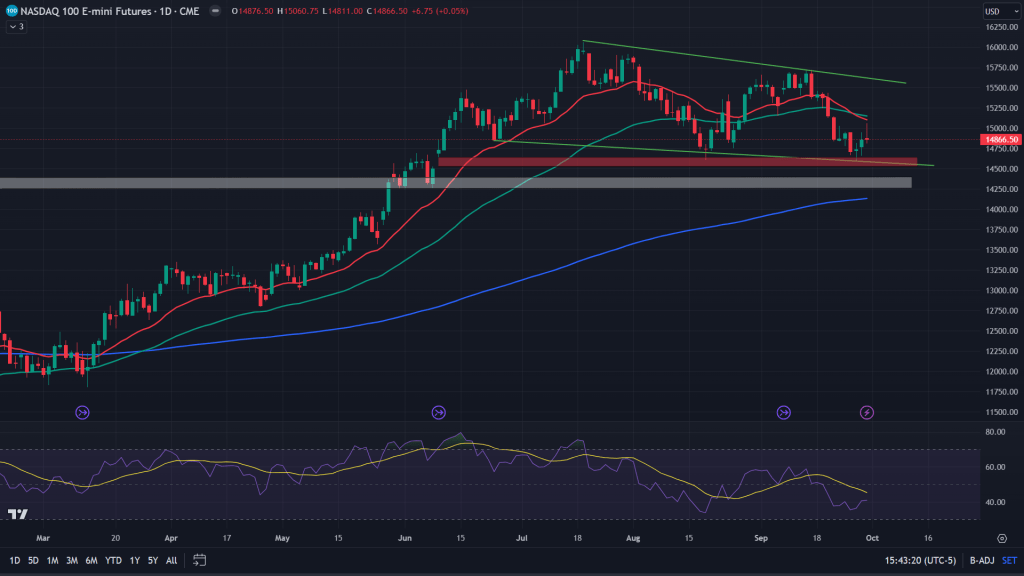
NQ (Daily): NQ too has this gap unfilled and has not yet fallen enough to fill it. The horizontal red area is where the gap is. Unsurprisingly, there is a demand zone right underneath between 14250-14400. For the bears, they can still rejoice as NQ retraced from 20 days EMA and formed a bearish gravestone doji formation.
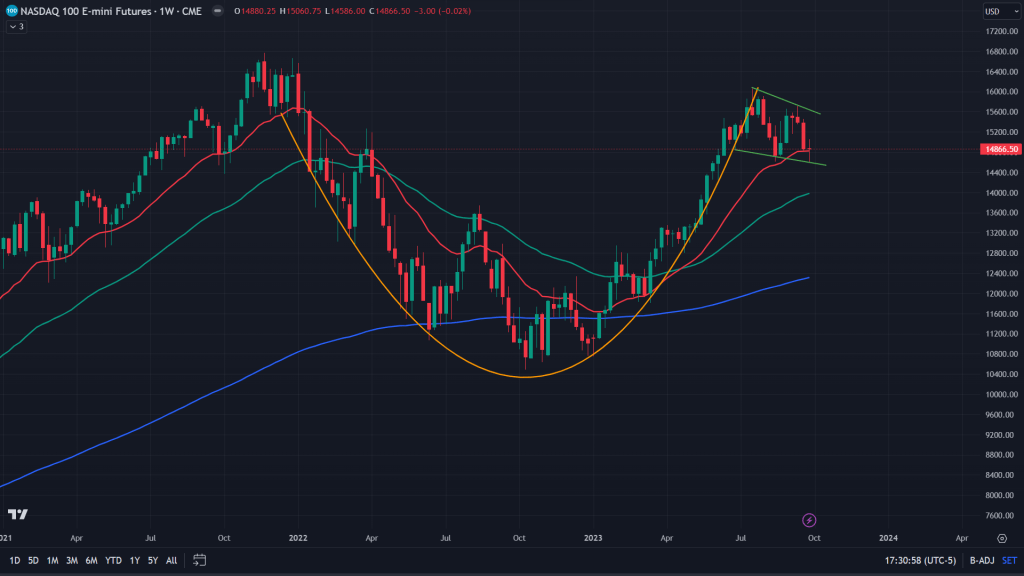
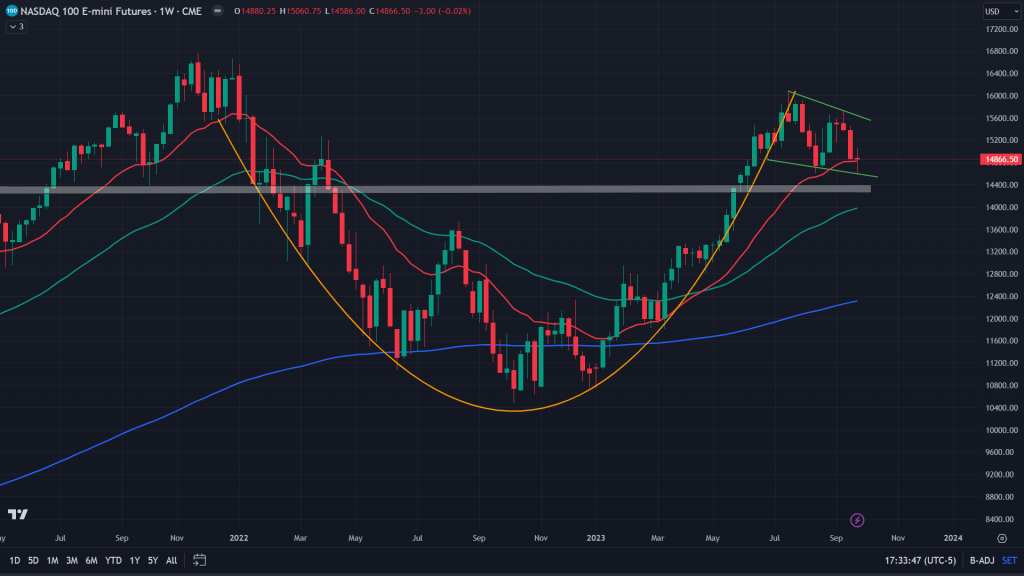
NQ (Weekly): If it was just ES, I would have taken it lightly, but even NQ has formed pretty similar bullish cup and handle formation wherein we’re in the handle formation that take a few weeks to complete and break out. This pattern would get invalidated if it breaks past the demand zone mentioned above.
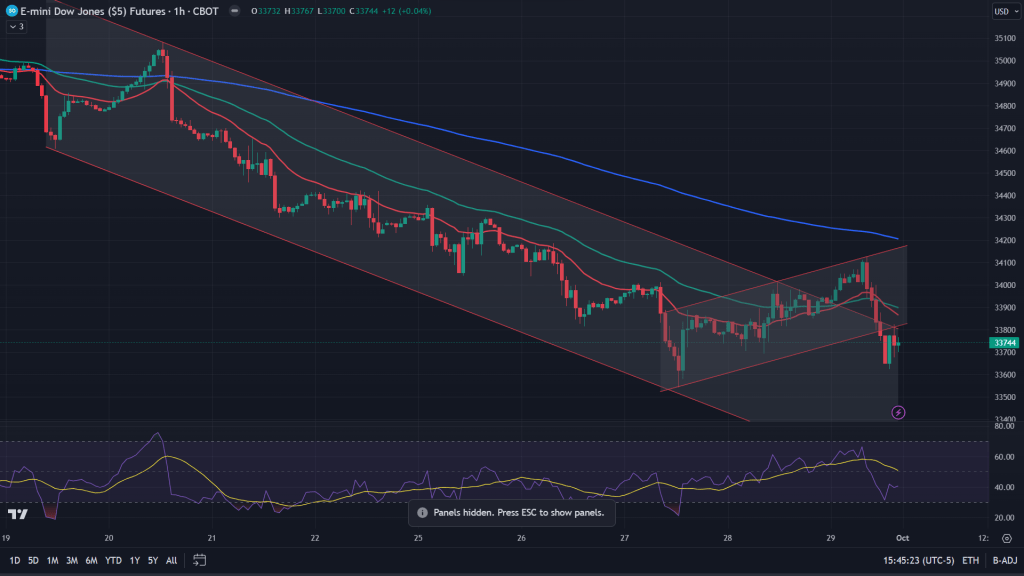
YM (1H): Just like the ES, NQ, even YM has been falling in a channel that it broke out of. Only to fail again and go inside that very channel. Because the breakout occurred within a bear flag that broke down!
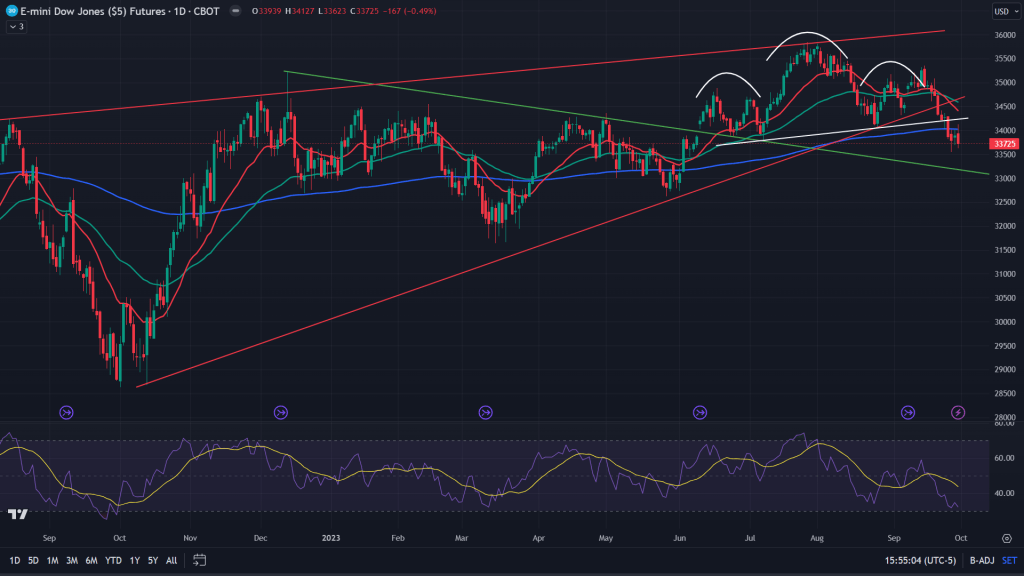
YM (Daily): Head & Shoulders (white) – Broke down! Rising wedge (red) – Broke down! 200 days EMA – Broke down! One wonders how can that ever be bullish? The only simmering hope for the bulls is a trendline support (green line), currently based at 33,000 – psychologically important level to keep an eye on!
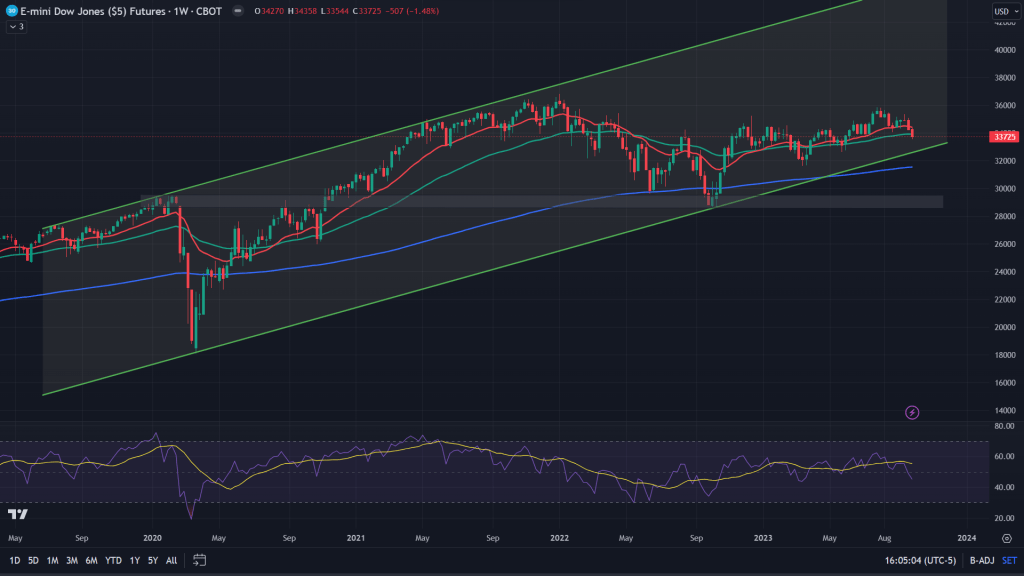
YM (Weekly): YM has been trading inside this weekly channel for a very long time (from covid lows), which seems to be on the verge of a breakdown now, especially when it has given up on the 50 weeks MA already after giving up on 20 weeks EMA in the previous week.
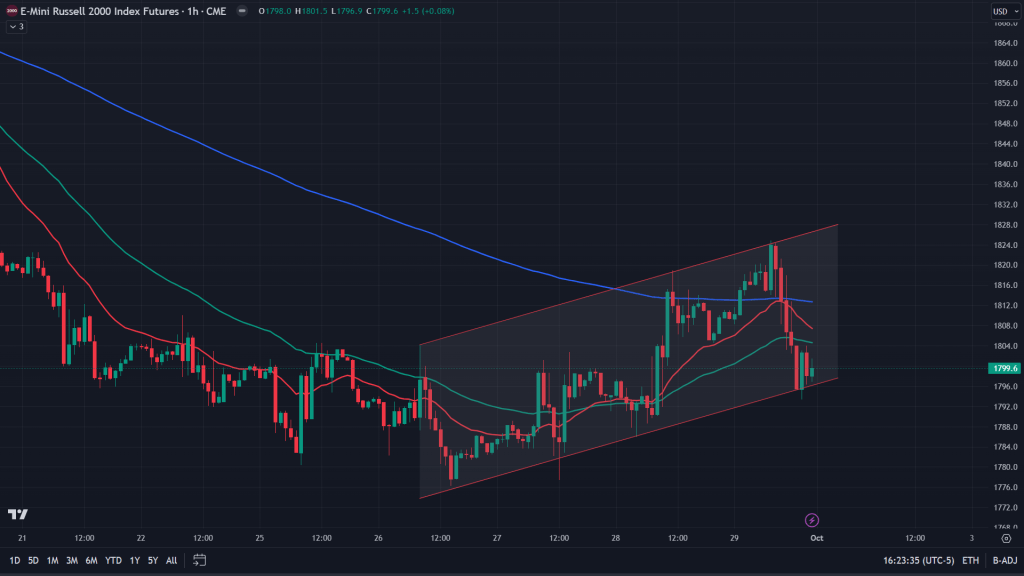
RTY (1H): RTY has been forming a bear flag on the hourly, just like all the other key index futures. It seems on the verge of a breakdown.
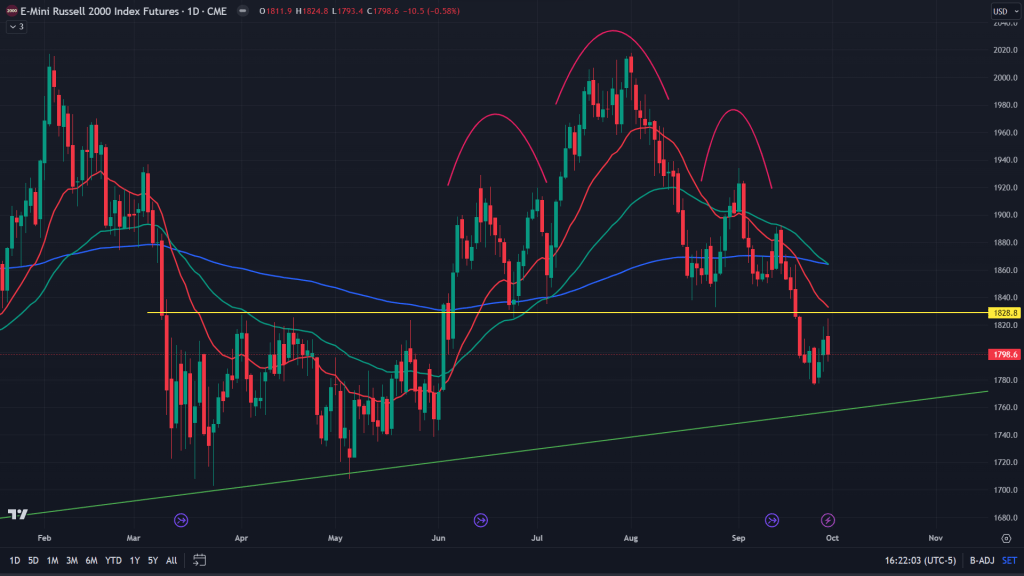
RTY (Daily): That H&S breakdown of last week has now also been backtested. Not just the H&S backtest, but also the first mean reversion of the 20 weeks’ MA is done with. Now headed for another key test – the green trendline that has been holding all through last year.
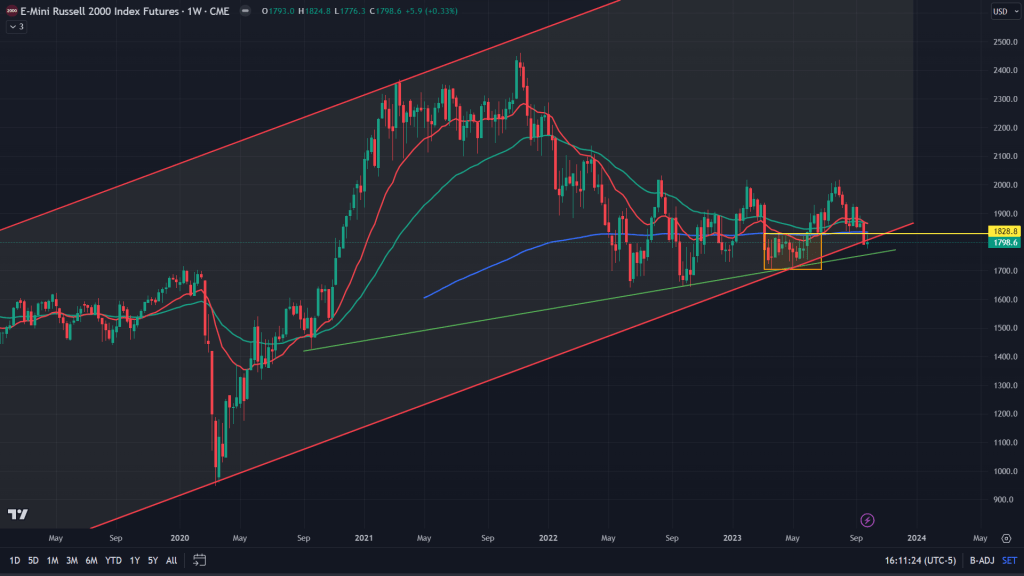
RTY (Weekly): If that was bearish, weekly is even more bearish with the breakdown of this key channel that has been forming since the covid lows. Icing on the cake for the bears? Closed below 200 weeks EMA for the second consecutive week!
Conclusion: While ES and NQ are not much bearish, YM and RTY has nothing going for the bulls. I would continue to short RTY and YM as long as they don’t react to any critical support zone or a trendline.
Weekly video update:

Leave a comment