So much money has been lost in timing the market. So much money has not been made, by trying get into the trap of predicting what’s going to happen next? While technical analysis does help in deciphering what is likely to happen, it never tells you exactly this is what is going to happen and hence when you read these posts and read through the chart, always assign a probability of what may happen and not what should happen.
Keeping that in mind, let’s try and assess what are the charts telling us today:
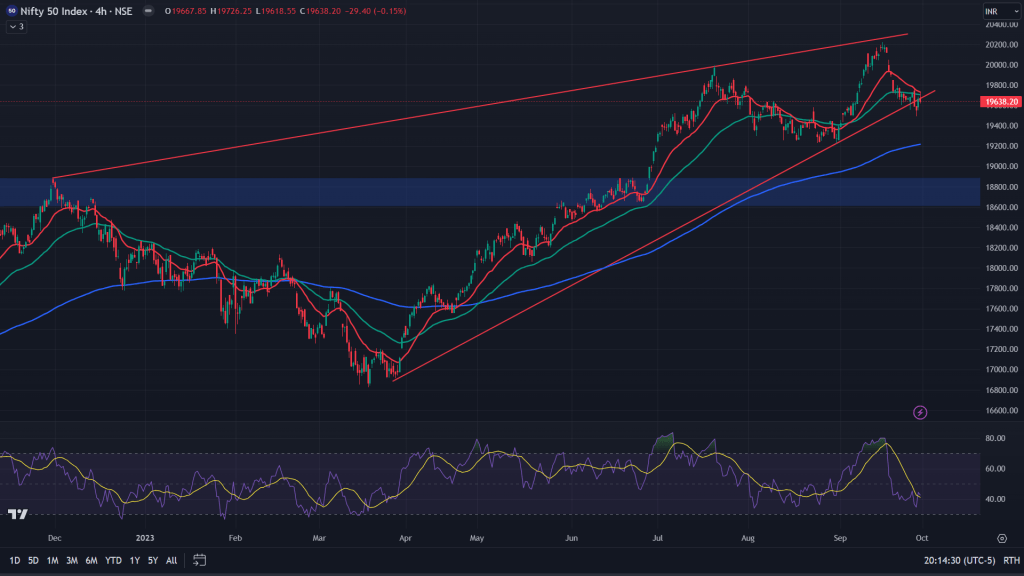
Nifty (4H): What you see here, is almost breakdown of the rising wedge on the 4H chart. While it is still close to the lower end of the wedge, it gives some hopes for the bulls to try and recover. If it continues on this path, one can expect Nifty to head towards 18900-19200.
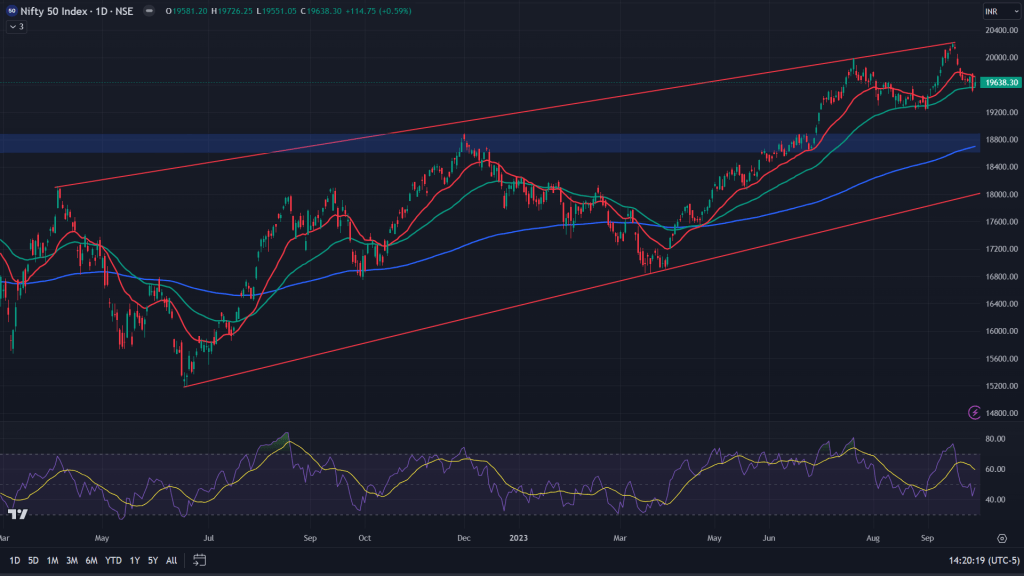
Nifty (Daily): When we zoom out to the daily chart, what we get is flirtation between 20-50 EMAs and the candle of Friday was an inside bar after a big red candle on Thursday, indicating bearish continuation the next day.
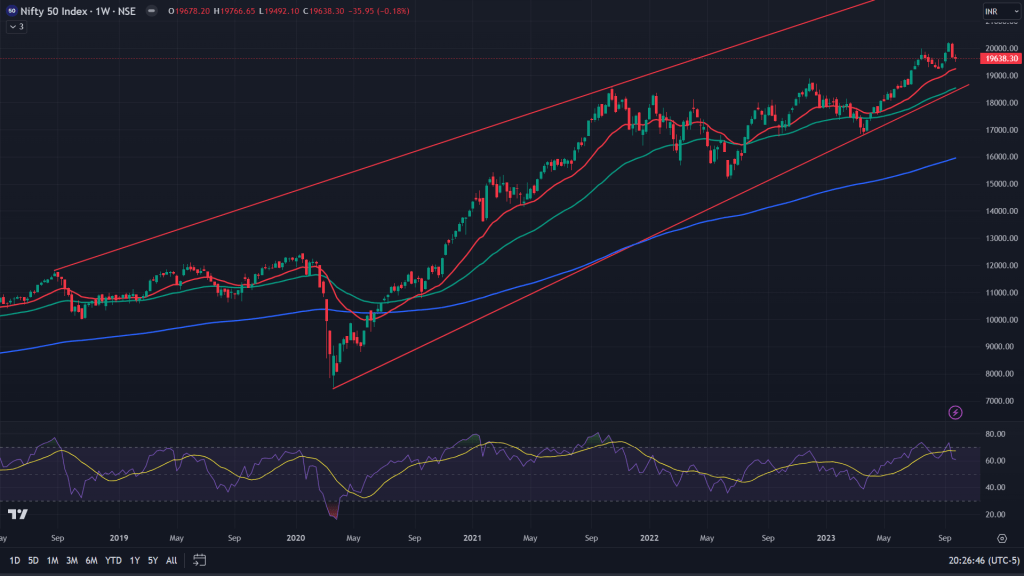
Nifty (Weekly): Nothing else to write home about on the weekly chart, apart from the fact that the candle of the last week was almost like a doji – indication of indecisiveness. Not a healthy sign after a big red weekly close in the previous week.
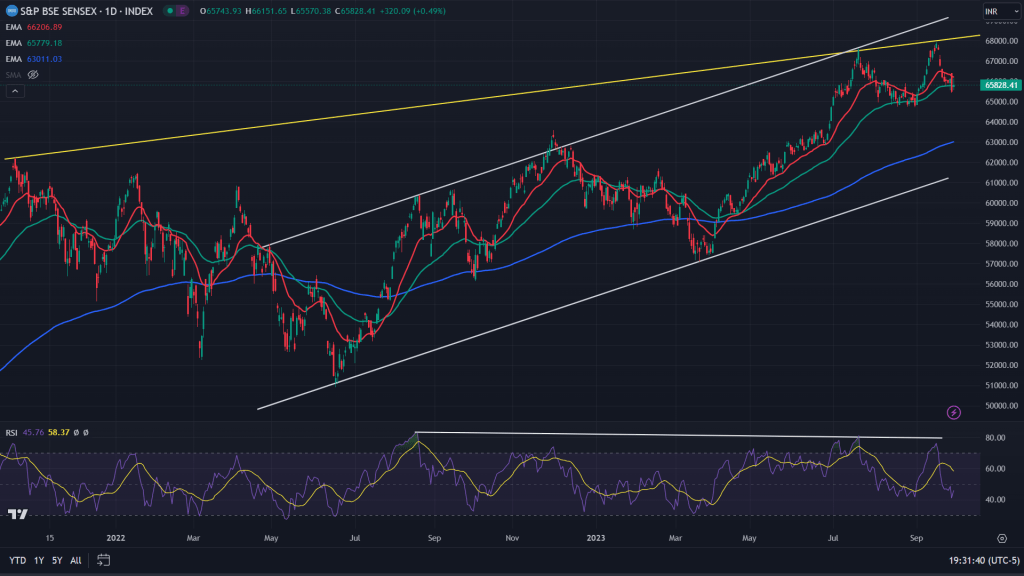
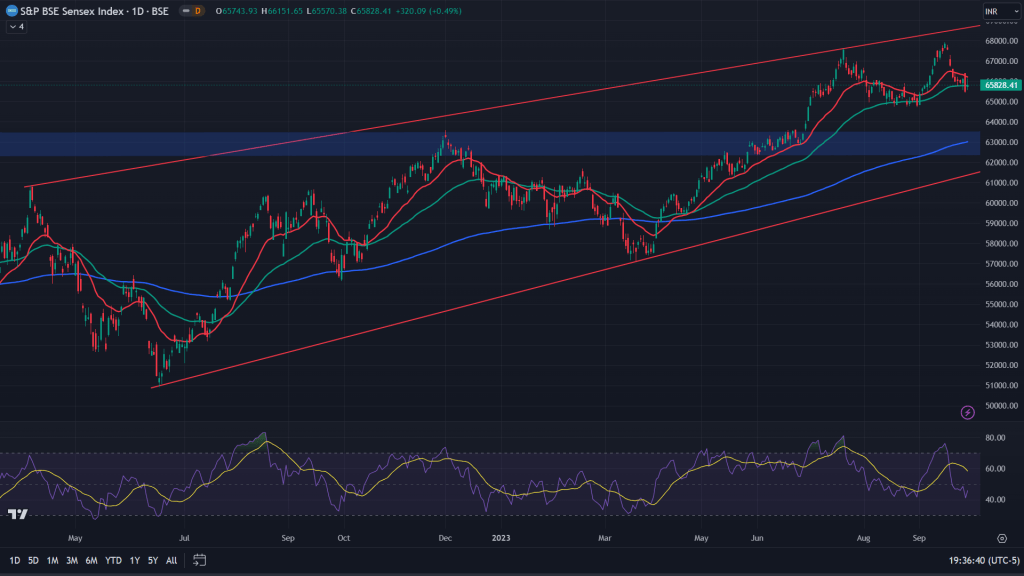
Sensex (Daily): The daily chart of Sensex shows signs of topping out. Reacting from the resistance (yellow trendline) at all time highs, RSI negatively diverged and flirting within 20-50 EMAs. If that wasn’t all, Friday’s bearish gravestone doji daily candle after Thursday’s big red candle, indicating bearish continuation.
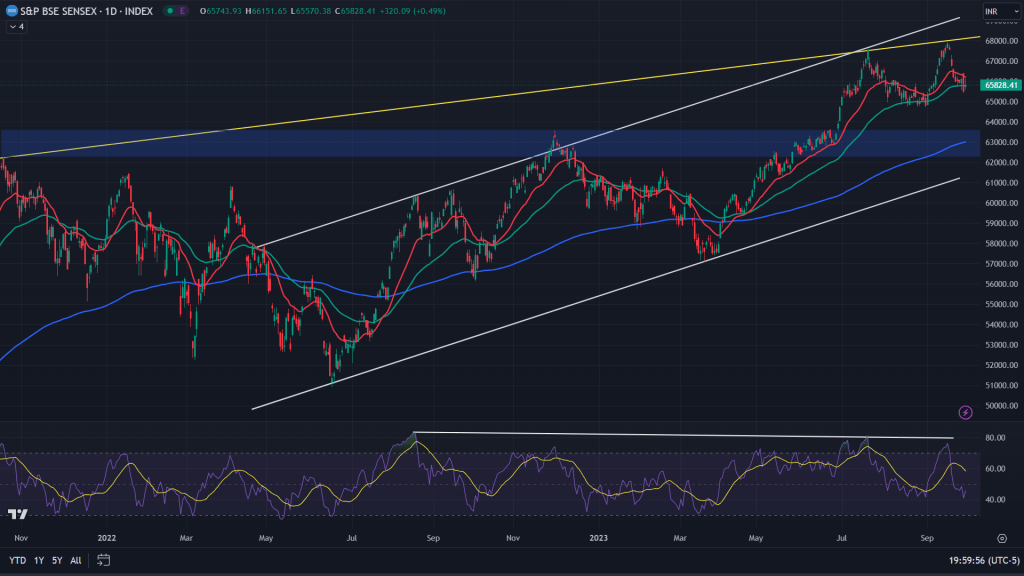
Alternative there is another wedge formation on the daily chart of Sensex and the topping out is visible here too wherein the new high couldn’t even reach higher end of the rising wedge (usually that’s the first sign when markets top out).
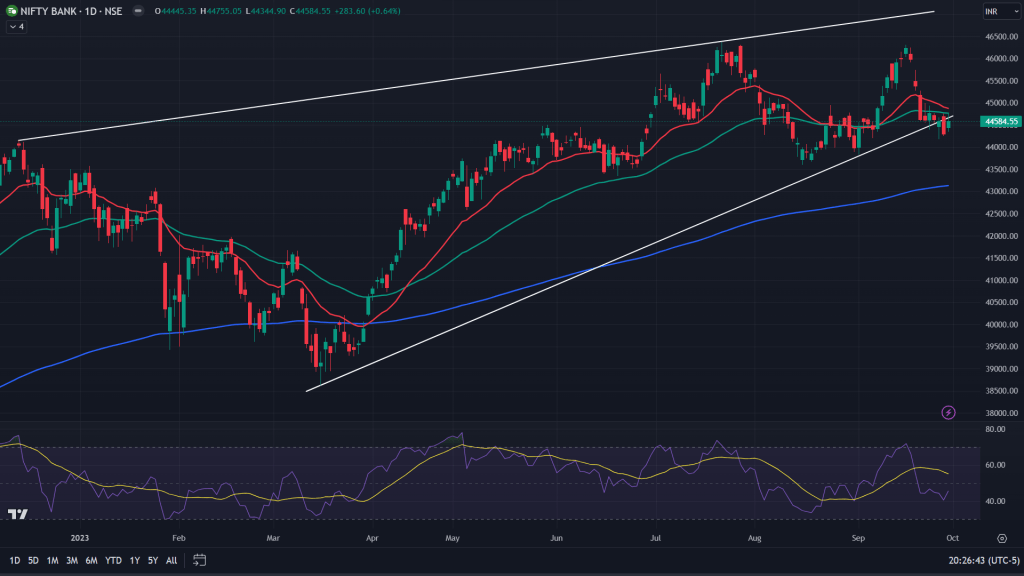
BankNifty (Daily): Banknifty although broke down of the bearish rising wedge, but yet hanging by just a thread on the daily chart and well below 20 and 50 EMAs. If that wasn’t enough, Friday’s daily candle was an inside bar, indication of bearish continuation after Thursday’s big red candle!
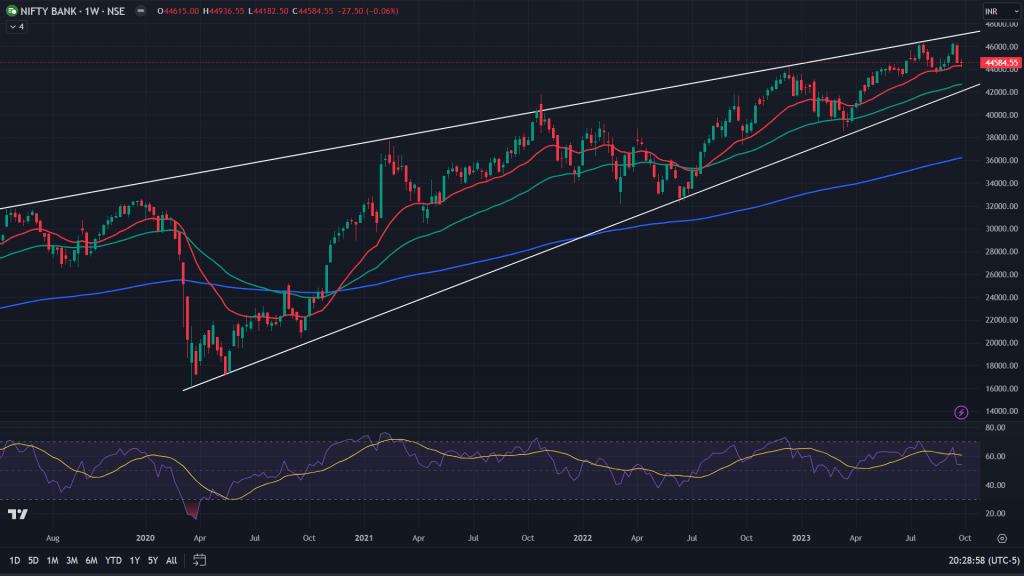
BankNifty (Weekly): If daily was bearish for BankNifty, weekly chart shows that all the more. Reacting from upper end of the weekly rising wedge with a big red candle in the previous week and last week closed with a doji weekly candle close – not a healthy sign at the top and after such a big bearish weekly candle in the previous week and right above 20 weeks EMA.
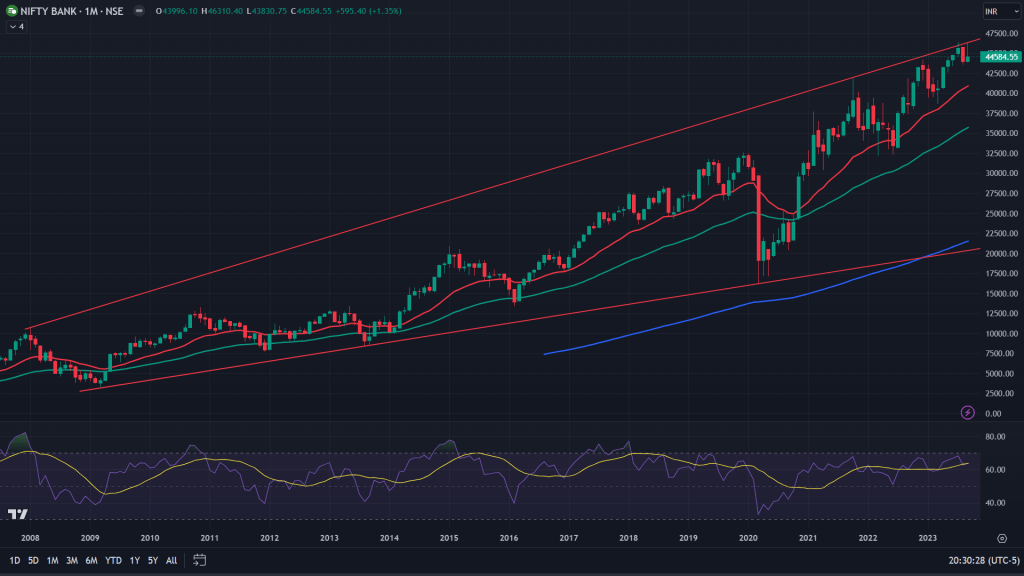
BankNifty (Monthly): Monthly close of September gave bears all the more reason to continue their bearish onslaught – August’s big red candle at thetop end of the megaphone, followed by monthly inverted hammer candle – More bearish than the daily and weekly.
Conclusion: If Sensex and Nifty can try to recover with the help of other sectors, banknifty alone is bearish enough for the bulls to be worried. Bears would be far more powerful to come down on the bulls with full force for the month of October. I would be going into the month of October with lightly weighing portfolio with some flavour of shorting banking names.

Leave a comment