There’s a reason why this headline is the way it is and you’ll know it once you read on. Let’s take a deep dive in, starting with lower time frames first:
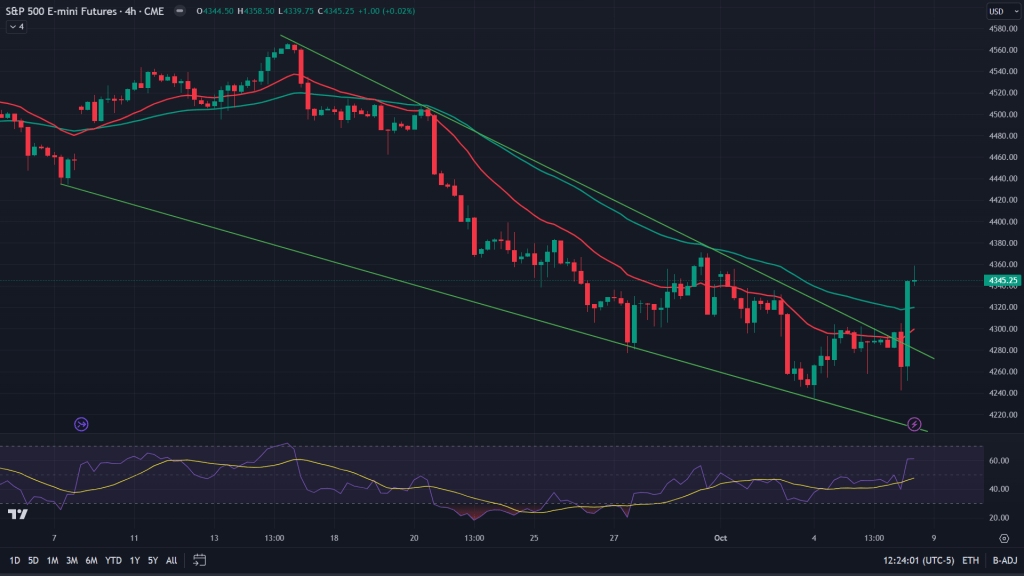
ES (4H): That red candle (third from right) after the NFP data was scary at first to start with. But the close of that candle was the first indication that probably market wants to rally from here. Why? As I have said in the past as well, that for a falling wedge or a descending channel to break out on the upside, it shouldn’t/wouldn’t usually make another attempt at the lower end of the wedge/channel. Which is what that red candle was all about. In fact no new low was in that red candle was in itself a positive sign. Then the next candle
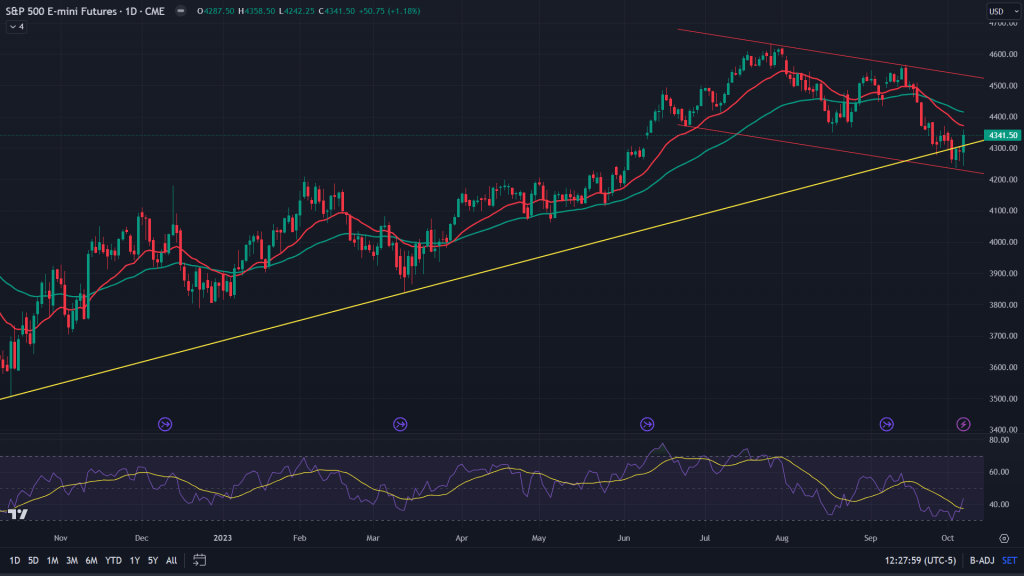
ES (Daily): What did that daily candle do on Friday? It managed to cross past a key trendline support that it broke down of earlier during the week, making it a failed breakdown.
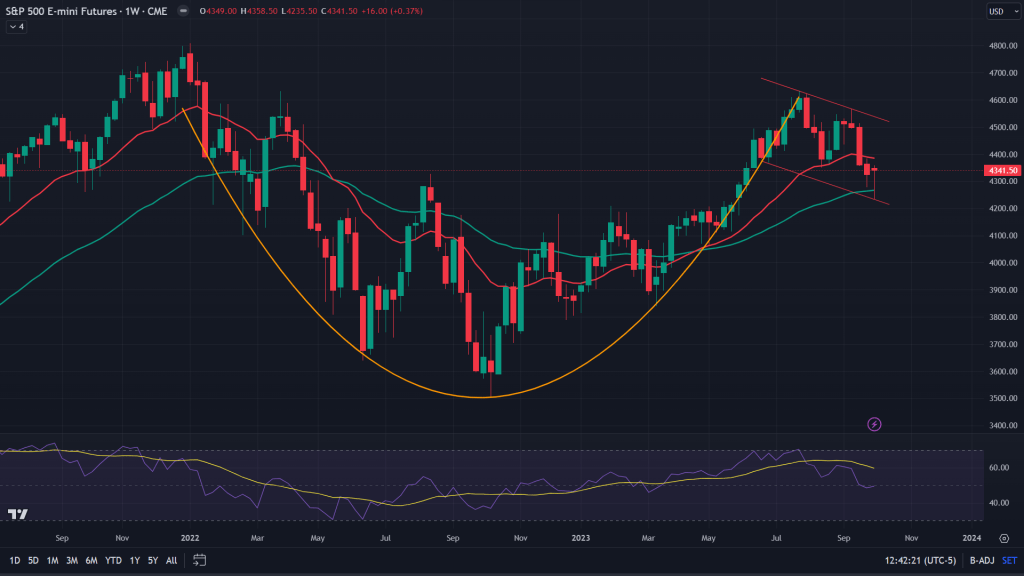
ES (Weekly): Dragonfly doji! That’s the word for the week gone by. Dragonfly doji is a bullish candle and if a week closes with that candle, on a critical support, it can’t get anymore bullish! ES managed this bounce in the previous week on a critical trendline support of the channel (also a bulls flag of cup and handle pattern). As posted in the previous week, this zone is critical for this bullish cup and handle pattern to materialise and the dragonfly doji gives us all the more reason to believe this pattern is still alive.
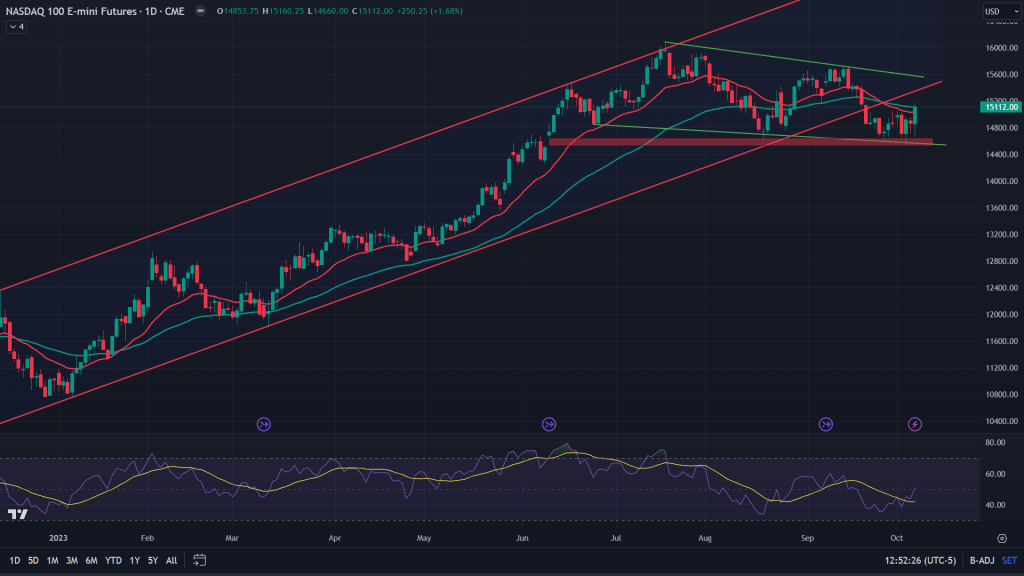
NQ (Daily): While, tech index Nasdaq did breakdown of this channel, but all it did was closed the gap (red area) that was left unfilled in the recent journey up. After the gap filling, NQ took support from the trendline support (green line).
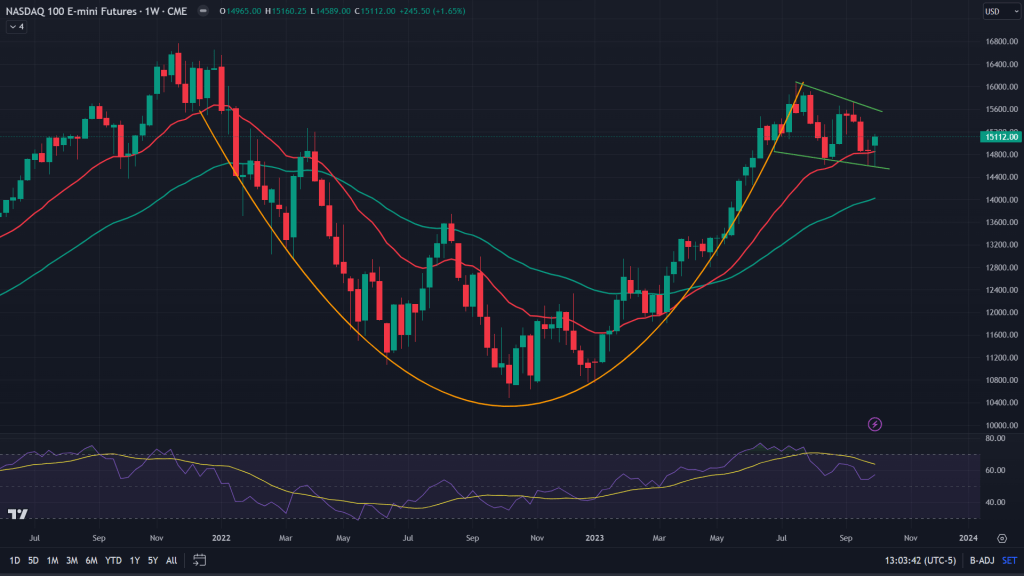
NQ (Weekly): From the weekly perspective, this trendline support mattered more because it forms the handle of the cup and handle pattern. 20EMA of the week has not given up. Icing on the cake – inverted hammer candle on the weekly chart! As bullish as ES.
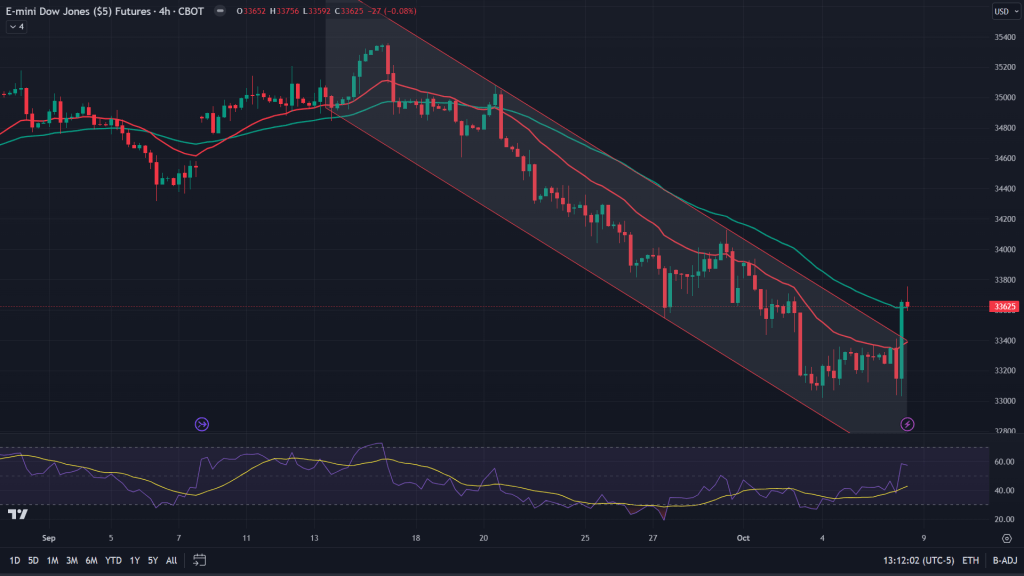
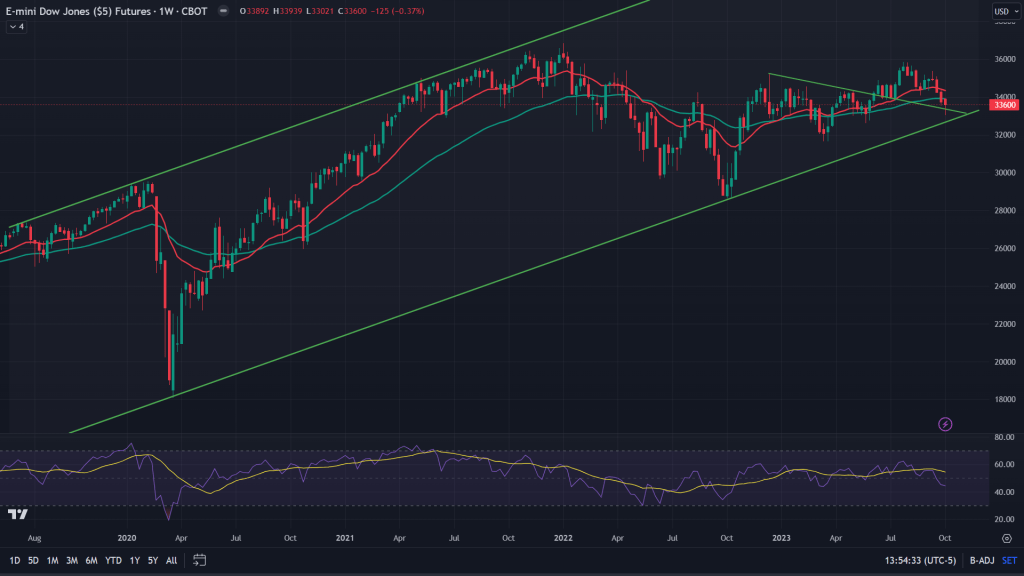
YM (4H): Dow jones, while has been weakest all along and fell hardest, there is slimmer of hope for the bulls as on the 4H charts, there is a small breakout off the channel that has been forming in this downturn.
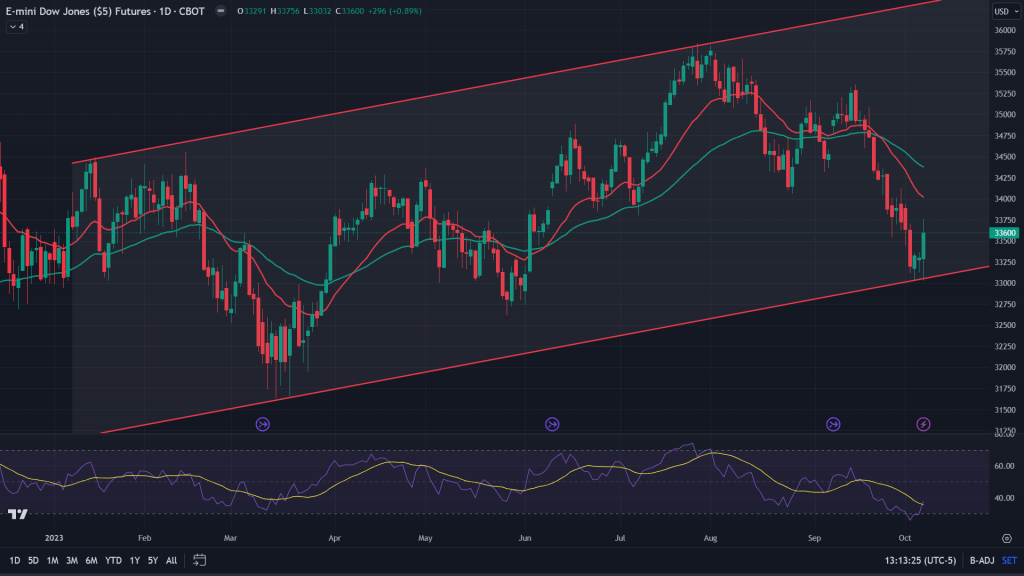
YM (Daily): call it a co-incidence or whatever, the bounce on Friday also co-incided with lower of the channel support that’s been holding for quite some time.
How far? Given this scenario of 4H breakout and bounce off the channel support, this bounce could lead upto the neckline support which was broken off the H&S few days ago – 34.200 that is!
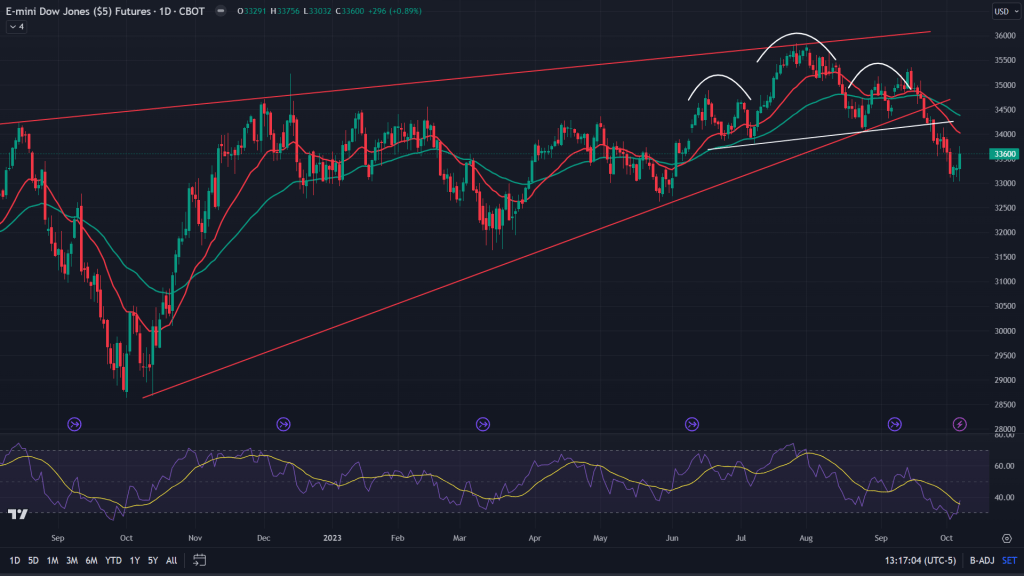
YM (Weekly): On the weekly, inverted hammer candle close gives more strength to the bulls to come back hard on the bears and try and rally back up. Plus point – there was a key trendline support that has helped bulls stay in the game.
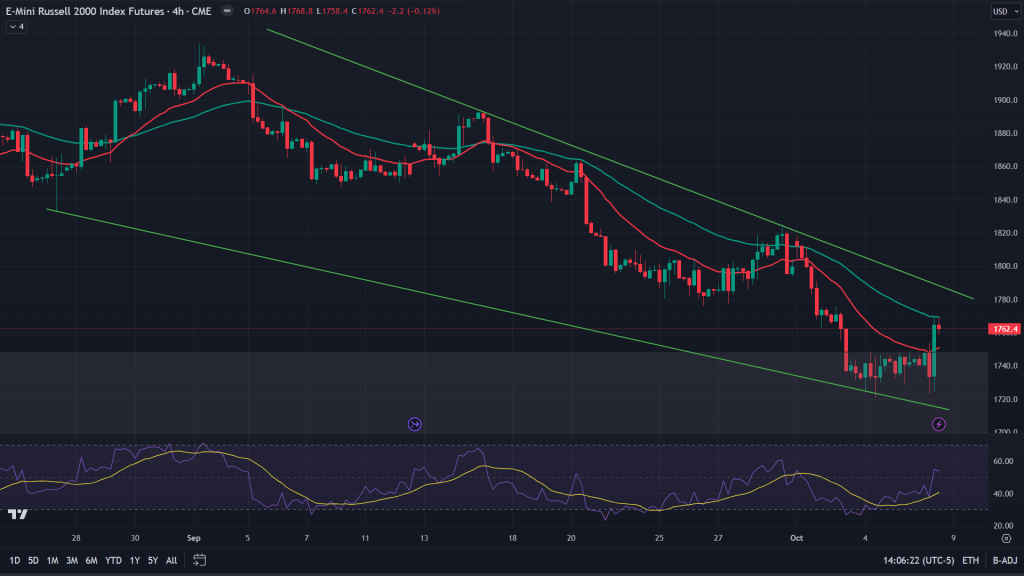
RTY (4H): Small caps – Russel 2000 index (RTY) has been as weak as the Dow Jones in this downtrend! It continues to be weak still. While all the other indexes have broken out on smaller time frames, RTY hasn’t.
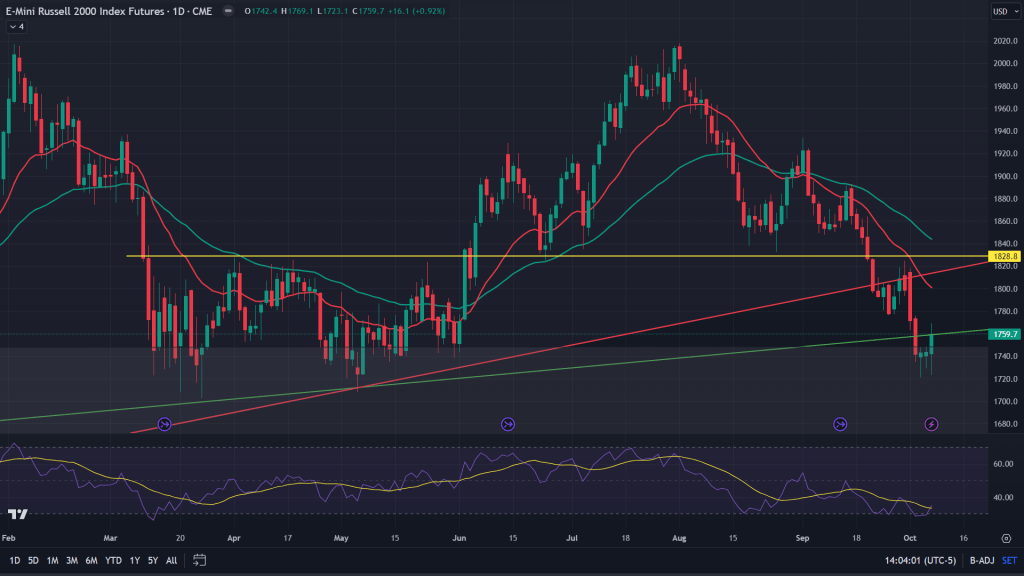
RTY (Daily): On the daily chart, it has bounced off the demand zone!
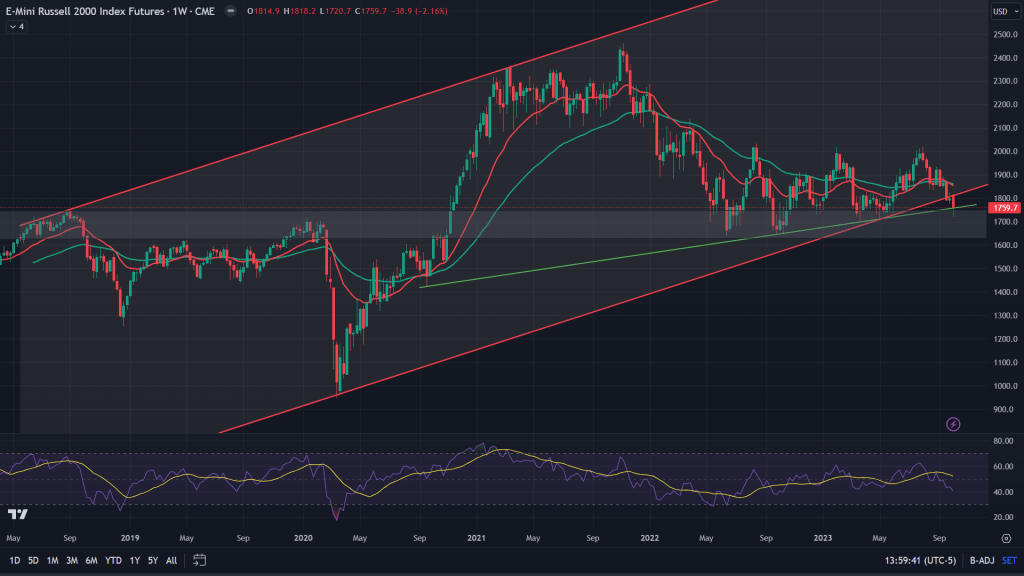
RTY (Weekly): When we zoom out, that green trendline was a critical support that has held throughout last year’s bear market and this year’s turbulence! It broke down and then bounced back up!
Conclusion: While, ES and NQ are bullish, especially their weekly candle formations and the supports off key trendlines, channels and MAs, small caps and industrial stocks don’t look too promising. I would prefer to buy the dips in the ES and NQ.
P.S.: Geopolitical developments of the weekend would add volatility to the market, which is typical of the October month. But if these developments were really bad, global markets would continue to bleed even as Russia-Ukraine infighting continues. Expect some knee-jerk reaction for now!
Weekly markets update on YouTube.

Leave a comment