Last week’s dragonfly formation was quite something, especially at key support and hence it was a reason enough to be bullish for the week gone by. Market certainly obliged us by rallying beyond 4400 and then came epic sell-offs. Let’s see what our charts are telling us now:
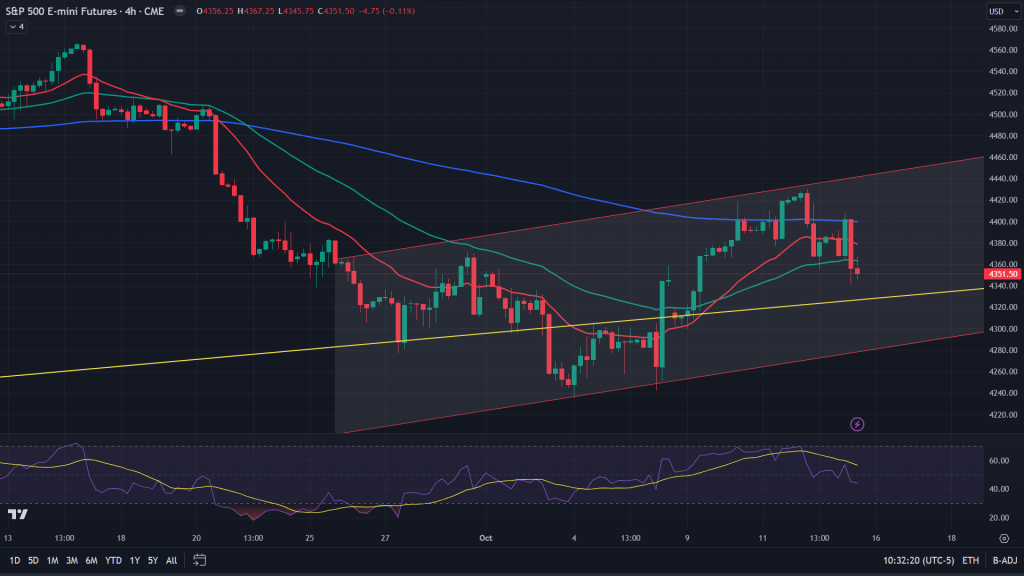
ES (4H): S&P 500 futures (ES) continues to be inside this channel, which could also be termed as bear flag and has been now rejected at upper end of this channel along with 200 MA of the 4H charts and would be bearish once it breaks down of this channel.
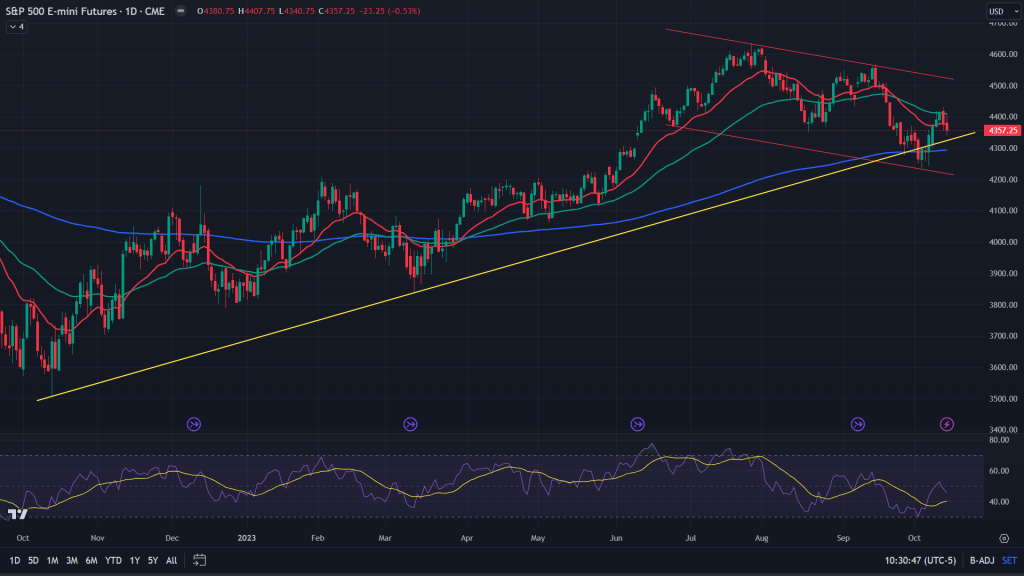
ES (Daily): Rejection from 20 and 50 EMAs on the daily is sign enough that markets wants to go down from here. Key point though, we managed to climb back above the key trendline support last week (yellow line). Bulls will have to defend that rigorously to keep their chances alive.
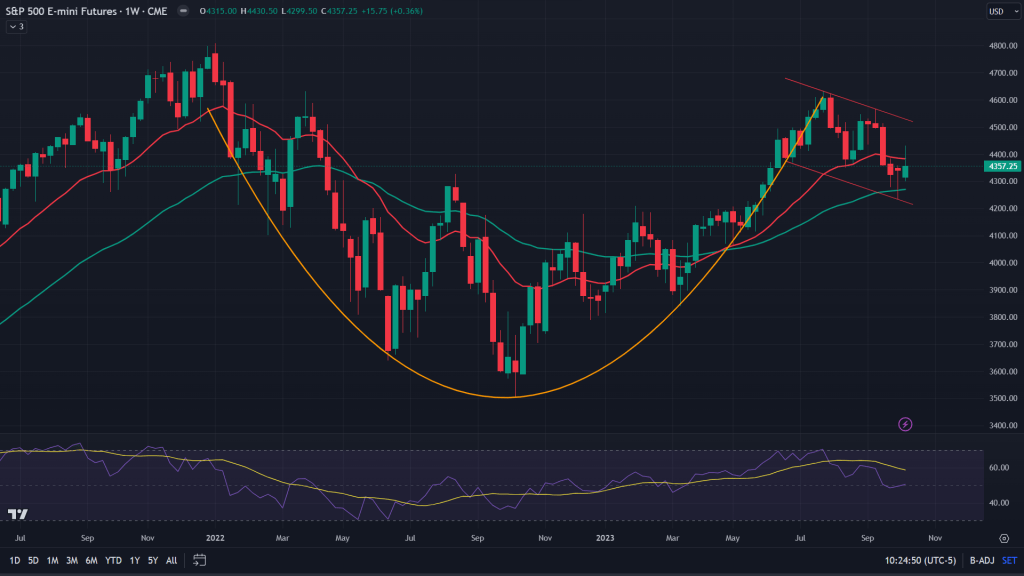
ES (Weekly): While all hopes have not been lost, but a fast and furious rally to 4500 has diminished. Especially with this inverted hammer of last week, there is every likelihood for bears to continue their onslaught for few more days before clarity emerges on this cup and handle pattern.
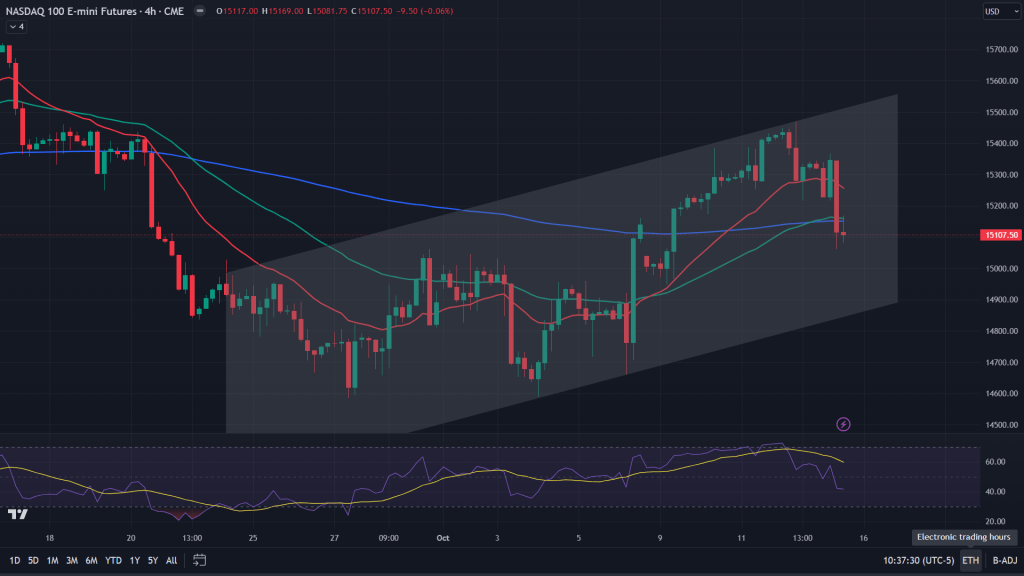
NQ (4H): Similar to ES even NQ has this channeled formation on the 4H chart and has been rejected from upper end of this channel, along wit giving up on the 200 MA.
NQ (Daily): On the daily chart though, bulls are still hopeful for a bounce as 20 and 50 MAs are still holding up. Next couple of days would be crucial from bulls’ perspective. What favors the bulls though – It has backtested the channel breakdown and bears have far more clarity of taking prices down.
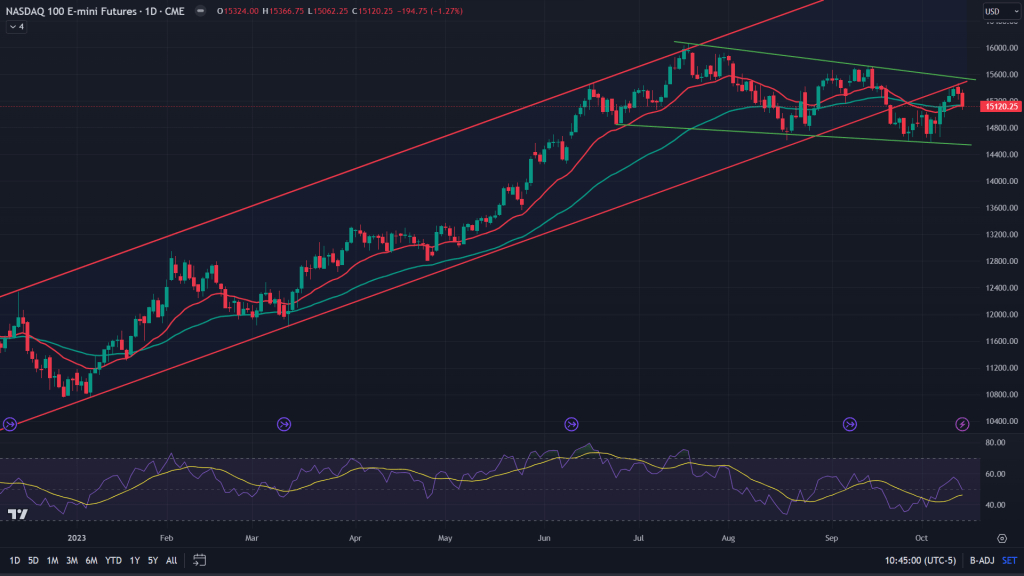
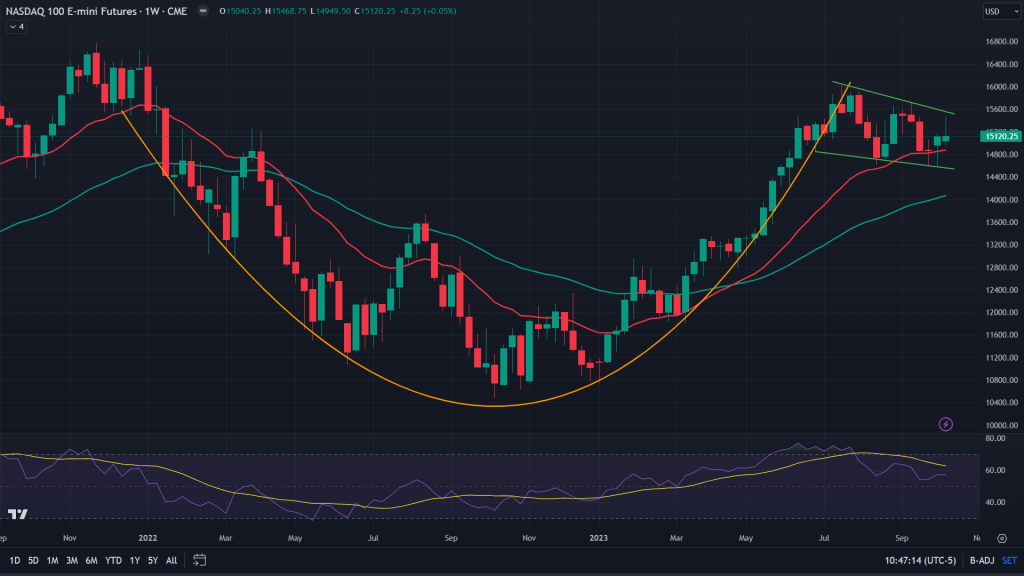
NQ (Weekly): On the weekly, NQ has been hammered invertly on that hammer of previous week – that is it has formed an inverse hammer candle and that’s bearish, especially when rejecting from upper end of the channel like formation.
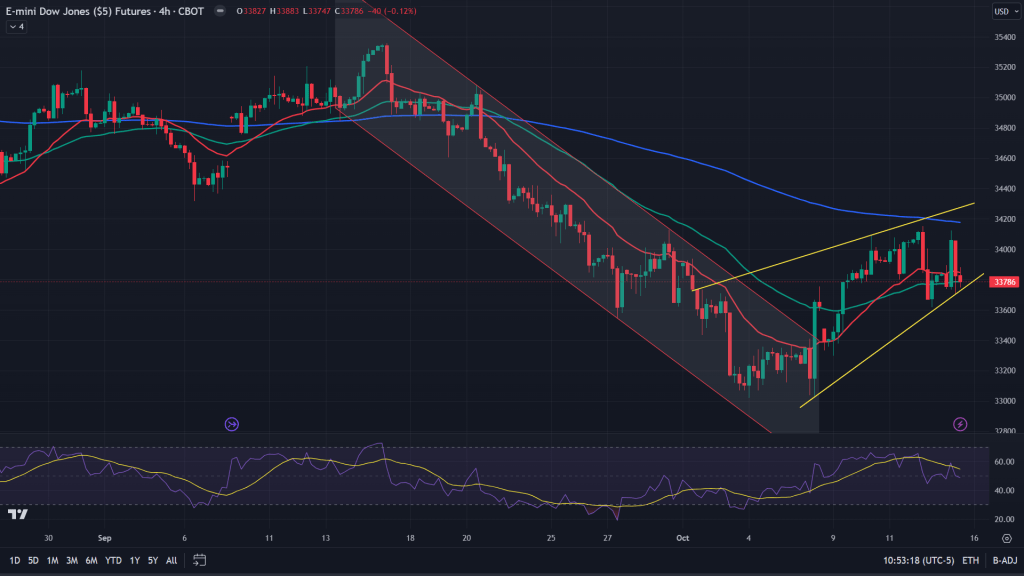
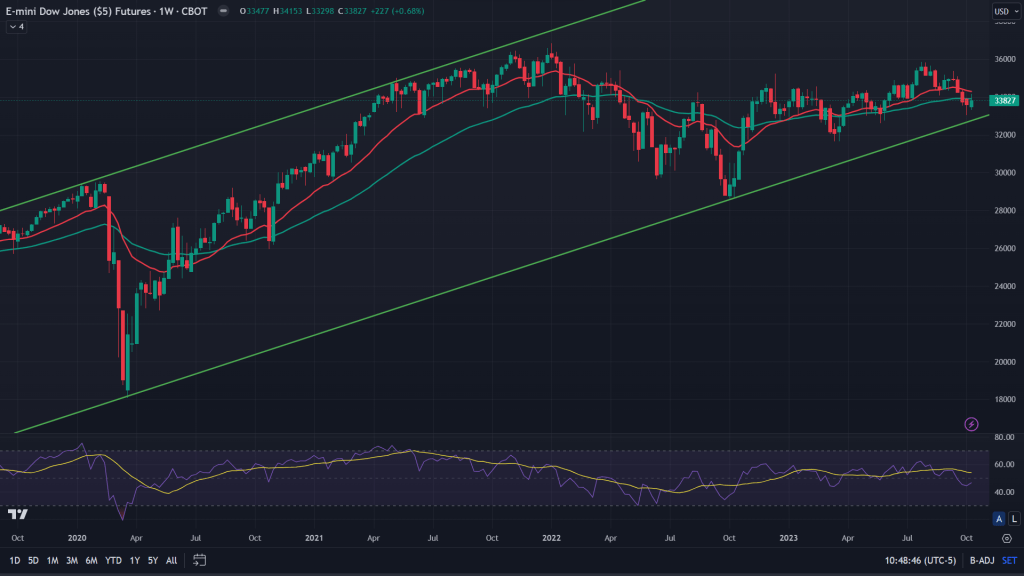
YM (4H): Dow Jones futures (YM) broke out, backtested and rallied on 4H chart of that channel (red) and continued to rally in rising wedge formation through the week. It has been rejected twice – once at the upper end of this wedge and again from 200 MA of the 4H candles. Every likelihood of it falling off this wedge in the next week, most likely on Monday/Tuesday itself.
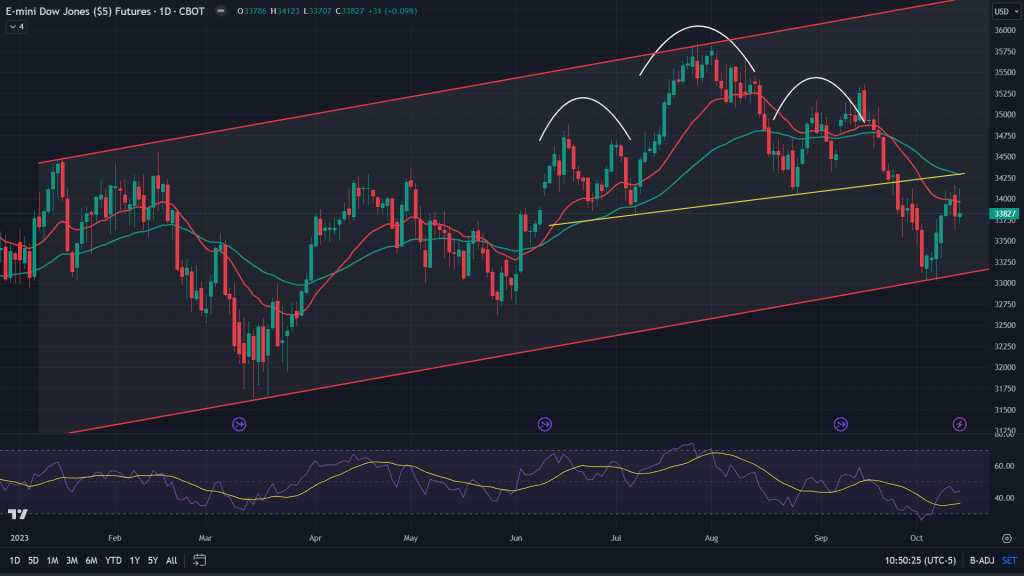
YM (Daily): When YM fell off this head and shoulders it certainly continued to fall and landed itself on this red channel that has long been forming. The bounce of last week was off this channel support and this rally has found resistance from the very neckline of this H&S which it broke down, couple weeks ago, along with rejecting the mean reversion of 20 EMA. Icing on the cake for the bears – evening star (some might call it inverted hammer) like candle formation which is bearish.
YM (Weekly): Zoom out further, the only thing worth noting on the weekly charts is that the price has rejected itself from the 50 and 20 EMAs of the weekly chart and now risks breaking down off this key channel that has long been holding and that would be catastrophic.
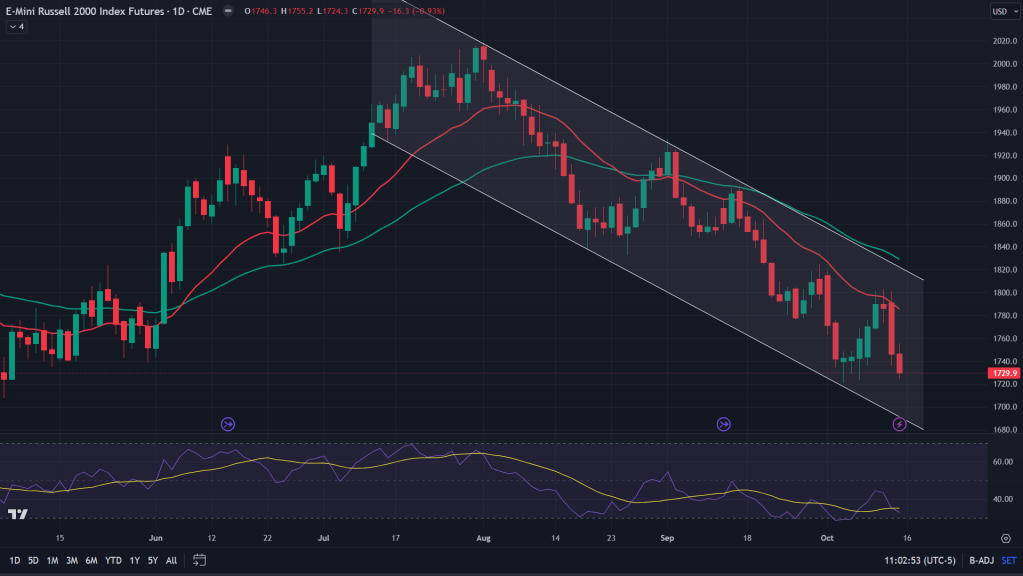
RTY (Daily): Russell 2000 small caps index futures (RTY), ever since it has started its descent from atop, is falling within this channel and has now been rejected off daily mean reversion of the 20 EMA. Not a healthy sign.
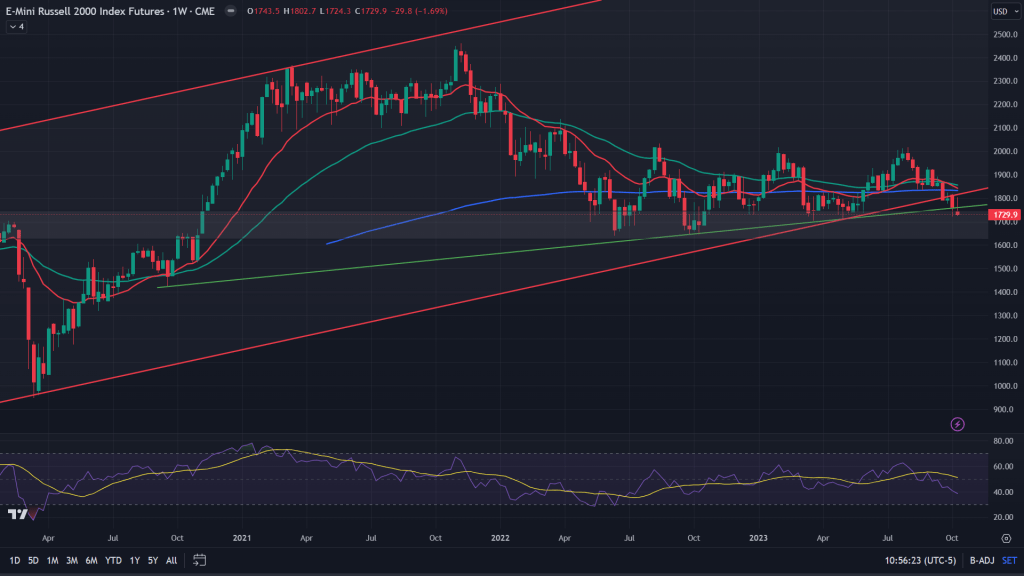
RTY (Weekly): Zoom out further, it has broken down off many key supports – 200 weeks MA (blue curve), trendline support (green line) and channel support (red line). Adding fire to the bears’ folly is the candle of the last week – inverted hammer. One would need some great catalysts for the bulls to come back stronger. May be some earnings? I doubt on those though.
Conclusion: While last couple of days of the week gone by have thwarted many bullish thesis, all the key index futures now are at the risk of breaking down big time. If that wasn’t enough, many large stocks have formed some bearish patterns and I would be posting those individual names on twitter on Monday. Stay tuned and have a great weekend!
Market outlook video:

Leave a comment